United States Restaurants Market, Forecast by Segment, Commercial Services by Sub-segment, Non-commercial Services by Sub-segment, Restaurant Expenditures, Key Players
Buy NowGet Free Customization in this Report
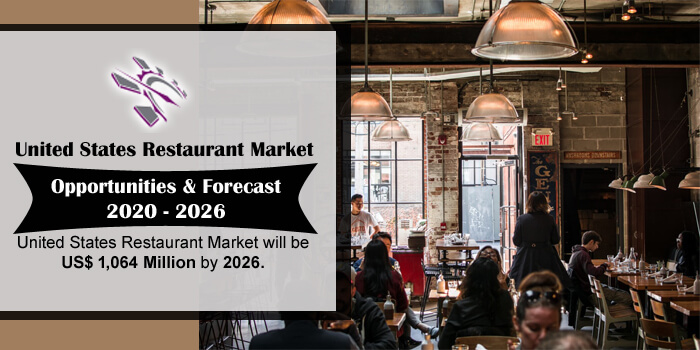
Dining out and eating in restaurants has become an essential part of the American people’s lifestyle. According to the Bureau of Labor Statistics survey in 2018, families with an annual income of at least US$ 70,000 were accountable for 63 percent of total restaurant spending. In the United States, people with higher household’s income have risen steadily over the years and has also contributed partially for the rise of restaurant industry sales. According to Renub Research report, United States Restaurant Market will be US$ 1,064 Million by 2026.

COVID Impact on Restaurant Industry of the United States
Due to COVID-19 pandemic, the government had to close the restaurants to stop the spread of disease. This had a cascading effect on the restaurant sector of the United States. It led to staff layoffs, a sharp decline in income for QSR chains and closure of many independent restaurants. However, according to our research, we feel that the worst is behind us and in the second half of the 2020 restaurant industry will revive. Once the vaccine will come into the market in October to November than USA restaurant industry will grow at a much faster rate in 2021.
Factors Driving the Market
• There has been significant growth in online ordering due to increased digitalization of foodservice.
• Demand for organic food is growing in United States homes, so it’s imperative that healthy and organic food will be the focus of restaurants.
• The use of robots in the hospitality industry is rising, thus solving the issue of high labour cost.
In this report, we have done complete assessments on United States Restaurant market by its segment as Commercial Restaurant Services, Non-commercial Restaurant Services, and Military Restaurant Services market. In addition to this how people in the United States dine out with their family, friends, acquaintances and contribute to the development of this industry.
Renub Research report titled “United States Restaurants Market by Segment (Commercial Restaurant Services, Non-commercial Restaurant Services and Military Restaurant Services), Commercial Restaurant Services Market by Sub-segment (Full-service Restaurants , Limited-Service Restaurant , Snack and Non-alcoholic Beverage Bars ,Cafeterias, Grill-buffets, and Buffets, Social Caterers, Bars and Taverns and Others), Non-commercial Restaurant Services Market by Sub-segment (Hospitals, Recreation and Sports Centers, Nursing Homes, Colleges and Universities, Primary and Secondary Schools, Community Centers, Transportation and Others) Restaurant Expenditures (Full-service Restaurants and Limited-service restaurants) Key Players (Mcdonald's Corp., Yum! Brands Inc., Restaurant Brands International Inc., Starbucks Corp., Chipotle Mexican Grill Inc.)” provides an all-encompassing analysis on the United States Restaurants Industry.
By Segment: USA Restaurant Market has been divided into 3 Segments which is further divided into Sub-segments
• Commercial Restaurant Services
• Noncommercial Restaurant Services
• Military Restaurant Services

Sub-segment – Commercial Restaurant Market is divided into 7 Sub-segments
1. Full-service Restaurants
2. Limited-Service Restaurant
3. Snack and Non-alcoholic Beverage Bars
4. Cafeterias, Grill-buffets, and Buffets
5. Social Caterers
6. Bars and Taverns
7. Others
Sub-segment - Non-commercial Restaurant Market is divided into 8 Sub-segments
1. Hospitals
2. Recreation and Sports Centers
3. Nursing Homes
4. Colleges and Universities
5. Primary and Secondary Schools
6. Community Centers
7. Transportation
8. Others
Restaurant Expenditures: This section covers Restaurant Expenditure Breakup for both the Restaurants
• Full-service Restaurants
• Limited-service Restaurants
All the Restaurant Brands have been covered from 3 Viewpoints
• Overview
• Recent Initiatives
• Revenue Analysis
Company Analysis
• Starbucks
• YUM! Brands, Inc
• McDonald's
• Restaurant Brands International Inc
• Chipotle
If the information you seek is not included in the current scope of the study kindly share your specific requirements with our custom research team at info@renub.com
1. Introduction
2. Research & Methodology
3. Executive Summary
4. Market Dynamics
4.1 Growth Drivers
4.2 Challenges
5. Market Analysis - United States Restaurant
6. Share Analysis
6.1 Segment
6.2 Type
6.2.1 Commercial Restaurant
6.2.2 Non-Commercial Restaurant
7. Segment - Market Analysis
7.1 Commercial Restaurant Services
7.2 Non-commercial Restaurant Services
7.3 Military Restaurant Services
8. Sub-segment Market - Commercial Restaurant Services
8.1 Full Service Restaurants
8.2 Limited Service Restaurant
8.3 Snack and Nonalcoholic Beverage Bars
8.4 Cafeterias, Grill-Buffets, and Buffets
8.5 Social Caterers
8.6 Bars and Taverns
8.7 Others
9. Sub-segment Market – Non-commercial Restaurant Services
9.1 Hospitals
9.2 Recreation and sports centers
9.3 Nursing Homes
9.4 Colleges and Universities
9.5 Primary and Secondary Schools
9.6 Community Centers
9.7 Transportation
9.8 Others
10. Total Restaurant and Food Service Jobs
11. Restaurant Expenditures
11.1 Full Service Restaurants
11.2 Limited Service Restaurants
12. Company Analysis
12.1 Starbucks
12.1.1 Overview
12.1.2 Recent Developments
12.1.3 Revenues
12.2 YUM! Brands, Inc
12.2.1 Overview
12.2.2 Recent Developments
12.2.3 Revenues
12.3 McDonald's
12.3.1 Overview
12.3.2 Recent Developments
12.3.3 Revenues
12.4 Restaurant Brands International Inc.
12.4.1 Overview
12.4.2 Recent Developments
12.4.3 Revenues
12.5 Chipotle
12.5.1 Overview
12.5.2 Recent Developments
12.5.3 Revenues
List of Figures:
Figure-01: United States Restaurant Market (Billion US$ ), 2017 – 2019
Figure-02: Forecast for United States Restaurant Market (Billion US$ ), 2020 – 2026
Figure-03: United States – Restaurant Market Share By Segment (Percentage), 2017 – 2019
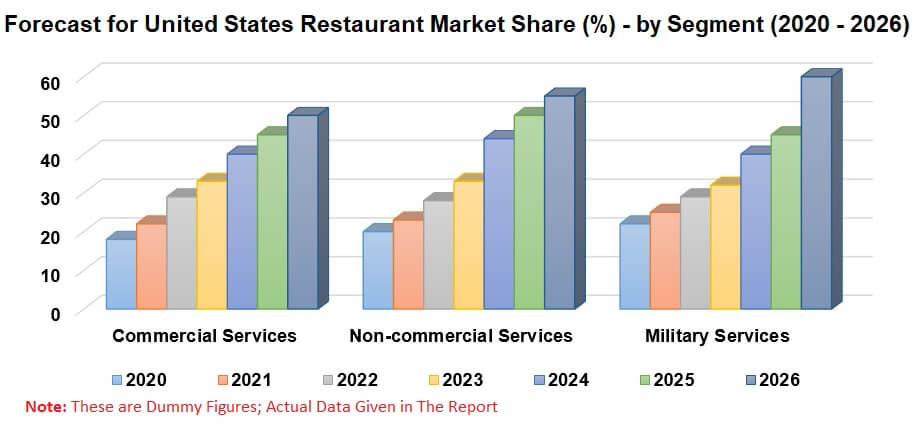
Figure-04: United States – Forecast for Restaurant Market By Segment (Percentage) , 2020 – 2026
Figure-05: United States – Commercial Restaurant Market Share by Type (Percentage), 2017 – 2019
Figure-06: United States – Forecast for Commercial Restaurant Market Share by Type (Percentage), 2020 – 2026
Figure-07: United States – Non-Commercial Restaurant Market Share by Type (Percentage), 2017 – 2019
Figure-08: United States – Forecast for – Non-Commercial Restaurant Market Share by Type (Percentage) , 2020 – 2026
Figure-09: United States – Total Restaurant and Foodservice Jobs (Million ), 2017 – 2019
Figure-10: United States – Forecast for Total Restaurant and Foodservice Jobs (Million ), 2020 – 2026
Figure-11: United States – Commercial Restaurant Services (Billion US$), 2017 – 2019
Figure-12: United States – Forecast for Commercial Restaurant Services Market (Billion US$), 2020 – 2026
Figure-13: United States – Noncommercial Restaurants Services Market (Billion US$), 2017 – 2019
Figure-14: United States – Forecast for Noncommercial Restaurants Services Market (Billion US$), 2017 – 2019
Figure-15: United States – Military Restaurant Services Market (Billion US$) 2017 – 2019
Figure-16: United States – Forecast for Military Restaurant Services Market (Billion US$) , 2020 – 2026
Figure-17: United States – Full-service Restaurant Market (Billion US$) 2017 – 2019
Figure-18: United States – Forecast for Full-service restaurants Restaurant market (Billion US$) 2020 – 2026
Figure-19: United States – Limited-Service Restaurant Market (Billion US$), 2017 – 2019
Figure-20: United States – Forecast for Limited Service Restaurant (Billion Pound), 2020 – 2026
Figure-21: United States – Snack and nonalcoholic beverage bars Market (Billion US$), 2017 – 2019
Figure-22: United States – Forecast for Snack and nonalcoholic beverage bars Market (Billion US$), 2020 – 2026
Figure-23: United States – Cafeterias, grill-buffets, and buffets Market (Billion US$), 2017 – 2019
Figure-24: United States – Forecast for Cafeterias, grill-buffets, and buffets Market (Billion US$), 2020 – 2026
Figure-25: United States – Social caterers Market (Billion US$), 2017 – 2019
Figure-26: United States – Forecast for Social caterers Market (Billion US$), 2020 – 2026
Figure-27: United States – Bars and taverns Market (Billion US$), 2017 – 2019
Figure-28: United States – Forecast for Bars and taverns Market (Billion US$), 2020 – 2026
Figure-29: United States – Other Restaurant Market (Billion US$), 2017 – 2019
Figure-30: United States – Forecast for Other Restaurant Market (Billion US$),2020 – 2026
Figure-31: United States – Hospitals Market (Billion US$), 2017 – 2019
Figure-32: United States –Forecast for Hospitals Market (Billion US$), 2020 – 2026
Figure-33: United States – Recreation and sports centers Market (Billion US$), 2017 – 2019
Figure-34: United States – Forecast for Other Recreation and sports centers Market (Billion US$), 2020 – 2026
Figure-35: United States – Nursing homes Market (Billion US$), 2017 – 2019
Figure-36: United States – Forecast for Nursing homes Market (Billion US$), 2020 – 2026
Figure-37: United States – Colleges and universities Market (Billion US$), 2017 – 2019
Figure-38: United States – Forecast for Colleges and universities Market (Billion US$), 2020 – 2026
Figure-39: United States – Primary and secondary schools Market (Billion US$), 2017 – 2019
Figure-40: United States – Forecast for Primary and secondary schools Market (Billion US$), 2020 – 2026
Figure-41: United States – Community Centers Market (Billion US$), 2017 – 2019
Figure-42: United States – Forecast for Community Centers Market (Billion US$), 2020 – 2026
Figure-43: United States – Transportation Market (Billion US$), 2017 – 2019
Figure-44: United States – Forecast for Transportation Market (Billion US$), 2020 – 2026
Figure-45: United States – Other Restaurant Market (Billion US$), 2017 – 2019
Figure-46: United States – Forecast for Other Restaurant Market (Billion US$), 2020 – 2026
Figure-47: United States – Full-service restaurants Expenditure (In Percentage)
Figure-48: United States – Limited-service restaurants Expenditure (In Percentage)
Figure-49: Starbucks – Global Revenue (Million US$), 2017 – 2019
Figure-50: Starbucks – Forecast for Global Revenue (Million US$), 2020 – 2026
Figure-51: YUM! Brands – Global Revenue (Million US$), 2017 – 2019
Figure-52: YUM! Brands – Forecast for Global Revenue (Million US$), 2020 – 2026
Figure-53: McDonald's – Global Revenue (Million US$), 2017 – 2019
Figure-54: McDonald's – Forecast for Global Revenue (Million US$), 2020 – 2026
Figure-55: Restaurant Brands International Inc. – Global Revenue (Million US$), 2017 – 2019
Figure-56: Restaurant Brands International Inc. – Forecast for Global Revenue (Million US$), 2020 – 2026
Figure-57: Chipotle – Global Revenue (Million US$), 2017 – 2019
Figure-58: Chipotle – Forecast for Global Revenue (Million US$), 2020 – 2026
Reach out to us
Call us on
USA: +1-478-202-3244
INDIA: +91-120-421-9822
Drop us an email at
info@renub.com