Organic Fertilizer Market Size and Share Analysis - Growth Trends and Forecast Report 2025-2033
Buy NowOrganic Fertilizers Market Size and Forecast 2025-2033
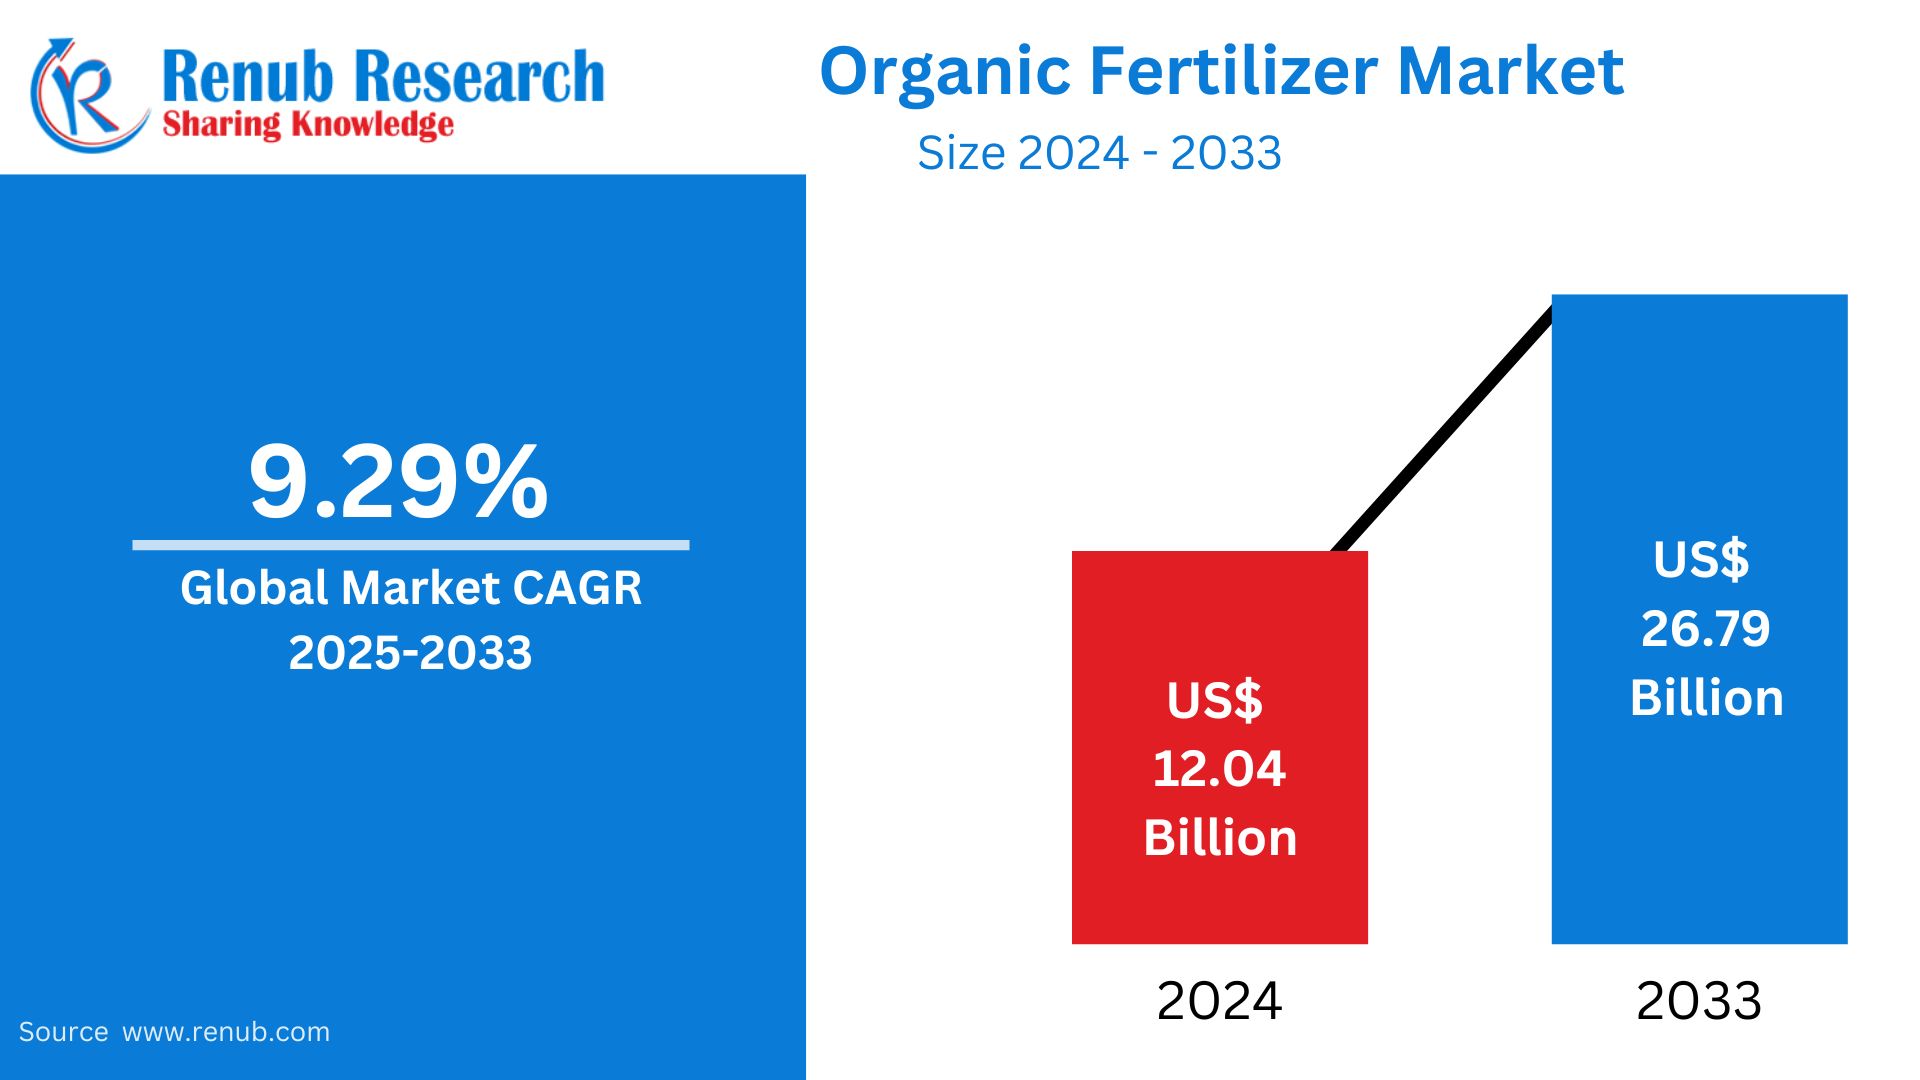
The global organic fertilizers market is expected to grow with high value, and it will increase from US$ 12.04 billion in 2024 to about US$ 26.79 billion by 2033, with a compound annual growth rate of 9.29% between 2025 and 2033. This growth will be due to the growing demand for organic produce from consumers, awareness of sustainable farming practices, and the need for environmental regulations limiting the use of chemical fertilizers.
The report Organic Fertilizer Market & Forecast covers by Sources (Plant Based, Animal Based, Synthetic Based), Mode of Application, (Seed Treatment, Soil Treatment, Root Dripping), Product Type, ((Microorganism), Azospirillum, Cyanobacteria, Phosphate-Solublizing Bacteria, Azolla, Aulosira, Rhizobium, Azotobacter, (Organic Residues) Farm Yard Manure, Crop Residue, Green Manure, Other Products)), Crop Type (Cereals & Grains, Oilseeds & Pulses, Fruits & Vegetables Others), Form (Dry, Liquid) Regions and Company Analysis 2025-2033.
Organic Fertilizers Market Overview
Organic fertilizers are natural materials obtained from plant, animal, or mineral sources that offer the soil with necessary nutrients and promote healthy plant growth. Unlike synthetic fertilizers, they are free from harmful chemicals and contribute to sustainable farming practices by improving soil structure, fertility, and microbial activity. Examples include compost, manure, bone meal, blood meal, and seaweed extracts.
Organic fertilizers majorly feed the soil with nutrients such as nitrogen, phosphorus, and potassium (NPK). These nutrients are crucial in the development of plants. They provide the soil with long-term nutrients that prevent washing away the nutrient into the water bodies. Organic fertilizers improve the soil water holding capacity; hence the plants are more drought tolerant. They are widely applied in organic farming, home gardening, landscaping, and large-scale agriculture. Besides contributing nutrients, organic fertilizers are environmental-friendly by reducing the usage of chemical fertilizers, promoting biodiversity, and also helping in curbing the climate change effects through carbon sequestration.
Growth Driver in the Organic Fertilizer Market
Growing Demand for Organic Food
A growing demand for organic food is a growth driver in the organic fertilizer market. Health-conscious consumers are opting for chemical-free nutrient-rich produce, which is causing an increase in organic farming activities worldwide. Other initiatives and certifications by governments promoting organic farming increase demand for organic fertilizers. Increased use of organic fertilizers arises as the retail chains and food industries expand their lines of organic products. Such a trend is highly potential in the developed regions, North America and Europe; Asian-Pacific regions are emerging to be more rapidly adopted mainly through export-led organic farming expansion. Organic farming is carried out in 188 countries; more than 96 million hectares of agricultural land are currently managed organically by at least 4.5 million farmers in 2022.
Environmental Concern and Regulatory Support
Increased attention to environmental degradation through the use of chemical fertilizers has led to the surge in interest in organic counterparts. Organic fertilizers control soil degradation, decrease the pollution of water, and increase biodiversity. Worldwide, governments are imposing strict regulations on the use of chemical fertilizers. This has opened up an opportunity for organic fertilizers. Incentives, subsidies, and training programs are being given to farmers to adopt sustainable practices. Organic fertilizers align with global sustainability goals, such as those in the UN's Sustainable Development Goals, which is further fueling demand. All these factors make organic fertilizers a preferred choice for environmentally conscious farming systems. Nov 2024, All businesses and people undertaking organic production, processing, importation, or sales in China should be registered under the mandatory measures related to the accreditation of organic products.
Organic Fertilizer Technology Advances
Technological changes in organic fertilizer manufacturing are transforming this market and making these products more effective and easier to access. Improvements include advances in microbial formulations, slow-release technologies, and in the manufacture of biofertilizers, thus optimizing nutrient supply and benefits from soil health. Advanced processing methods decrease odors and pathogens in organic fertilizers from animals, thus making them more attractive. Improvements in packaging and distribution channels have made organic fertilizers more convenient for farmers and gardeners. Moreover, research into integrating organic fertilizers with precision farming technologies has optimized application rates, thereby reducing waste and costs. All these improvements make organic fertilizers competitive with synthetic options, thus speeding up their adoption in the global market. In July 2024, Terraplant, a Brazilian company, announced the launch of MinerOxi+, Brazil's first 3-in-1 organometal fertilizer.
Challenges in the Organic Fertilizer Market
High Production Cost
One of the most significant challenges in the organic fertilizer market is the relatively high production cost compared to synthetic fertilizers. Organic fertilizers need extensive processing to ensure safety, nutrient consistency, and quality. Sourcing raw materials such as animal waste, crop residues, and minerals is costly especially in regions with low availability of organic waste. Production often requires laborious steps and sophisticated technologies further pushing up costs. These add up to end-user prices and, therefore, less accessible organic fertilizers to small-scale farmers. Such a situation can only be solved through innovations in terms of efficient production and through government subsidy for affordability purposes.
Low Nutrient Content and Slow Release
Organic fertilizers usually contain lesser nutrient concentration than synthetic fertilizers. They require larger amounts to obtain the same effects. This makes transportation, storage, and application a hassle for farmers. Furthermore, organic fertilizers gradually release nutrients, which might not meet the crop's immediate nutritional requirements during its critical growth stages. Such a slow action can limit their use in large-scale commercial farming, where fast crop cycles demand quick nutrient delivery. Improvement of formulations, such as organic fertilizers fortified with essential nutrients, or the integration of these fertilizers with precise application techniques to maximize nutrient availability, addresses this challenge and meets the specific demands of modern agriculture.
Animal-Based Fertilizers
Animal-based fertilizers are manure, bone meal, and blood meal, which are high in nutrients such as nitrogen, phosphorus, and calcium. These fertilizers feed the plants and enhance soil structure and microbial biodiversity. Widespread application in organic farming and home gardening gives slow-release nutrients for an extended period. Recycling of wastes and growing attention to the sustainability of agriculture is what is increasing demand for these animal-based fertilizers. North America and Europe with large-scale livestock farming operations are primary sources. Techniques of processing these fertilizers are improving over time along with better quality and efficiency.
Mineral-Based Fertilizers Market
Mineral-based organic fertilizers are very crucial in enriching the soils with nutrient content, extracted from naturally occurring minerals like rock phosphate, gypsum, and greensand. They provide major elements like phosphorus and potassium, trace minerals important for plant development. Therefore, they are commonly utilized in farming systems requiring long term soil enrichment. Mineral-based fertilizers are also used because they are considered non-toxic and friendly in organic farming. With growing awareness about soil health and environmental conservation, these fertilizers are becoming popular across the world. Technological advancement in mining and processing has made them more accessible and affordable, thereby driving the market.
Animal-Based Organic Fertilizer Market
Animal-based organic fertilizers hold the largest share in the organic fertilizer market. These fertilizers provide nitrogen, phosphorus, and potassium essential for plant growth through cattle manure, bone meal, or fish emulsion. These fertilizers improve soil structure, microbial activity, and long-term soil fitness, which farmers prefer for accessibility and cost-effectiveness. Their natural origin is consistent with the principles of organic farming, and it is likely to appeal to the environmentally conscious consumer. The nutrient density, soil-enriching properties, and compatibility with natural practices support the animal-based sources in the organic fertilizer market.
Organic Soil Treatment Fertilizer Market
Soil treatment holds a critical position in the international organic fertilizer market. Organic fertilizers, including compost, biochar, and vermicompost, are nutrient-rich and improve soil structure and water retention. Such treatments stimulate microbial interest and create the most ideal conditions for plant growth. The growing concerns over degradation of soil and environmental degradation boost the demand for soil treatment products. Their natural base appeals to the environmentally conscious farmer, who is looking towards an eco-friendly farming system. Thus, retaining a huge amount of the organic fertilizer market can ensure agricultural sustainability while improving crop productivity.
Organic Microorganisms Fertilizer Market
Organic matter in fertilizers, compost, and manure is decomposed by good microorganisms, including fungi and microbes. Nutrient cycling accelerates through microbial activity and improves the overall fitness of the soil by allowing the conversion of organic matter into valuable compounds in favor of plant growth due to enriched soil fertility. Besides, these microorganisms enhance the soil structure, water-holding capacity, and also suppress diseases that enhance the growth of sustainable agriculture. Therefore, their critical role in nutrient recycling and regeneration makes microorganisms very crucial to the organic fertilizer market while promoting environmentally friendly and productive farming practices.
Organic Cereals and Grains Fertilizer Market
Cereals and grains are leading in terms of the global area cultivation in the organic fertilizer market. Organic fertilizers, such as compost and manure, supply necessary nutrients to those crops, which help in healthy growth and yield. Being staple foods, cereals and grains have a significant monetary value, and the use of organic fertilizers is promoted to cater to the consumer's demand for environment-friendly produce. Additionally, those crops have improved soil fertility and structure, which is enhanced by organic fertilizers, making them more resilient to pests and diseases.
Organic Dry Fertilizer Market
The dry fertilizer formulations with pelleted compost or powdered bone meal offer the convenience of dosage and application technique suitable for many farming practices. Their long shelf life and resistance to degradation make it easy to store and transport with minimal logistical hassle. Additionally, dry fertilizers allow for exact management of nutrients, ensuring that little nutrient goes to waste. Due to its reliability, affordability, and compatibility with mechanized farming, farmers opt for dry organic fertilizers, creating a staple need in the organic fertilizer market.
US Organic Dry Fertilizer Market
The US organic dry fertilizer market is growing at a steady rate, driven by the rise in adoption of sustainable agricultural practices as well as the increasing demand for organic produce. Organic dry fertilizers are organic products made from natural sources like bone meal, blood meal, and rock phosphate, and they are widely used for organic farming to improve soil fertility and plant health. Nowadays, farmers are using such fertilizers more frequently for compliance with organic certification and reducing environmental impacts. Increased government support in the form of subsidies and policies for promoting organic agriculture also drives up the market. The U.S. market is expected to continue growing with advancements in product formulations and increasing consumer awareness.
French Organic Dry Fertilizer Market
The French organic dry fertilizer market is growing as a result of the country's strong commitment to sustainable agriculture and environmental conservation. France is a leader in organic farming within Europe, and therefore, there is a high demand for organic dry fertilizers from natural sources such as compost, bone meal, and seaweed extracts. Government initiatives, like subsidies and encouraging eco-friendly farming methods under the European Union's Green Deal, contribute to the growth of the market. The rising demand for organic products and increasing regulatory environment to limit the usage of chemical fertilizers also support the demand. Organic dry fertilizer formulations are evolving continuously to support the growth of the market.
India Organic Dry Fertilizer Market
The India organic dry fertilizer market is growing rapidly, with the country's increasing trend towards organic farming and sustainable agricultural practices. The demand is being driven by increasing awareness among farmers about the long-term benefits of organic fertilizers, such as better soil health and less environmental impact. Government programs such as the Paramparagat Krishi Vikas Yojana (PKVY) and organic farming subsidies support this growth. The growing export of organic produce and increasing local health-conscious consumer demand enhances market adoption. The country's local materials, such as cow dung, compost, and neem-based fertilizers, are in preference, while technological developments boost the efficiency and availability of products.
Brazil Organic Dry Fertilizer Market
Brazil organic dry fertilizer market is growing steadily, fueled by the country's healthy agricultural sector and increased usage of sustainable farming practices. The demand for organic dry fertilizers derived from natural sources such as compost, bone meal, and rock phosphate is on the rise with Brazil being a leading exporter of organic produce like coffee, sugar, and soybeans. Government incentives for eco-friendly agriculture and international demand for certified organic products further boost market growth. The country's rich supply of organic raw materials, including animal manure and agricultural residues, reduces production costs and supports local manufacturing, thereby enhancing market accessibility and expansion.
Major Players
National Fertilizers, Madras Fertilizers, Seek Biotechnology Co. Ltd, Coromandel International, Nagarjuna Fertilizers and Chemicals Ltd, T Stanes & Company Limited, Novozymes, and Kribhco are major players in the global organic fertilizer market.
Market Segmentation
Sources
- Plant Based
- Animal Based
- Synthetic Based
Mode of application
- Seed Treatment
- Soil Treatment
- Root Dripping
Product Type
A. Microorganism
1. Azospirillum
2. Cyanobacteria
3. Phosphate-Solublizing Bacteria
4. Azolla
5. Aulosira
6. Rhizobium
7. Azotobacter
8. Others
B. Organic Residues
1. Farm Yard Manure
2. Crop Residue
3. Green Manure
4. Other Products
Crop Type
- Cereals & Grains
- Oilseeds & Pulses
- Fruits & Vegetables
- Others
Form
- Dry
- Liquid
Regional Market Insights
North America
- United States
- Canada
Europe
- France
- Germany
- Italy
- Spain
- United Kingdom
- Belgium
- Netherland
- Turkey
Asia Pacific
- China
- Japan
- India
- South Korea
- Thailand
- Malaysia
- Indonesia
- Australia
- New Zealand
Latin America
- Brazil
- Mexico
- Argentina
Middle East & Africa
- South Africa
- Saudi Arabia
- UAE
All the Key players have been covered
• Overview
• Recent Development
• Revenue Analysis
Company Analysis:
- National Fertilizers
- Madras Fertilizers
- Seek Biotechnology Co. Ltd,
- Coromandel International
- Nagarujuna fertilizers and Chemicals Ltd,
- T Stanes& Company Limited
- Novozymes
- Kribhco
Report Details:
| Report Features | Details |
| Base Year |
2024 |
| Historical Period |
2020 - 2024 |
| Forecast Period |
2025 - 2033 |
| Market |
US$ Billion |
| Segment Covered |
Source, Mode of Application, Product Type, Crop Type, Form, and Countries |
| Countries Covered |
|
| Companies Covered | 1. National Fertilizers 2. Madras Fertilizers 3. Seek Biotechnology Co. Ltd, 4. Coromandel International 5. Nagarujuna fertilizers and Chemicals Ltd, 6. T Stanes& Company Limited 7. Novozymes 8. Kribhco |
| Customization Scope |
20% Free Customization |
| Post-Sale Analyst Support |
1 Year (52 Weeks) |
| Delivery Format |
PDF and Excel through Email (We can also provide the editable version of the report in PPT/Word format on request) |
Customization Services available
- Analysis of Market Size and Its Segments
- More Company Profiles (Upto 10 without any additional cost):
- Additional Countries (Other than mentioned Countries):
- Region/Country Specific Reports:
- Market Entry Strategy:
- Region-Specific Market Dynamics:
- Regional Market Share Analysis:
- Trade Analysis:
- Production Insights:
- Others Customized Requests:
For more information contact our analysts.
Need More Assistance?
- Talk to our analysts to get more precious information on the current market trends.
- Include more countries and segments and customize the report based on the final requirement.
- Get a competitive advantage in your industry by knowing the report findings and making a positive impact on your revenues and operations.
- Our analysts are always ready to provide more help and pertinent information if you need any additional assistance.