India Fertilizers Market Size, Share, Trends & Forecast 2025–2033
Buy NowIndia Fertilizer Market Size and Forecast 2025-2033
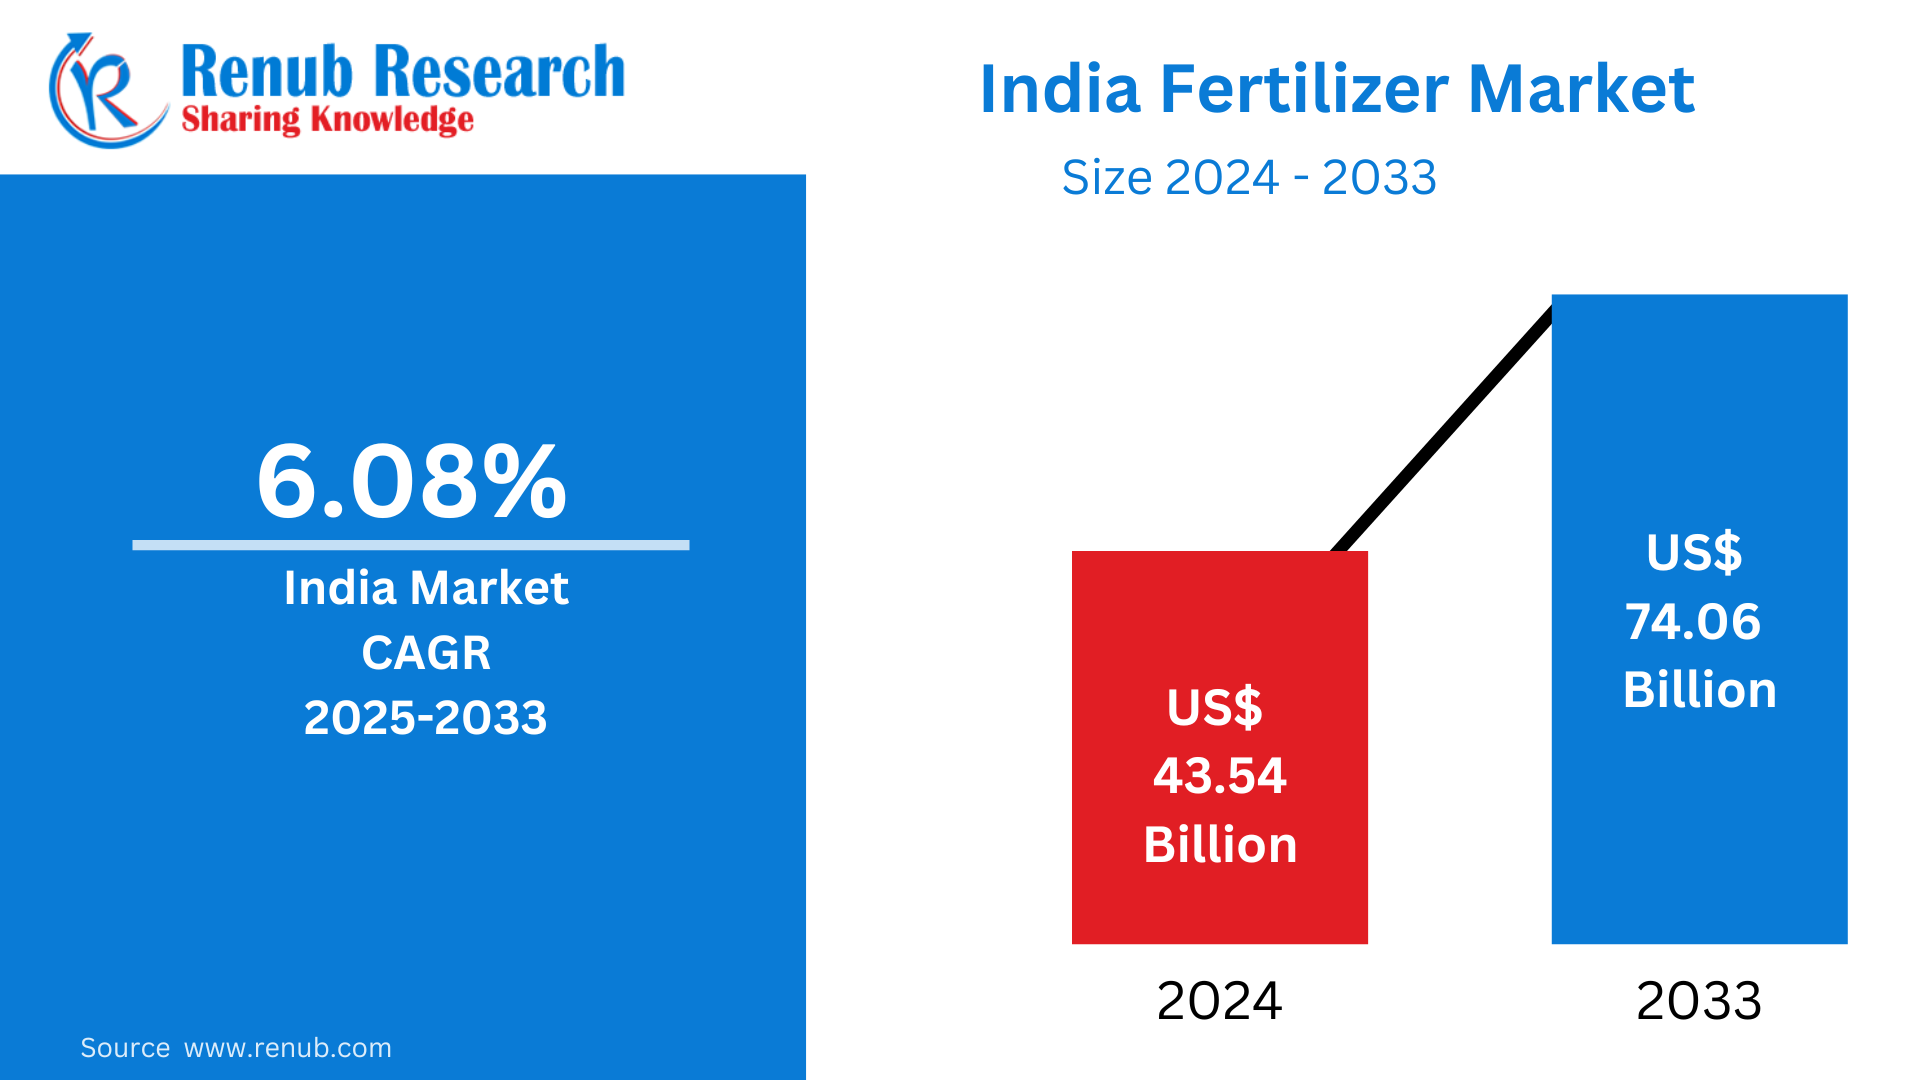
The fertilizer market in India is expected to grow from US$ 43.54 billion in 2024 to reach US$ 74.06 billion by 2033, with a CAGR of 6.08% during the period from 2025 to 2033. Increasing productivity in agriculture, subsidies provided by the government, and the increasing demand for wheat, rice, and vegetables are some of the reasons behind this growth. Another reason is the growing shift towards sustainable farming practices such as bio-fertilizers and balanced nutrient management.
Overview of the Indian Fertilizer Industry
Fertilizer is a chemical or natural substance added to soil to enhance fertility and promote plant growth. Fertilizers provide essential nutrients like nitrogen (N), phosphorus (P), and potassium (K), along with secondary and micronutrients that plants need for healthy development.
In India, fertilizers are considered important for improving agricultural productivity, especially in cultivating crops like rice, wheat, sugarcane, and vegetables. They increase crop yields, ensure better quality of produce, and correct deficiency diseases in the soil. Fertilizers are provided with heavy subsidies by the Government of India to help the farmers afford them without the burden of high price on food security and as support to the agrarian economy of the country. With fertilizers and innovative agriculture practices, the hunger of the growing population will be met. However, the attention to sustainable fertilizer use is on the increase to avoid soil degradation and environmental impacts.
Growth Driver in the India fertilizers market
Government Subsidies and Support
Government subsidies are the growth drivers in the Indian fertilizer market. The Indian Government offers subsidies on fertilizers such as urea, DAP, and NPK, which make them cheaper for farmers. This subsidy promotes the steady usage of fertilizers, and crop yields are enhanced while food security is guaranteed. In addition, the Government has initiated several programs of efficient fertilizer use, such as soil health management programs and nutrient-based subsidies. Such support is needed to enhance agricultural productivity particularly in key crops like rice and wheat, which, in turn, contributes to the overall market expansion. Under the NBS scheme, fertilizer companies set MRP based on market dynamics; the government monitors. Geopolitical issues have had a special package approved for DAP, where ₹3500/MT is given from 1st April 2024 to 31st December 2024 for the availability of the produce at reasonable prices for farmers. The "PM Programme for Restoration, Awareness Generation, Nourishment, and Amelioration of Mother-Earth (PM-PRANAM)" was launched in June 2023 with the motto of promoting sustainable fertilizer application and organic farming. States/UTs may get 50% of the subsidy saved by reducing chemical fertilizer consumption in comparison to the last three years as a grant.
Increased Agricultural Demand and Productivity
The rising demand for agriculture in India due to an increasing population and change in dietary habits enhances the demand for fertilizers. To meet the demand for food grains, fruits, and vegetables, farmers require an increase in productivity; therefore, fertilizers become a necessity. With changing cropping patterns and the need for high-yield varieties, fertilizers help increase crop output and maintain soil fertility. The demand for efficient farming practices, including the use of fertilizers, is increasing, particularly in regions like Punjab, Uttar Pradesh, and Maharashtra, where agricultural output is vital for national consumption and exports. India's population will reach 1.5 billion by the end of this decade and slowly go on to increase up until 2064 when it will peak at 1.7 billion. With India's population growing at such a rapid rate, there is a massive and growing demand for agricultural products to feed the larger population, making agriculture a very important sector for the food security of the country; this means that as more people live in India, the need for food produced through agriculture also rises considerably.
Growing Awareness of Sustainable Agriculture
The increasing focus on sustainable agriculture is another major driver for the Indian fertilizer market. As the awareness of environmental implications of chemical fertilizers grows, there is a shift towards bio-fertilizers and organic farming. Farmers are adopting eco-friendly practices to reduce soil degradation and improve long-term fertility. The government promotes balanced fertilization and encourages the use of organic and natural alternatives along with chemical fertilizers. This shift toward sustainable farming practices, along with the requirement of efficient nutrient management, is fueling the growth of the fertilizer market while keeping in mind the stewardship of the environment.
Issues in the Indian fertilizer market
Excessive use of Chemical Fertilizers
One of the key issues facing the Indian fertilizer market is the excessive use of chemical fertilizers, which creates soil degradation and long-term environmental damage. Excessive use of nitrogen, phosphorus, and potassium-based fertilizers results in soil imbalances, a decrease in organic matter, and the contamination of water resources.This reliance on chemical fertilizers further lowers the fertility of soil gradually, forcing farmers to increasingly rely on external inputs. India supports balanced fertilization and advocates the use of bio-fertilizers and organic fertilizers for restoration of health in the soil and the sustainable practices in agriculture.
Rising Fertilizer Prices and Availability Issues
Another significant challenge is the rising cost of fertilizers and periodic availability issues. Despite government subsidies, the prices of raw materials and fertilizers have been increasing, placing a financial burden on farmers, particularly small-scale ones. Also, distribution inefficiencies, especially in remote areas, disrupt the supply chain and delay fertilizer availability during peak farming seasons. These issues hinder timely application, affecting crop yields. While the Government has taken steps to ensure availability, rising global fertilizer prices and logistical challenges continue to disrupt the market, threatening food security and agricultural productivity.
Indian DAP Fertilizers Market
The Indian Di-Ammonium Phosphate (DAP) fertilizers market is a significant component of the Indian agricultural input sector. DAP is widely applied for its phosphorus content, which is crucial for root growth and maturity of crops. Large-scale demand is met by major producers and importers, primarily during the Rabi season. Government subsidies also make prices affordable for farmers. However, India relies heavily on imports due to limited domestic production, making the market vulnerable to global price fluctuations. Key states such as Punjab, Haryana, and Uttar Pradesh lead DAP consumption. With rising demand for balanced fertilization, the DAP market is expected to maintain steady growth.
Indian MOP Fertilizers Market
The Indian MOP fertilizers market for Muriate of Potash is major in providing support to potassium requirements for sugarcane, cotton, and fruits. MOP supports water retention capacity, disease resistance, and crop yield. Natural potash reserves are absent in India, rendering the market fully dependent on imports with major suppliers such as Canada and Belarus. Subsidies from the government assist in controlling end-user prices, but volatility in international supply chains is challenging. Southern and western regions like Maharashtra, Karnataka, and Tamil Nadu are the big consumers of MOP. The market is observing steady growth owing to rising awareness of nutrient-balanced agricultural practices in the country.
India Public Fertilizer Market
India's public fertilizer market plays a significant role in making fertilizers available and affordable for farmers. Government-owned companies like National Fertilizers Limited and Rashtriya Chemicals and Fertilizers (RCF) are major producers and distributors. These organizations play a significant role in the country's domestic production of urea and other subsidized fertilizers. Supported by government policy and funding, public sector firms provide consistent supply to rural regions. Nevertheless, issues like aging infrastructure and dependence on imports for raw materials can hinder production efficiency. Sustained modernization initiatives and policy changes are aiding in the overhauling of this segment.
India Private Fertilizer Market
The Indian private fertilizer market is dynamic and fast-growing, spurred by innovation, efficiency, and robust distribution networks. Industry leaders such as Coromandel International, Chambal Fertilisers, and Deepak Fertilisers control this segment. The private sector emphasizes diversified product portfolios such as specialty and organic fertilizers, micronutrients, and customized blends that suit regional soil requirements. With a focus on R&D, branding, and precision farming, private companies are becoming more attractive to commercially conscious and tech-savvy farmers. Yet, regulatory issues and subsidies dependence for some products present operational challenges. Nevertheless, the private sector is a main growth driver for India's fertilizer industry.
Indian Urea Fertilizers Market
Urea fertilizers are forecasted to remain the market and volume leader in India. This is because it is a major source of nitrogen supply and is essential to increase crop yield, in line with the country's predominantly nitrogen-poor soils. Government subsidies on urea make it cost-effective for farmers, expanding its sizeable usage. Also, the simplicity of application and standard compatibility with various plants contribute to its recognition. India's fertilizer market uses urea due to a focal point on food security and sustainable agriculture. It remains the most widely used and holds an adequate market and volume portion.
India Cooperative Fertilizer Market
The cooperative sector is likely to lead the Indian fertilizer market during the forecast period. Cooperatives may be crucial for the distribution of fertilizers to farmers, as it can utilize its vast network and direct outreach to the rural areas. With government help and subsidies, cooperatives offer fertilizers at discounted rates, which makes it easier for small and marginal farmers. Cooperative societies also frequently focus on farmers' welfare and offer extension services, which increases its reliability and credibility. The cooperative quarter is well positioned to retain a significant share of the Indian fertilizer market.
Uttar Pradesh Fertilizer Market
Uttar Pradesh is likely to be the fastest-growing state in the India fertilizers market. This is because of its vast agricultural land and large farming community. Uttar Pradesh has high fertilizer demand to support crop cultivation. The country authorities's awareness of farm development and tasks to better farmer welfare stimulates fertilizer input. In addition, continuing infrastructural improvements and the increased mechanization in farming practices propel the need for fertilizers. As Uttar Pradesh continues to focus on agricultural increase and modernization, its improvement is going to experience rapid growth in the fertilizers market compared with exclusive areas in India. In June 2024, the Uttar Pradesh government developed a fertilizer inventory of nearly 4.8 million tonnes, almost 84 percent of the state's 5.7 MT of aggregate demand during the kharif-sowing season.
Punjab Fertilizer Market
The Punjab fertilizer market is integral to supporting the state's agricultural economy, often referred to as India's "breadbasket." High demand in fertilizers such as urea, DAP, and NPK blends spur the growth of the fertilizer market, as farmers work to increase yields of wheat, rice, and vegetables. Subsidies of fertilizers by the government and programs for balanced application of nutrients spur the growth of the market. However, the hurdles include the overuse of chemical fertilizers, degradation of soil, and environmental issues. In recent years, there is a gradual shift towards sustainability in agriculture through increased use of bio-fertilizers and organic alternatives. Fertilizer market in Punjab still remains the same, giving importance to productivity and sustainability. Jul 2024, Punjab is the country's fertilizer consuming state in India, with an average consumption of about 223 kg per hectare; it far exceeds the national average of 90 kg per hectare.
Andhra Pradesh Fertilizer Market
Andhra Pradesh fertilizer market forms the backbone of the agro-based industry in this state, particularly in producing rice, maize, pulses, and fruits. Its demand for fertilizers is higher for urea, NPK, and DAP, ensuring improved yields and productivity of crops in this market. Government's subsidy and its encouragement on rational use of fertilizers add to the market further. Overuse of chemical fertilizers, salination of soil, and degradations in the environmental scenario are still the present issues. Rising awareness of organic fertilizers and bio-fertilizers is encouraging farmers to practice sustainable farming. With its strong agricultural base, Andhra Pradesh's fertilizer market is growing with productivity that is balanced with environmental considerations. August 2024: The Ministry of Agriculture and Farmers' Welfare has sanctioned and allocated 22.30 lakh metric tons of fertilizers to Andhra Pradesh for the Rabi 2024-25 crop season.
Key player
- Key Players Companies are faced with many techniques and tasks to remain aggressive and meet the changing needs of the agriculture sector. They are expanding their product services by offering a few fertilizers customized to various crop types and soil conditions. This includes the formulation of specialty fertilizers, micronutrient-enriched formulations, and natural/bio-fertilizers to meet the growing demand for sustainable and customized agricultural solutions.
- The major companies in the Indian fertilizer market are Nagarjuna Fertilizers and Chemicals Ltd, Chambal Fertilisers & Chemicals Ltd, Rashtriya Chemicals & Fertilizers Limited, National Fertilizers ltd, and Coromandel International Ltd.
- JULY 2024, The Government of India has made it mandatory to set standards for Nano Urea and Nano DAP under the Fertilizer Control Order, 1985. Six Nano Urea plants and four Nano DAP plants have been set up with capacities of 26.62 crores and 10.74 crores bottles per year, respectively. The Department of Fertilizers is encouraging National Fertilizers Limited (NFL) and Rashtriya Chemicals & Fertilizers Limited (RCF) to boost production of Nano Urea in the country.
- April 2023: IFFCO came out with the world's first Nano DAP Liquid Fertiliser, released by the Hon'ble Minister of Home Affairs & Cooperation in IFFCO Sadan, New Delhi. The move intends to enhance productivity and income levels of farmers while promoting the vision of Sahkar Se Samriddhi and Atmanirbhar Bharat of PM. The product launch was participated in by millions online, along with farmers as well as cooperative society members, both from India and overseas.
- December 2023, Tata group firm Rallis India Limited is upgrading agriculture with NAYAZINC™, a patented zinc fertilizer for application in soil. The product presents farmers with a cost-effective solution to Zinc Sulphate on a variety of crops and weather conditions.
- In September 2023 - Coromandel International launched an organic product called Cumist Calcium at Hotel Novotel in Vijayawada. The new product comprises specialty nutrients that enhance efficiency and soil health.
- In August 2023, the Chief Minister of Gujarat launched the IFFCO Nano Urea Spraying Scheme. The Chief Minister praised the farmers for being the first state to use drones for spraying nano urea and appealed to them to take proper advantage of this innovative scheme of drone technology in agriculture, saving them time and energy.
Types of Fertilizers Used in India
Fertilizers – India Fertilizer Market and Volume breakup in 4 viewpoints:
- Urea
- DAP
- MOP
- Complex Fertilizers
Sector – India Fertilizer Market breakup in 3 viewpoints:
- Public Sector
- Cooperative Sector
- Private Sector
State – India Fertilizer Market breakup in 20 viewpoints:
- Andhra Pradesh
- Bihar
- Chhattisgarh
- Gujarat
- Haryana
- Jammu and Kashmir
- Jharkhand
- Karnataka
- Kerala
- Madhya Pradesh
- Maharashtra
- Odisha
- Puducherry
- Punjab
- Rajasthan
- Tamil Nadu
- Telangana
- Uttar Pradesh
- Uttarakhand
- West Bengal
All the Key players have been covered from 3 Viewpoints:
• Overview
• Recent Development
• Revenue Analysis
Company Analysis:
- Nagarjuna Fertilizers and Chemicals Ltd.
- Chambal Fertilisers &Chemicals Ltd.
- Rashtriya Chemicals & Fertilizers Limited
- National Fertilizers Ltd.
- Coromandel International Ltd.
Report Details:
| Report Features | Details |
| Base Year |
2024 |
| Historical Period |
2020 - 2024 |
| Forecast Period |
2025 - 2033 |
| Market |
US$ Billion |
| Segment Covered |
Fertilizers, Sector, and State |
| State Covered | 1. Andhra Pradesh 2. Bihar 3. Chhattisgarh 4. Gujarat 5. Haryana 6. Jammu and Kashmir 7. Jharkhand 8. Karnataka 9. Kerala 10. Madhya Pradesh 11. Maharashtra 12. Odisha 13. Puducherry 14. Punjab 15. Rajasthan 16. Tamil Nadu 17. Telangana 18. Uttar Pradesh 19. Uttarakhand 20. West Bengal |
| Companies Covered | 1. Nagarjuna Fertilizers and Chemicals Ltd. 2. Chambal Fertilisers &Chemicals Ltd. 3. Rashtriya Chemicals & Fertilizers Limited 4. National Fertilizers Ltd. 5. Coromandel International Ltd. |
| Customization Scope |
20% Free Customization |
| Post-Sale Analyst Support |
1 Year (52 Weeks) |
| Delivery Format |
PDF and Excel through Email (We can also provide the editable version of the report in PPT/Word format on request) |
Key Questions Answered in This Report:
- What is the projected market size of the Indian fertilizer market by 2033?
- What is the expected CAGR of the Indian fertilizer market from 2025 to 2033?
- What are the key factors driving the growth of the Indian fertilizer market?
- How do government subsidies impact the fertilizer market in India?
- What initiatives has the Indian government taken to promote sustainable fertilizer use?
- How does increasing agricultural demand influence fertilizer consumption in India?
- What are the challenges faced by the Indian fertilizer market?
- Why is the excessive use of chemical fertilizers a concern for India?
- How do rising fertilizer prices affect Indian farmers?
- Which fertilizer type dominates the Indian market in terms of volume and usage?
Customization Services available
- Analysis of Market Size and Its Segments
- More Company Profiles (Upto 10 without any additional cost):
- Additional Countries (Other than mentioned Countries):
- Region/Country Specific Reports:
- Market Entry Strategy:
- Region-Specific Market Dynamics:
- Regional Market Share Analysis:
- Trade Analysis:
- Production Insights:
- Others Customized Requests:
For more information contact our analysts.
Need More Assistance?
- Talk to our analysts to get more precious information on the current market trends.
- Include more countries and segments and customize the report based on the final requirement.
- Get a competitive advantage in your industry by knowing the report findings and making a positive impact on your revenues and operations.
- Our analysts are always ready to provide more help and pertinent information if you need any additional assistance.