Global Fertilizer Market Report by Type (Nitrogen (Nitrates, Urea, UAN, Compound Fertilizer, and Others), Phosphorus, Potassium), Category (Organic, Inorganic), Forms (Dry, Liquid), Application (Agriculture, Horticulture, Gardening, Others), Crops (Grassland, Vegetables, Fruits/Treenuts, Roots/Tubers, Sugar Crops, Fibre Crops, Other Oil Crops, Oil Palm, Soybeans, Other Cereals, Maize, Rice, Wheat, Other), Countries and Company Analysis 2025-2033
Buy NowGlobal Fertilizer Market Size
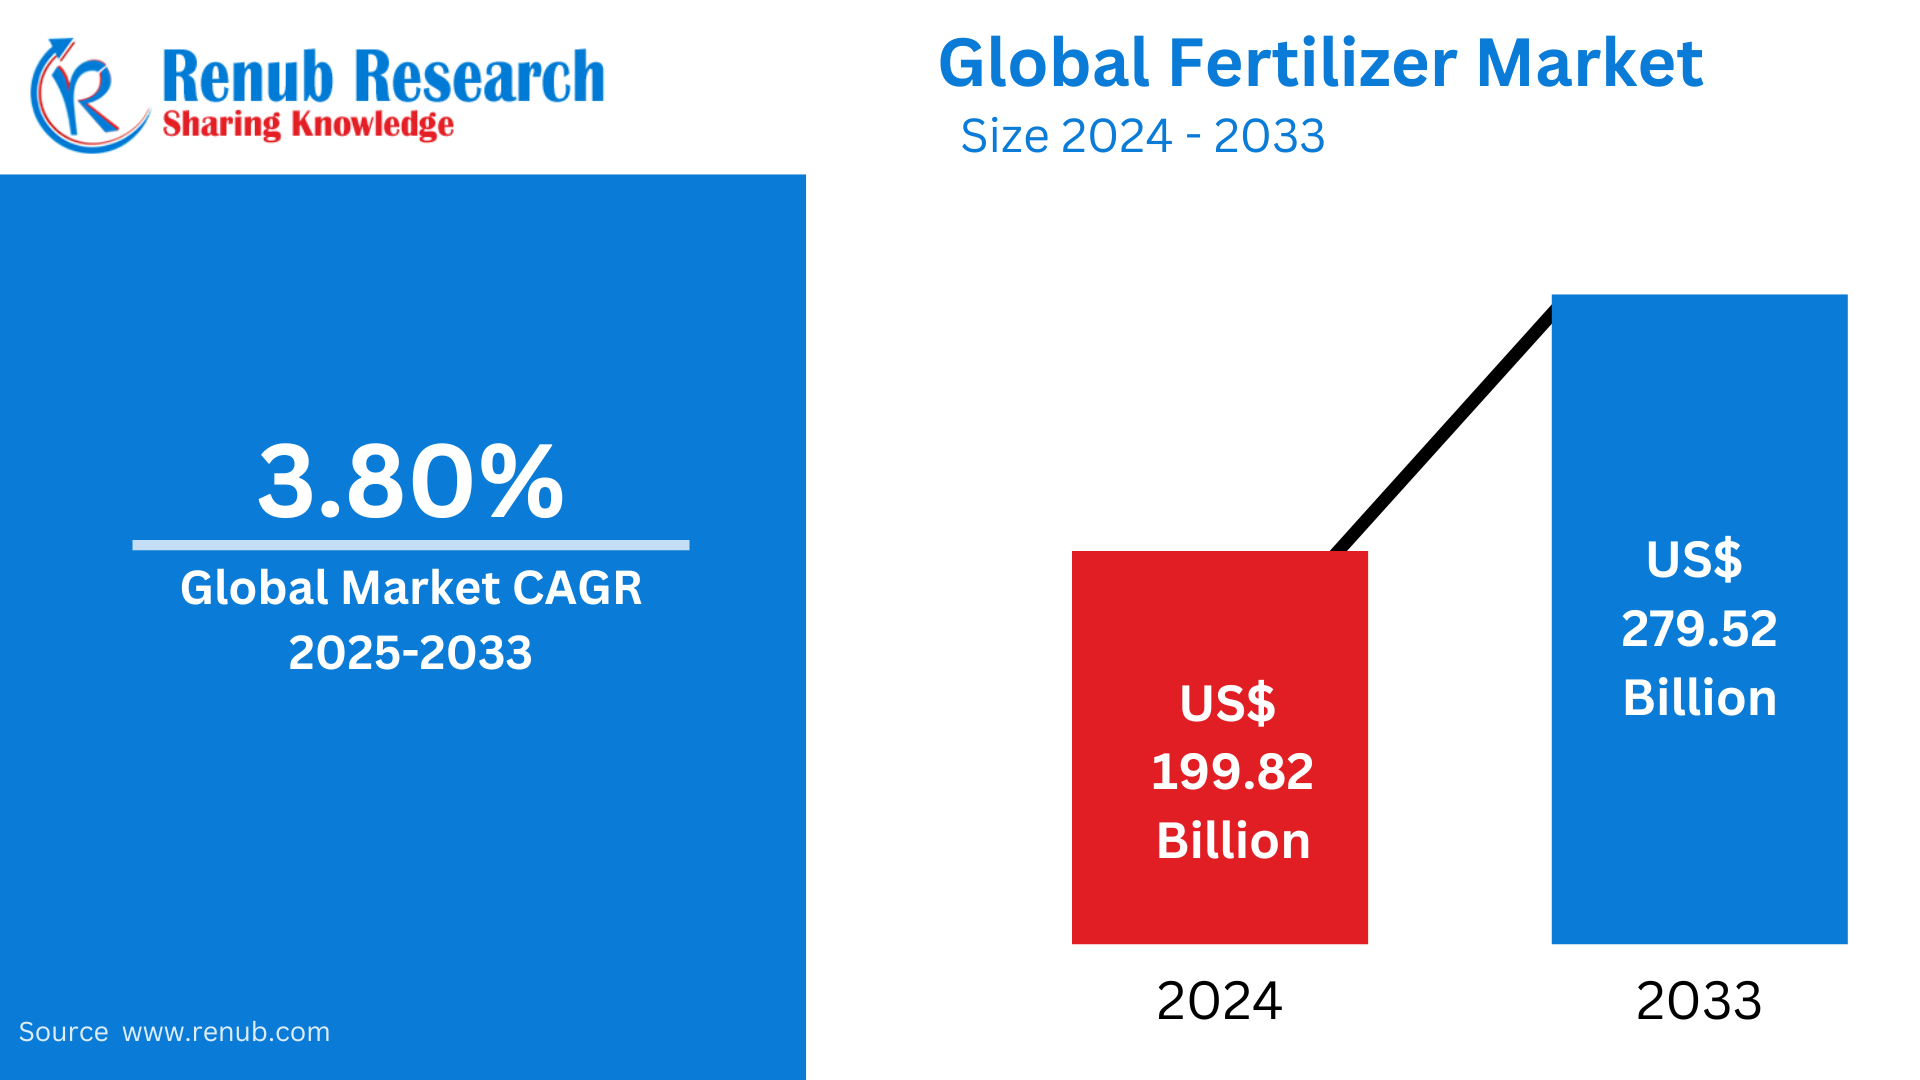
Fertilizer market is expected to reach US$ 279.52 billion by 2033 from US$ 199.82 billion in 2024, with a CAGR of 3.80% from 2025 to 2033. Some of the factors driving market demand include growing population growth, rising food demand, economic development in emerging markets, rising income levels, government policies and subsidies, increased R&D activity, and quick advances in agricultural technology. Due to the agriculture sector's explosive growth, Asia Pacific now holds the top spot in the fertilizer market.
Fertilizer Industry Overview
By providing the nutrients required for plant growth, fertilizers are chemicals that are applied to the soil or plant tissue to increase agricultural productivity. They could have an inorganic or organic origin. For example, nitrogen-based fertilizers contain nitrogen, the main component of chlorophyll, which aids in photosynthesis in plants. Phosphorous fertilizers benefit plant roots because they include phosphorous, which is found in protoplasm and stimulates cell growth and proliferation. Furthermore, pure fertilizers derived from animal manure, municipal sludge, industrial waste, or agricultural waste are known as organic fertilizers. These fertilizers enhance the soil's chemical and physical properties, promote the growth of microorganisms, and improve the soil's capacity to hold onto water.
Fertilizers are also substances that are introduced to soil or plant tissues in order to provide one or more of the nutrients required for plant growth. Higher crop yields are encouraged while preserving and enhancing the availability of soil nutrients. Farmers may now utilize fertilizers more safely and effectively while reducing their risk of exposure to dangerous chemicals thanks to the growing usage of organic fertilizers. Since fertilizer is essential for boosting crop yields by providing essential minerals like nitrogen, phosphate, potassium, and others that improve soil fertility, the market for fertilizer is growing rapidly.
The Haifa Group, for example, said in 2019 that it has expanded the production capacity of its Controlled Release Fertilizer (CRF) industry in France to 8,000 MTPA. With this technique, the company was able to increase its manufacturing capacity by up to 24,000 MTPA. In 2018, Yara International ASA paid USD 255 billion to acquire Brazil's Vale Cubatao Fertilizantes Complex. This tactic improved the company's market position and nitrogen production capabilities in the Brazilian fertilizer industry. Nonetheless, it is anticipated that the lack of awareness about the optimal use of fertilizers will limit market growth.
Growth Drivers for the Fertilizer Market
Economic growth and increasing incomes
Fertilizer use is directly impacted by economic growth and rising affluence in emerging nations. The level of living rises with economic growth, which causes dietary patterns to shift and the consumption of a wider variety of foods to rise. The demand for fertilizers used in feedstock agriculture is driven by this change in dietary patterns, such as increased meat consumption, which calls for greater amounts of animal feed. Additionally, when incomes rise, farmers may now invest in fertilizers and other modern agricultural techniques to increase crop yields and improve the quality of their produce. The worldwide fertilizer market is expanding as a result of the economic shift occurring in emerging markets.
Policies and subsidies of the government
The fertilizer market is greatly impacted by government regulations and subsidies. A lot of nations have agricultural policies in place to help and encourage farmers, which increases agricultural output. Fertilizer subsidies are one of these strategies, which lowers their cost and increases farmers' access to them. Governments also encourage the use of particular fertilizers in order to solve particular environmental issues or agricultural difficulties. On the other hand, modifications to government regulations, including the removal or reduction of fertilizer subsidies, may negatively affect demand and profitability in the fertilizer industry. On a regional and worldwide level, the interaction of government policies and subsidies can influence fertilizer production and use.
Growing populations and rising food requirements
The market for fertilizer has been significantly influenced by the world's population growth. The demand for food increases as the world's population grows. Farmers work to increase crop yields and agricultural productivity in order to meet the growing demand for food. In this situation, fertilizers are quite important since they give the soil vital nutrients that encourage healthy plant growth and increase yields. The agricultural industry must find ways to produce more food on a finite amount of arable land as the world's population continues to grow. In order to increase crop yield and guarantee food security, fertilizer demand is consequently still rising.
Challenges in the Fertilizer Market
Rising Raw Material Costs
An important obstacle facing the fertilizer sector is the rising cost of raw materials. The manufacture of fertilizer is mostly dependent on essential raw materials including potash, phosphate rock, and natural gas (for nitrogen fertilizers). Production costs may increase as a result of fluctuating prices for these resources, particularly when supply chain interruptions, trade restrictions, or geopolitical unrest occur. Conflicts in important exporting nations or shifts in governmental regulations, for instance, may restrict the supply of certain raw commodities, driving up prices. Furthermore, by requiring the use of cleaner, more effective technology, environmental restrictions intended to lower carbon emissions or save ecosystems may raise manufacturing costs. Fertilizers become increasingly costly for farmers, especially in emerging nations, as a result of these growing expenses being eventually passed on to consumers.
Environmental Concerns
The usage of fertilizers, particularly those containing nitrogen, is raising environmental concerns. Overuse of these fertilizers can result in a number of environmental problems, such as greenhouse gas emissions, water pollution, and soil degradation. Water bodies can become contaminated by nitrogen runoff, which can upset aquatic ecosystems and result in algal blooms. Furthermore, excessive fertilizer use leads to the emission of nitrous oxide, a strong greenhouse gas that intensifies climate change. The fertilizer business is under growing pressure to use more sustainable methods as awareness rises. This involves creating environmentally friendly substitutes with less of an impact on the environment, including organic or slow-release fertilizers. To lessen the environmental impact of fertilizer use, governments, farmers, and industry participants are promoting creative alternatives.
Nitrogen dominates the fertilizer market due to its role in crop growth
Nitrogen is a critical component of amino acids, proteins, and chlorophyll, crucial for photosynthesis. This nutrient is vital for the synthesis of enzymes and nucleic acids, contributing immediately to plant structure and function. Its considerable utility effects in surged crop yields, making it an essential detail for agricultural productiveness. Also, nitrogen fertilizers, together with urea and ammonium nitrate, provide cost-effectiveness and performance in promoting speedy plant increase. The exceptional importance of nitrogen in fostering sturdy crop growth solidifies its function with the very best share in the international fertilizer market.
Dry form dominates the fertilizer market due to storage and transportation advantages
Dry fertilizers, consisting of granules, powders, or prills, have an extended shelf life, reducing the hazard of nutrient loss. Their lower moisture content material minimizes clumping and caking, making sure simpler managing and application by farmers. The dry form additionally enables efficient bulk transportation, decreasing logistical expenses. These elements contribute to the high choice for dry fertilizers, imparting convenience, cost-effectiveness, and logistical performance, thereby securing the bulk proportion in the worldwide fertilizer market.
Agriculture dominates the fertilizer market, driving crop growth and productivity
Fertilizers offer crucial nutrients like nitrogen, phosphorus, and potassium, addressing soil deficiencies and enhancing plant improvement. As the global populace expands, the demand for food surges, intensifying the reliance on fertilizers to maximize agricultural output. Fertilizers allow farmers to satisfy the escalating demand for diverse crops, starting from grains to fruits and vegetables. The symbiotic relationship among agriculture and fertilizers positions the agricultural zone as a dominant force in the global fertilizer market, critical for sustaining food security and meeting the needs of a developing population.
Vegetables are rising in the world market for fertilizers
Increasing international focus of healthy diets has accelerated the demand for nutrient-rich veggies, prompting farmers to put money into fertilizers to enhance yield and quality. As nutritional choices shift toward a better intake of vegetables, there is a growing want for efficient fertilization to assist intensive cultivation. Fertilizers play a crucial position in optimizing soil fertility and making sure that veggies obtain the important nutrients they require. The increasing market for vegetables pushed by health-aware clients, positions fertilizers as indispensable contributors to sustainable and effective vegetable cultivation on a worldwide scale.
United States Fertilizer Market
Because of its vast agricultural sector, the United States has one of the biggest fertilizer markets in the world. Enhancing crop yields and preserving soil health require fertilizers, especially nitrogen, phosphate, and potash. Crop demand, meteorological conditions, and worldwide fertilizer costs are some of the elements that affect the market. The market is dominated by nitrogen fertilizers, which are extensively utilized for corn and other crops. The demand for organic and bio-based fertilizers is also being driven by a greater emphasis on sustainable farming methods. Precision farming methods and controlled-release fertilizers are becoming more popular due to environmental concerns, such as the effect of fertilizer runoff on water quality and greenhouse gas emissions. However, the industry faces difficulties due to supply chain interruptions and growing raw material costs.
Between 2020 and 2022, the population of the United States grew from 335.9 million to 338.2 million. The overall amount of agriculture fell by nearly 50 million acres from 2000 to 2022, when it stood at 893.4 million acres. The necessity for agri-inputs to boost agricultural output is shown by the scarcity of cropland. For a very long time, fertilizers have been used to boost agricultural productivity. In 2022, corn, cotton, soybeans, and wheat will make up over 65.7% of the principal agricultural acreage in the United States, making them the four main crops.
Germany Fertilizer Market
Because of its vast agricultural sector, the United States has one of the biggest fertilizer markets in the world. Enhancing crop yields and preserving soil health require fertilizers, especially nitrogen, phosphate, and potash. Crop demand, meteorological conditions, and worldwide fertilizer costs are some of the elements that affect the market. The market is dominated by nitrogen fertilizers, which are extensively utilized for corn and other crops. The demand for organic and bio-based fertilizers is also being driven by a greater emphasis on sustainable farming methods. Precision farming methods and controlled-release fertilizers are becoming more popular due to environmental concerns, such as the effect of fertilizer runoff on water quality and greenhouse gas emissions. However, the industry faces difficulties due to supply chain interruptions and growing raw material costs.
India Fertilizer Market
India's extensive agricultural sector, which contributes significantly to the country's GDP, makes it one of the world's major markets for fertilizer. The market is dominated by fertilizers based on nitrogen, which help produce staple crops including maize, wheat, and rice. Fertilizers are widely subsidized by the government to make them affordable for farmers and more widely available, particularly in rural areas. But over use of chemical fertilizers has deteriorated soil quality, polluted the ecosystem, and raised questions about sustainability in the long run. As a result, demand for controlled-release solutions and fertilizers based on organic and bio-based materials is rising. Furthermore, the market is progressively changing toward more ecologically friendly alternatives due to government programs encouraging sustainable practices and technology developments in precision farming.
In January 2023, ICL and General Mills have signed a strategic collaboration agreement whereby ICL would supply General Mills with strategic specialty phosphate solutions. International expansion will also be a key component of the long-term deal.
United Arab Emirates Fertilizer Market
The UAE's agricultural demands and increased emphasis on food security are driving the country's relatively small but expanding fertilizer sector. To maintain its meager domestic agricultural activity, the nation imports a sizable amount of its fertilizers, especially those based on nitrogen. The UAE depends on sophisticated farming methods like hydroponics and controlled-environment agriculture, which call for specific fertilizers, due to its severe desert climate and scarcity of fertile land. In an effort to increase domestic agricultural production and lessen reliance on imports, the government has been encouraging sustainable farming methods. As part of initiatives to guarantee sustainable agriculture, there is a growing trend toward organic and eco-friendly fertilizers. Further market expansion is anticipated as a result of rising investments in agricultural innovation and the UAE's increased emphasis on food security and self-sufficiency.
Type – Market breakup from 3 viewpoints:
1. Nitrogen (Nitrates, Urea, UAN, Compound Fertilizer, and Others)
2. Phosphorus
3. Potassium
Category – Market breakup from 2 viewpoints:
1. Organic
2. Inorganic
Forms – Market breakup from 2 viewpoints:
1. Dry
2. Liquid
Application – Market breakup from 4 viewpoints:
1. Agriculture
2. Horticulture
3. Gardening
4. Others
Crops – Market breakup from 14 viewpoints:
1. Grassland
2. Vegetables
3. Fruits/Treenuts
4. Roots/Tubers
5. Sugar Crops
6. Fibre Crops
7. Other Oil Crops
8. Oil Palm
9. Soybeans
10. Other Cereals
11. Maize
12. Rice
13. Wheat
14. Other
Countries – Market breakup of 19 Countries Covered in the Report:
1. North America
1.1 United States
1.2 Canada
2. Europe
2.1 Russia
2.2 Ukraine
2.3 Germany
2.4 Italy
2.5 United Kingdom
2.6 Turkey
3. Asia Pacific
3.1 China
3.2 India
3.3 Pakistan
3.4 Bangladesh
3.5 Indonesia
3.6 Vietnam
3.7 Australia
4. Latin America
4.1 Brazil
4.2 Argentina
4.3 Mexico
5. Rest of World
All companies have been covered from 3 viewpoints:
• Overview
• Recent Development
• Revenue
Company Analysis:
1. Yara International ASA
2. K+S AG
3. CF Industries Holdings
4. GrupaAzoty S.A
5. ICL Group
6. OCI NV
7. Sociedad Quimica y Minera de Chile SA
8. BASF SE
9. PhosAgro
Report Details:
| Report Features | Details |
| Base Year |
2024 |
| Historical Period |
2020 - 2024 |
| Forecast Period |
2025 - 2033 |
| Market |
US$ Billion |
| Segment Covered |
Type, Form, Application, Crop, and Countries |
| Countries Covered |
|
| Companies Covered |
|
| Customization Scope |
20% Free Customization |
| Post-Sale Analyst Support |
1 Year (52 Weeks) |
| Delivery Format |
PDF and Excel through Email (We can also provide the editable version of the report in PPT/Word format on request) |
Key Questions Answered in the Report
-
What is the current size and expected growth rate of the global fertilizer market?
-
Which types of fertilizers (nitrogen, phosphate, potash, etc.) dominate the global market?
-
What are the main drivers fueling the growth of the fertilizer market globally?
-
Which challenges and restraints are hindering the growth of the fertilizer industry?
-
How are sustainable and organic fertilizers influencing market dynamics?
-
Which regions are the largest consumers of fertilizers, and why?
-
What role does government policy and regulation play in the fertilizer market?
-
Who are the major players in the global fertilizer industry and what are their strategies?
-
What technological innovations are emerging in fertilizer production and application?
-
How is climate change and soil degradation impacting fertilizer demand and usage?
Customization Services available
- Analysis of Market Size and Its Segments
- More Company Profiles (Upto 10 without any additional cost):
- Additional Countries (Other than mentioned Countries):
- Region/Country Specific Reports:
- Market Entry Strategy:
- Region-Specific Market Dynamics:
- Regional Market Share Analysis:
- Trade Analysis:
- Production Insights:
- Others Customized Requests:
For more information contact our analysts.
Need More Assistance?
- Talk to our analysts to get more precious information on the current market trends.
- Include more countries and segments and customize the report based on the final requirement.
- Get a competitive advantage in your industry by knowing the report findings and making a positive impact on your revenues and operations.
- Our analysts are always ready to provide more help and pertinent information if you need any additional assistance.