1. Introduction
2. Research & Methodology
3. Executive Summary
4. Market Dynamics
4.1 Growth Drivers
4.2 Key Challenges
5. United States Used Car Policy
6. United States Used Car Market
7. United States Used Car Units
8. Market Share – United States Used Car
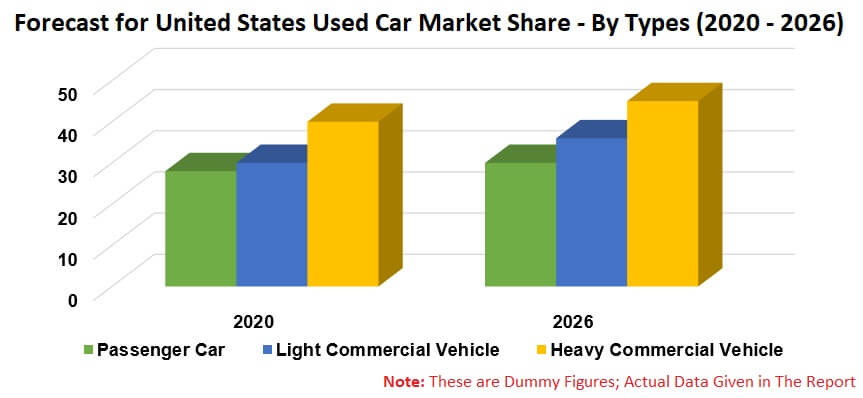
8.1 By Types
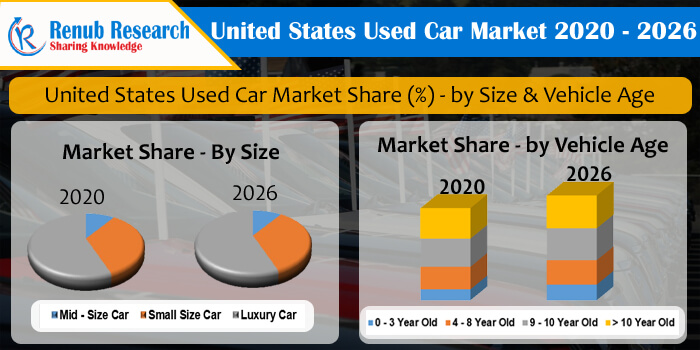
8.2 By Size
8.3 By Vehicle Age
8.4 By Distribution channels
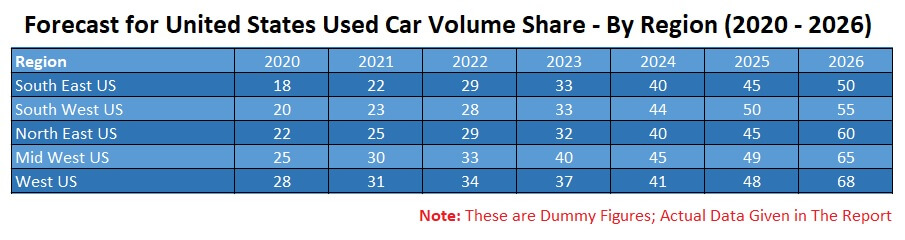
8.5 By Region
9. Type – United States Used Car Market
9.1 Passenger Car
9.2 Light Commercial Vehicle
9.3 Heavy Commercial Vehicle
10. Size – United States Used Car Market and Volume
10.1 Mid - Size Car
10.1.1 Market
10.1.2 Volume
10.2 Small Size Car
10.2.1 Market
10.2.2 Volume
10.3 Luxury Car
10.3.1 Market
10.3.2 Volume
11. Vehicle Age – United States Used Car Market
11.1 0- 3 Year old
11.2 4 - 8 Year old
11.3 9-10 Year old
11.4 > 10 year old
12. Distribution Channels – United States Used Car Market
12.1 Franchised
12.1.1 Market
12.1.2 Volume
12.2 Independent Car Dealers
12.2.1 Market
12.2.2 Volume
12.3 Others
12.3.1 Market
12.3.2 Volume
13. Region – United States Used Car Market
13.1 South East US
13.1.1 Market
13.1.2 Volume
13.2 South West US
13.2.1 Market
13.2.2 Volume
13.3 North East US
13.3.1 Market
13.3.2 Volume
13.4 Mid West US
13.4.1 Market
13.4.2 Volume
13.5 West US
13.5.1 Market
13.5.2 Volume
14. Merger & Acquisitions
15. Company Analysis
15.1 Penske Automotive Group Inc.
15.1.1 Overview
15.1.2 Recent Development & Strategy
15.1.3 Revenue Analysis
15.2 CarMax Inc.
15.2.1 Overview
15.2.2 Recent Development & Strategy
15.2.3 Revenue Analysis
15.3 Asbury Automotive Group Inc.
15.3.1 Overview
15.3.2 Recent Development & Strategy
15.3.3 Revenue Analysis
15.4 AutoNation Inc.
15.4.1 Overview
15.4.2 Recent Development & Strategy
15.4.3 Revenue Analysis
15.5 Amazon.com Inc.
15.5.1 Overview
15.5.2 Recent Development & Strategy
15.5.3 Revenue Analysis
15.6 EBay Inc.
15.6.1 Overview
15.6.2 Recent Development & Strategy
15.6.3 Revenue Analysis
15.7 Alibaba Group Holding Ltd.
15.7.1 Overview
15.7.2 Recent Development & Strategy
15.7.3 Revenue Analysis
List of Figures:
Figure-01: United States – Used Car Market (Billion US$), 2019 – 2026
Figure-02: United States – Used Car Sales Volume (Million Units), 2019 – 2026
Figure-03: United States – Car Market (Billion US$), 2015 – 2019
Figure-04: United States – Forecast for Used Car Market (Billion US$), 2020 – 2026
Figure-05: United States – Used Car Volume (Million of Units), 2015 – 2019
Figure-06: United States – Forecast for Used Car Volume (Million of Units), 2020 – 2026
Figure-07: United States – Used Car Market Share Analysis by Types (Percent), 2015 – 2019
Figure-08: United States – Forecast for Used Car Market Share Analysis by Types (Percent), 2020 – 2026
Figure-09: United States – Used Car Market Share Analysis by Size (Percent), 2015 – 2019
Figure-10: United States – Forecast for Used Car Market Share Analysis by Size (Percent), 2020 – 2026
Figure-11: United States – Used Car Market Share Analysis by Car Age (Percent), 2015 – 2019
Figure-12: United States – Forecast for Used Car Market Share Analysis by Car Age (Percent), 2020 – 2026
Figure-13: United States – Used Car Market Share Analysis by Distribution Channel (Percent), 2015 – 2019
Figure-14: United States – Forecast for Used Car Market Share Analysis by Distribution Channel (Percent), 2020 – 2026
Figure-15: United States – Used Car Market Share Analysis by Region (Percent), 2015 – 2019
Figure-16: United States – Forecast for Used Car Market Share Analysis by Region (Percent), 2020 – 2026
Figure-17: United States – Used Passenger Car Market (Billion US$), 2015 – 2019
Figure-18: United States – Forecast for Used Passenger Car Market (Billion US$), 2020 – 2026
Figure-19: United States – Used Light Commercial Vehicle Market (Billion US$), 2015 – 2019
Figure-20: United States – Forecast for Used Light Commercial Vehicle Market (Billion US$), 2020 – 2026
Figure-21: United States – Used Heavy Commercial Vehicle Market (Billion US$), 2015 – 2019
Figure-22: United States – Forecast for Used Heavy Commercial Vehicle Market (Billion US$), 2020 – 2026
Figure-23: United States – Used Mid - Size Car Market (Billion US$), 2015 – 2019
Figure-24: United States – Forecast for Used Mid - Size Car Market (Billion US$), 2020 – 2026
Figure-25: United States – Used Mid - Size Car Volume (Million Units), 2015 – 2019
Figure-26: United States – Forecast for Used Mid - Size Car Volume (Million Units), 2020 – 2026
Figure-27: United States – Used Small Size Car Market (Billion US$), 2015 – 2019
Figure-28: United States – Forecast for Used Small Size Car Market (Billion US$), 2020 – 2026
Figure-29: United States – Used Small Size Car Volume (Million Units), 2015 – 2019
Figure-30: United States – Forecast for Used Small Size Car Volume (Million Units), 2020 – 2026
Figure-31: United States – Used Luxury Car Market (Billion US$), 2015 – 2019
Figure-32: United States – Forecast for Used Luxury Car Market (Billion US$), 2020 – 2026
Figure-33: United States – Used Luxury Car Volume (Million Units), 2015 – 2019
Figure-34: United States – Forecast for Used Luxury Car Volume (Million Units), 2020 – 2026
Figure-35: United States – Used 0- 3 Year Old Car Market (Billion US$), 2015 – 2019
Figure-36: United States – Forecast for Used 0- 3 Year Old Car Market (Billion US$), 2020 – 2026
Figure-37: United States – Used 4 - 8 Year Old Car Market (Billion US$), 2015 – 2019
Figure-38: United States – Forecast for Used 4 - 8 Year Old Car Market (Billion US$), 2020 – 2026
Figure-39: United States – Used 9 - 10 Year Old Car Market (Billion US$), 2015 – 2019
Figure-40: United States – Forecast for Used 9 - 10 Year Old Car Market (Billion US$), 2020 – 2026
Figure-41: United States – Used > 10 year Old Car Market (Billion US$), 2015 – 2019
Figure-42: United States – Forecast for Used > 10 year Old Car Market (Billion US$), 2020 – 2026
Figure-43: United States – Used Car Market by Franchised Distribution (Billion US$), 2015 – 2019
Figure-44: United States – Forecast for Used Car Market by Franchised Distribution (Billion US$), 2020 – 2026
Figure-45: United States – Used Car Volume by Franchised Distribution (Million Units), 2015 – 2019
Figure-46: United States – Forecast for Used Car Volume by Franchised Distribution (Million Units), 2020 – 2026
Figure-47: United States – Used Car Market by Independent Car Dealers (Billion US$), 2015 – 2019
Figure-48: United States – Forecast for Used Car Market by Independent Car Dealers (Billion US$), 2020 – 2026
Figure-49: United States – Used Car Volume by Independent Car Dealers (Million Units), 2015 – 2019
Figure-50: United States – Forecast for Used Car Volume by Independent Car Dealers (Million Units), 2020 – 2026
Figure-51: United States – Used Car Market by Others Distribution (Billion US$), 2015 – 2019
Figure-52: United States – Forecast for Used Car Market by Others Distribution (Billion US$), 2020 – 2026
Figure-53: United States – Used Car Volume by Others Distribution (Million Units), 2015 – 2019
Figure-54: United States – Forecast for Used Car Volume by Others Distribution (Million Units), 2020 – 2026
Figure-55: South East US – Used Car Market (Billion US$), 2015 – 2019
Figure-56: South East US – Forecast for Used Car Market (Billion US$), 2020 – 2026
Figure-57: South East US – Used Car Volume (Million Units), 2015 – 2019
Figure-58: South East US – Forecast for Used Car Volume (Million Units), 2020 – 2026
Figure-59: South West US – Used Car Market (Billion US$), 2015 – 2019
Figure-60: South West US – Forecast for Used Car Market (Billion US$), 2020 – 2026
Figure-61: South West US – Used Car Volume (Million Units), 2015 – 2019
Figure-62: South West US – Forecast for Used Car Volume (Million Units), 2020 – 2026
Figure-63: North East US – Used Car Market (Billion US$), 2015 – 2019
Figure-64: North East US – Forecast for Used Car Market (Billion US$), 2020 – 2026
Figure-65: North East US – Used Car Volume (Million Units), 2015 – 2019
Figure-66: North East US – Forecast for Used Car Volume (Million Units), 2020 – 2026
Figure-67: Mid West US – Used Car Market (Billion US$), 2015 – 2019
Figure-68: Mid West US – Forecast for Used Car Market (Billion US$), 2020 – 2026
Figure-69: Mid West US – Used Car Volume (Million Units), 2015 – 2019
Figure-70: Mid West US – Forecast for Used Car Volume (Million Units), 2020 – 2026
Figure-71: West US – Used Car Market (Billion US$), 2015 – 2019
Figure-72: West US – Forecast for Used Car Market (Billion US$), 2020 – 2026
Figure-73: West US – Used Car Volume (Million Units), 2015 – 2019
Figure-74: West US – Forecast for Used Car Volume (Million Units), 2020 – 2026
Figure-75: Global Penske Automotive Group Inc. Revenue (In Billion US$) 2015 – 2019
Figure-76: Forecast for Global Penske Automotive Group Inc. Revenue (In Billion US$) 2020 – 2026
Figure-77: Global CarMax Inc. Revenue (In Billion US$) 2015 – 2019
Figure-78: Forecast for Global CarMax Inc. Revenue (In Billion US$) 2020 – 2026
Figure-79: Global Asbury Automotive Group Inc. Revenue (In Billion US$) 2015 – 2019
Figure-80: Forecast for Global Asbury Automotive Group Inc. Revenue (In Billion US$) 2020 – 2026
Figure-81: Global AutoNation Inc. Revenue (In Billion US$) 2015 – 2019
Figure-82: Forecast for Global AutoNation Inc. Revenue (In Billion US$) 2020 – 2026
Figure-83: Global Amazon Revenue (In Billion US$) 2015 – 2019
Figure-84: Forecast for Global Amazon Revenue (In Billion US$) 2020 – 2026
Figure-85: Global Ebay Revenue (In Billion US$) 2015 – 2019
Figure-86: Forecast for Global Ebay Revenue (In Billion US$) 2020 – 2026
Figure-87: Global Alibaba Revenue (In Billion US$) 2015 – 2019
Figure-88: Forecast for Global Alibaba Revenue (In Billion US$) 2020 – 2026
List of Tables:
Table-01: Luxury Car Markers and their Brands
Table-02: South East US Car Sales Position
Table-03: Automotive Deal, Merger & Acquisitions in Year 2020
Table-04: Recent Acquisition by Amazon