1. Introduction
2. Research & Methodology
3. Executive Summary
4. Market Dynamics
4.1 Growth Drivers
4.1.1 Rise of the Used-Car Dealer
4.1.2 Purchasing Pattern is Changing
4.2 Challenges
4.2.1 Lack of Integrity
4.2.2 Lack of Used Car Evaluation Criteria
4.2.3 Lack of After-Sell Service Systems
4.2.4 Incomplete Policies and Regulations
5. China Used Vehicle Market
6. China Used Vehicle Units
7. Volume Share – China Used Car
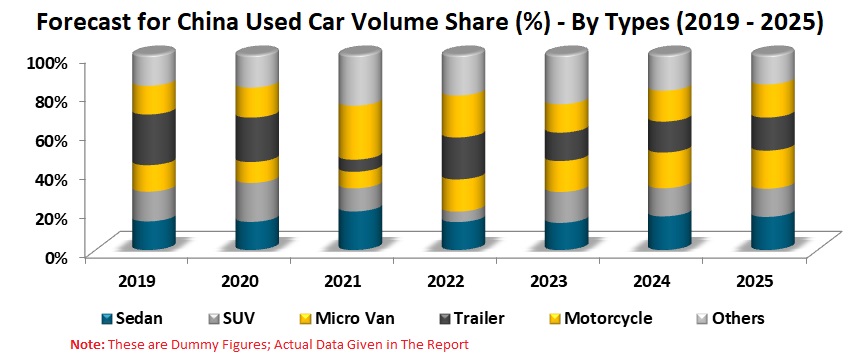
7.1 By Types
7.2 By Vehicle Age
7.3 By Distribution Channels
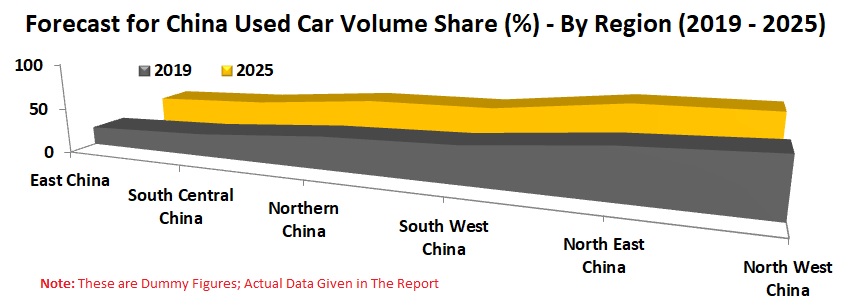
7.4 By Region
7.5 By Pricing Analysis
8. Type – China Used Vehicle Volume
8.1 Sedan
8.2 SUV
8.3 Micro Van
8.4 Trailer
8.5 Motorcycle
8.6 Others
9. Vehicle Age – China Used Vehicle Market & Volume
9.1 <3 Years
9.1.1 Volume
9.1.2 Market
9.2 3 - 10 Years
9.2.1 Volume
9.2.2 Market
9.3 >10 Years)
9.3.1 Volume
9.3.2 Market
10. Distribution Channels – China Used Vehicle Market & Volume
10.1 Organized Dealers / Large Vehicle Market
10.1.1 Volume
10.1.2 Market
10.2 Online
10.2.1 Volume
10.2.2 Market
10.3 Unorganized / Independent Dealers
10.3.1 Volume
10.3.2 Market
11. By Region - China Used Vehicle Market & Volume
11.1 East China
11.1.1 Volume
11.1.2 Market
11.2 South Central China
11.2.1 Volume
11.2.2 Market
11.3 Northern China
11.3.1 Volume
11.3.2 Market
11.4 South West China
11.4.1 Volume
11.4.2 Market
11.5 North East China
11.5.1 Volume
11.5.2 Market
11.6 North West China
11.6.1 Volume
11.6.2 Market
12. Pricing Analysis – China Used Vehicle Volume
12.1 Less than USD 4500
12.2 Between USD 4500 - 7500
12.3 Between USD 7501 - 12000
12.4 More than USD 12000
13. Merger & Acquisitions
14. Companies Covered
14.1 Guazi in Units
14.1.1 Recent Development or Strategy
14.1.2 Sales
14.2 Uxin Group in Units (2C and 2B business Segment)
14.2.1 Recent Development or Strategy
14.2.2 Sales
14.3 Renrenche in Units
14.3.1 Recent Development or Strategy
14.3.2 Sales
14.4 Souche in Units
14.4.1 Recent Development or Strategy
14.4.2 Sales
14.5 CAR Inc
14.5.1 Recent Development or Strategy
14.5.2 Sales
List of Figures:
Figure-01: China - Used Care Market (In USD Million), 2015 – 2018
Figure-02: China - Forecast for Used Care Market (In USD Million), 2019 – 2025
Figure-03: China - Used Vehicle Volume (Million Units), 2015 – 2018
Figure-04: China - Forecast for Used Vehicle Volume (Million Units), 2019 – 2025
Figure-05: China - Used Vehicle Volume Share by Age (Percent), 2015 – 2018
Figure-06: China - Forecast for Used Vehicle Volume Share by Age (Percent), 2019 – 2025
Figure-07: China - Used Vehicle Volume Share by Distribution Channels (Percent), 2015 – 2018
Figure-08: China - Forecast for Used Vehicle Volume Share by Distribution Channels (Percent), 2019 – 2025
Figure-09: China - Used Vehicle Volume Share by Pricing (Percent), 2015 – 2018
Figure-10: China - Forecast for Used Vehicle Volume Share by Pricing (Percent), 2019 – 2025
Figure-11: China - Sedan Used Car Volume (Million Units), 2015 – 2018
Figure-12: China - Forecast for Sedan Used Car Volume (Million Units ), 2019 – 2025
Figure-13: China - SUV Used Car Volume (Million Units), 2015 – 2018
Figure-14: China – Forecast for SUV Used Car Volume ( Million Units), 2019 – 2025
Figure-15: China - Used Micro Van Volume (Million Units), 2015 – 2018
Figure-16: China – Forecast for Used Micro Van Volume (Million US$), 2019 – 2025
Figure-17: China - Used Trailer Volume (Million Units), 2015 – 2018
Figure-18: China - Forecast for Used Trailer Volume (Million Units), 2019 – 2025
Figure-19: China - Used Motorcycle Volume (Million Units), 2015 – 2018
Figure-20: China - Forecast for Used Motorcycle Volume (Million Units), 2019 – 2025
Figure-21: China - Others Used Vehicle Volume (Million Units), 2015 – 2018
Figure-22: China - Forecast for Others Used Vehicle Volume (Million Units), 2019 – 2025
Figure-23: China - Used Vehicle <3 Years Volume (Million units), 2015 – 2018
Figure-24: China – Forecast for Used Vehicle <3 Years Volume (Million units), 2019 – 2025
Figure-25: China – Forecast for Used Vehicle <3 Years Volume (Million units), 2019 – 2025
Figure-26: China - Used Vehicle <3 Years Market (In USD Million), 2015 – 2018
Figure-27: China – Forecast for Used Vehicle <3 Years Market (In USD Million), 2019 – 2025
Figure-28: China - Used Vehicle 3-10 Years Volume (Million Units), 2015 - 2018
Figure-29: China – Forecast for Used Vehicle 3-10 Years Volume (Million Units), 2019 – 2025
Figure-30: China - Used Vehicle 3-10 Years Market (In USD Million), 2015 - 2018
Figure-31: China – Forecast for Used Vehicle 3-10 Years Market (In USD Million), 2019 – 2025
Figure-32: China - Used Vehicle > 10 years Volume (Million Units), 2015 – 2018
Figure-33: China – Forecast for Used Vehicle > 10 years Volume (Million Units), 2019 – 2025
Figure-34: China - Used Vehicle > 10 years Market (In USD Million), 2015 – 2018
Figure-35: China – Forecast for Used Vehicle > 10 years Market (In USD Million), 2019 – 2025
Figure-36: China - Organized Dealers/Large Vehicle Volume (Million Units), 2015 – 2018
Figure-37: China – Forecast for Organized Dealers/Large Vehicle Volume (Million Units), 2019 – 2025
Figure-38: China - Organized Dealers/Large Vehicle Market (In USD Million), 2015 – 2018
Figure-39: China – Forecast for Organized Dealers/Large Vehicle Market (In USD Million), 2019 – 2025
Figure-40: China - Online Used Vehicle Volume (Million Units), 2015 – 2018
Figure-41: China - Forecast for Online Used Vehicle Market (Million Units), 2019 – 2025
Figure-42: China - Online Used Vehicle Market (In USD Million), 2015 – 2018
Figure-43: China - Forecast for Online Used Vehicle Market (In USD Million), 2019 – 2025
Figure-44: China - Unorganized/Independent Dealers Vehicle Volume (Million Units), 2015 – 2018
Figure-45: China - Forecast for Unorganized/Independent Dealers Vehicle Volume (Million Units), 2019 – 2025
Figure-46: China - Unorganized/Independent Dealers Vehicle Market (In USD Million), 2015 – 2018
Figure-47: China - Forecast for Unorganized/Independent Dealers Vehicle Market (In USD Million), 2019 – 2025
Figure-48: East China - Used Vehicle Volume (Million Units), 2015 – 2018
Figure-49: East China – Forecast for Used Vehicle Volume (Million Units), 2019 – 2025
Figure-50: East China - Used Vehicle Market (In USD Million), 2015 – 2018
Figure-51: East China – Forecast for Used Vehicle Market (In USD Million), 2019 – 2025
Figure-52: South Central China - Used Vehicle Volume (Million Units), 2015 – 2018
Figure-53: South Central China – Forecast for Used Vehicle Volume (Million Units), 2019 – 2025
Figure-54: South Central China - Used Vehicle Market (In USD Million), 2015 – 2018
Figure-55: South Central China – Forecast for Used Vehicle Market (In USD Million), 2019 – 2025
Figure-56: Northern China - Used Vehicle Volume (Million Units), 2015 – 2018
Figure-57: Northern China - Forecast for Used Vehicle Volume (Million Units), 2019 – 2025
Figure-58: Northern China - Used Vehicle Market (In USD Million), 2015 – 2018
Figure-59: Northern China – Forecast For Used Vehicle Market (In USD Million), 2015 – 2018
Figure-60: South West China - Used Vehicle Volume (Million Units), 2015 – 2018
Figure-61: South West China - Forecast for Used Vehicle Volume (Million Units), 2019 – 2025
Figure-62: South West China - Used Vehicle Market (In USD Million), 2015 – 2018
Figure-63: South West China - Forecast for Used Vehicle Market (In USD Million), 2019 – 2025
Figure-64: North East China - Used Vehicle Volume (In USD Million), 2015 – 2018
Figure-65: North East China - Forecast for Used Vehicle Volume (Million Units), 2019 – 2025
Figure-66: North East China - Used Vehicle Market (In USD Million), 2015 – 2018
Figure-67: North East China - Forecast for Used Vehicle Market (In USD Million), 2019 – 2025
Figure-68: North East China - Used Vehicle Volume (Million Units), 2015 – 2018
Figure-69: North East China - Forecast for Used Vehicle Volume (Million Units), 2019 – 2025
Figure-70: North East China - Used Vehicle Market (In USD Million), 2015 – 2018
Figure-71: North East China - Forecast for Used Vehicle Market (In USD Million), 2019 – 2025
Figure-72: China - Used Vehicle Less than USD 4500 Volume (Million Units), 2015 – 2018
Figure-73: China - Forecast for Used Vehicle Less than USD 4500 Volume (Million Units), 2019 – 2025
Figure-74: China - Used Vehicle Between USD 4500 – 7500 Volume (Million Units), 2015 – 2018
Figure-75: China – Forecast for Used Vehicle Between USD 4500 – 7500 Volume (Million Units), 2019 – 2025
Figure-76: China - Used Vehicle Between USD 7501 – 12000 Volume (Million Units), 2015 – 2018
Figure-77: China – Forecast for Used Vehicle Between USD 7501 – 12000 Volume (Million Units), 2019 – 2025
Figure-78: China - Used Vehicle More than USD 12000 Volume (Million Units), 2015 – 2018
Figure-79: China – Forecast for Used Vehicle More than USD 12000 Volume (Million Units), 2019 – 2025
Figure-80: China - Guazi Online Used Car Sales (In Units), 2015 - 2018
Figure-81: China – Forecast for Guazi Online Used Car Sales (In Units), 2019 - 2025
Figure-82: China - Uxin Group Online Used Car (2C and 2B business Segment) Sales (In Units), 2015 - 2018
Figure-83: China – Forecast for Uxin Group Online Used Car (2C and 2B business Segment) Sales (In Units), 2019 - 2025
Figure-84: China - Renrenche Online Used Car Sales (In Units), 2015 - 2018
Figure-85: China – Forecast for Renrenche Online Used Car Sales (In Units), 2019 - 2025
Figure-86: China - Souche Online Used Car Sales (In Units), 2015 - 2018
Figure-87: China – Forecast for Souche Online Used Car Sales (In Units), 2019 - 2025
Figure-88: China - CAR Inc Online Used Car Sales (In Units), 2015 - 2018
Figure-89: China – Forecast for CAR Inc Online Used Car Sales (In Units), 2019 - 2025
List of Tables:
Table-1: China - Used Vehicle Volume Share by Types (Percent), 2015 – 2018
Table-2: China - Forecast for Used Vehicle Volume Share by Types (Percent), 2019 – 2025
Table-3: China - Used Car Volume Share by Region (Percent), 2015 – 2018
Table-4: China - Forecast for Used Vehicle Volume Share by Region (Percent), 2019 – 2025