Renub

    Global Automotive Market, Growth & Forecast, Impact of Coronavirus, Industry Trends, By Region, Opportunity Company Analysis

    Excel: 12 Hours
    PDF: 24 Hours
    Sep 2021
    Pages: 250

    Global Automotive Market Outlook

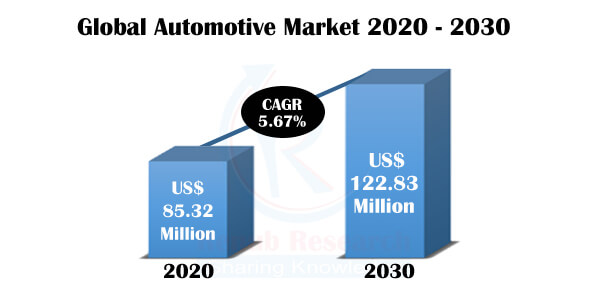
    The automotive industry is an essential economic criterion, is on the verge of new technologies and innovations. Moreover, customers' unique and costly features demand is leading the automotive industry in the modern era. Globally the automobile industry is supported by various factors such as the availability of skilled labour at low cost, robust R&D centres, and low-cost steel production. According to Renub Research, Global Automotive Market is expected to reach 122.83 Million Units by 2030.


    global automotive market


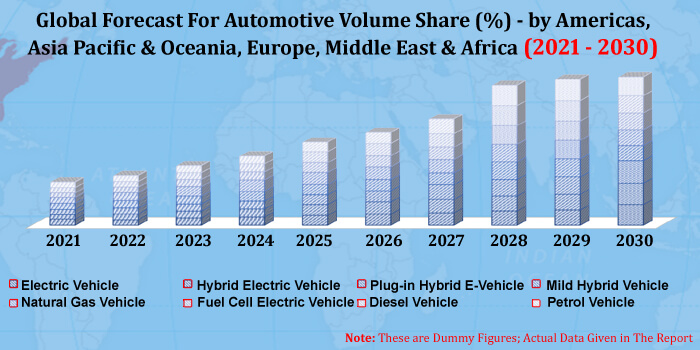
    Globally, today consumers use all-purpose vehicles, whether they are commuting alone to work or taking the whole family to the beach. The industry's principal categories include EV, HEV, PHEV, MHEV, NGV, FCEV, Diesel and Petrol. The MHEVs represent a technological leap in the automotive market—vehicles solely based on a combustion engine. From today's viewpoint, combustion engine-based powertrains will remain dominant, at least for the coming decade.


    Furthermore, MHEVs are also bringing higher efficiency and lower running costs to combustion engines and could therefore provide promising opportunities for OEMs, suppliers, and customers until electric powertrains become ubiquitous. Also, consumers' new habit of using tailored solutions for each purpose will lead to specialized vehicles designed for particular necessities. For instance, the market for a car mainly built for e-hailing services—that is, a car designed for high utilization, robustness, additional mileage, and passenger comfort—would already be millions of units today, and this is just the beginning. As per this research report, Global Automotive Industry is expected to grow with a CAGR of 3.71% from 2020-2030.


    Our report has covered the regional analysis for the Americas, Asia Pacific & Oceania, Europe and Middle East & Africa. The Asia Pacific is the largest market due to the growing demand for passenger cars and fuel-efficient vehicles. The developments in engine technology are progressing significantly, accompanying the rising emission standards across the globe. These factors are notable patrons to the incremental growth of the automotive market in the region. Moreover, the rising adoption of MHEVs in the Asia Pacific is expected to drive automotive production. In Asia Pacific countries, winning government incentives to simplify electro mobility and increased investments by automakers are expected to drive the market.


    For instance, some of the recent initiatives taken by the Government of India are:

    • In Union Budget 2021-22, the government introduced the voluntary vehicle scrappage policy, expected to advance the market for new vehicles after lifting old unfit vehicles currently plying on the Indian roads.
    • In February 2021, the Delhi government started setting up 100 vehicle battery charging spots across the state to expedite the adoption of electric vehicles.


    The global automotive market is dominated by major players such as Volkswagen, Toyota Motor Corporation, Daimler AG, Ford Motor Company and Honda Motor Company. These companies offer an extensive variety of automotive, fulfilling all significant functions in a vehicle. The key strategies adopted by these companies to sustain their market position are new product developments, acquisitions, and partnerships & expansions. As per this research report, Worldwide Automotive Market was valued at 85.32 Million Units in 2020.


    global automotive industry


    Coronavirus devastating effect on Global Automotive Market:

    The coronavirus (Covid-19) pandemic has induced a decade of expansion in the global automotive industry to an abrupt standstill, with sales plummeting in most markets. As a result, there have been more job cuts beyond the sector, with plants and suppliers shutting down in countries where the markets are slowest to recover.


    After a disastrous 2020 for the global automotive sector, an upturn is expected in 2021, but carmakers worldwide will demand to seek out growth pockets while pushing through extensive cost-cutting programmes. The rivalry among the US and China will continue in 2021. Sanctions and investment restrictions may even force third-party countries to choose between the two rivals.


    Renub Research latest report titled “Automotive Market, Global Forecast By Americas (EV Volume, HEV Volume, PHEV Volume, MHEV Volume, NGV Volume, FCEV Volume, Diesel Volume and Petrol Volume), Asia Pacific & Oceania (EV Volume, HEV Volume, PHEV Volume, MHEV Volume, NGV Volume, FCEV Volume, Diesel Volume and Petrol Volume), Europe (EV Volume, HEV Volume, PHEV Volume, MHEV Volume, NGV Volume, FCEV Volume, Diesel Volume and Petrol Volume), Middle East & Africa (EV Volume, HEV Volume, PHEV Volume, MHEV Volume, NGV Volume, FCEV Volume, Diesel Volume and Petrol Volume), Company (Volkswagen, Toyota Motor Corporation, Daimler AG, Ford Motor Company and Honda Motor Company)" provides a detailed analysis of Global Automotive Market.


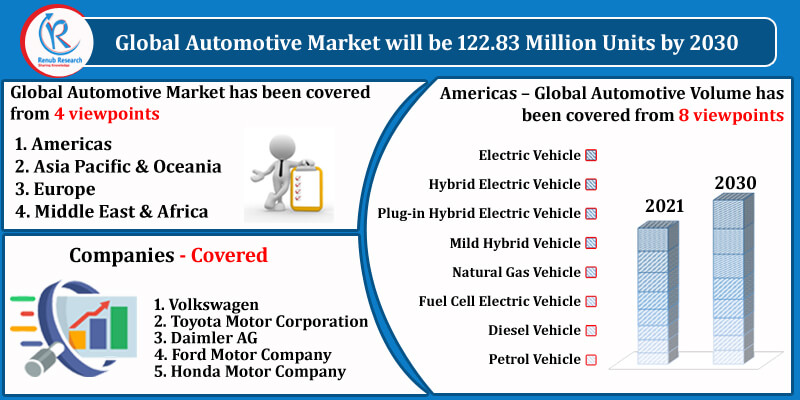
    Global Automotive Market has been covered from 4 viewpoints:

    1.    Americas
    2.    Asia Pacific & Oceania
    3.    Europe
    4.    Middle East & Africa


    Americas – Global Automotive Volume has been covered from 8 viewpoints:

    1.    Electric Vehicle
    2.    Hybrid Electric Vehicle
    3.    Plug-in Hybrid Electric Vehicle
    4.    Mild Hybrid Vehicle
    5.    Natural Gas Vehicle
    6.    Fuel Cell Electric Vehicle
    7.    Diesel Vehicle
    8.    Petrol Vehicle


    Asia Pacific & Oceania – Global Automotive Volume has been covered from 8 viewpoints:

    1.    Electric Vehicle
    2.    Hybrid Electric Vehicle
    3.    Plug-in Hybrid Electric Vehicle
    4.    Mild Hybrid Vehicle
    5.    Natural Gas Vehicle
    6.    Fuel Cell Electric Vehicle
    7.    Diesel Vehicle
    8.    Petrol Vehicle


    global automotive industry


    Europe – Global Automotive Volume has been covered from 8 viewpoints:

    1.    Electric Vehicle
    2.    Hybrid Electric Vehicle
    3.    Plug-in Hybrid Electric Vehicle
    4.    Mild Hybrid Vehicle
    5.    Natural Gas Vehicle
    6.    Fuel Cell Electric Vehicle
    7.    Diesel Vehicle
    8.    Petrol Vehicle


    Middle East & Africa – Global Automotive Volume has been covered from 8 viewpoints:

    1.    Electric Vehicle
    2.    Hybrid Electric Vehicle
    3.    Plug-in Hybrid Electric Vehicle
    4.    Mild Hybrid Vehicle
    5.    Natural Gas Vehicle
    6.    Fuel Cell Electric Vehicle
    7.    Diesel Vehicle
    8.    Petrol Vehicle


    Company Insights:

    •    Overview
    •    Recent Development & Strategies
    •    Financial Insights


    Company Analysis:

    1.    Volkswagen
    2.    Toyota Motor Corporation 
    3.    Daimler AG 
    4.    Ford Motor Company
    5.    Honda Motor Company 


    Report Details:

    Report Features Details
    Base Year 2020
    Historical Period 2017 - 2020
    Forecast Period 2021 - 2030
    Volume Million Units
    Segment Covered Electric Vehicle, Hybrid Electric Vehicle, Plug-in Hybrid Electric Vehicle, Mild Hybrid Vehicle, Natural Gas Vehicle, Fuel Cell Electric Vehicle, Diesel Vehicle, Petrol Vehicle
    Region Covered Americas, Asia Pacific & Oceania, Europe, Middle East & Africa
    Companies Covered Volkswagen, Toyota Motor Corporation, Daimler AG, Ford Motor Company, Honda Motor Company
    Customization Scope 20% Free Customization
    Post-Sale Analyst Support 1 Year (52 Weeks)
    Delivery Format PDF and Excel through Email (We can also provide the editable version of the report in PPT/Word format on request)

    1.    Introduction

    2.    Research Methodology
    3.    Executive Summary

    4.    Market Dynamics

    4.1    Growth Drivers
    4.2    Challenges


    5.    Global Automotive Market

    5.1    Americas
    5.2    Asia Pacific & Oceania
    5.3    Europe
    5.4    Middle East & Africa


    6.    Volume Share

    6.1    Region Wise Automotive Vehicle Types
    6.2    Region by Automotive Vehicle Categories

    6.2.1    Americas
    6.2.2    Asia Pacific & Oceania
    6.2.3    Europe
    6.2.4    Middle East & Africa

    6.3    Automotive by Categories
    6.4    Automotive Category by Regions

    6.4.1    Electric Vehicle
    6.4.2    Hybrid Electric Vehicle
    6.4.3    Plug-in Hybrid Electric Vehicle
    6.4.4    Mild Hybrid Vehicle
    6.4.5    Natural Gas Vehicle
    6.4.6    Fuel Cell Electric Vehicle
    6.4.7    Diesel Vehicle
    6.4.8    Petrol Vehicle


    7.    Americas – Global Automotive Volume

    7.1    Electric Vehicle
    7.2    Hybrid Electric Vehicle
    7.3    Plug-in Hybrid Electric Vehicle
    7.4    Mild Hybrid Vehicle
    7.5    Natural Gas Vehicle
    7.6    Fuel Cell Electric Vehicle
    7.7    Diesel Vehicle
    7.8    Petrol Vehicle


    8.    Asia Pacific & Oceania – Global Automotive Volume

    8.1    Electric Vehicle
    8.2    Hybrid Electric Vehicle
    8.3    Plug-in Hybrid Electric Vehicle
    8.4    Mild Hybrid Vehicle
    8.5    Natural Gas Vehicle
    8.6    Fuel Cell Electric Vehicle
    8.7    Diesel Vehicle
    8.8    Petrol Vehicle


    9.    Europe– Global Automotive Volume

    9.1    Electric Vehicle
    9.2    Hybrid Electric Vehicle
    9.3    Plug-in Hybrid Electric Vehicle
    9.4    Mild Hybrid Vehicle
    9.5    Natural Gas Vehicle
    9.6    Fuel Cell Electric Vehicle
    9.7    Diesel Vehicle
    9.8    Petrol Vehicle


    10.    Middle East & Africa– Global Automotive Volume

    10.1    Electric Vehicle
    10.2    Hybrid Electric Vehicle
    10.3    Plug-in Hybrid Electric Vehicle
    10.4    Mild Hybrid Vehicle
    10.5    Natural Gas Vehicle
    10.6    Fuel Cell Electric Vehicle
    10.7    Diesel Vehicle
    10.8    Petrol Vehicle


    11.    By Vehicle Type - Global Automotive Volume

    11.1    Electric Vehicle
    11.2    Hybrid Electric Vehicle
    11.3    Plug-in Hybrid Electric Vehicle
    11.4    Mild Hybrid Vehicle
    11.5    Natural Gas Vehicle
    11.6    Fuel Cell Electric Vehicle
    11.7    Diesel Vehicle
    11.8    Petrol Vehicle


    12.    Company Analysis

    12.1    Volkswagen

    12.1.1    Overview
    12.1.2    Recent Development & Strategies
    12.1.3    Financial Insights

    12.2    Toyota Motor Corporation

    12.2.1    Overview
    12.2.2    Recent Development & Strategies
    12.2.3    Financial Insights

    12.3    Daimler AG

    12.3.1    Overview
    12.3.2    Recent Development & Strategies
    12.3.3    Financial Insights

    12.4    Ford Motor Company

    12.4.1    Overview
    12.4.2    Recent Development & Strategies
    12.4.3    Financial Insights

    12.5    Honda Motor Company

    12.5.1    Overview
    12.5.2    Recent Development & Strategies
    12.5.3    Financial Insights


    List Of Figures:

    Figure-01:        Global Automotive Volume (Million Units), 2017 – 2020
    Figure-02:        Forecast for – Global Automotive Volume (Million Units), 2021 – 2030
    Figure-03:        Americas Automotive Volume (Million Units), 2017 – 2020
    Figure-04:        Forecast for – Americas Automotive Volume (Million Units), 2021 – 2030
    Figure-05:        Asia Pacific & Oceania Automotive Volume (Million Units), 2017 – 2020
    Figure-06:        Forecast for – Asia Pacific & Oceania Automotive Volume (Million Units), 2021 – 2030
    Figure-07:        Europe Automotive Volume (Million Units), 2017 – 2020
    Figure-08:        Forecast for – Europe Automotive Volume (Million Units), 2021 – 2030
    Figure-09:        Middle East & Africa Automotive Volume (Million Units), 2017 – 2020
    Figure-10:        Forecast for – Middle East & Africa Automotive Volume (Million Units), 2021 – 2030
    Figure-11:        Americas – EV Volume (Thousand Units), 2017 – 2020
    Figure-12:        Americas – Forecast for EV Volume (Thousand Units), 2021 – 2030
    Figure-13:        Americas – HEV Volume (Thousand Units), 2017 – 2020
    Figure-14:        Americas – Forecast for HEV Volume (Thousand Units), 2021 – 2030
    Figure-15:        Americas – PHEV Volume (Thousand Units), 2017 – 2020
    Figure-16:        Americas – Forecast for PHEV Volume (Thousand Units), 2021 – 2030
    Figure-17:        Americas – MHEV Volume (Thousand Units), 2017 – 2020
    Figure-18:        Americas – Forecast for MHEV Volume (Thousand Units), 2021 – 2030
    Figure-19:        Americas – NGV Volume (Thousand Units), 2017 – 2020
    Figure-20:        Americas – Forecast for NGV Volume (Thousand Units), 2021 – 2030
    Figure-21:        Americas – FCEV Volume (Thousand Units), 2017 – 2020
    Figure-22:        Americas – Forecast for FCEV Volume (Thousand Units), 2021 – 2030
    Figure-23:        Americas – Diesel Vehicle Volume (Thousand Units), 2017 – 2020
    Figure-24:        Americas – Forecast for Diesel Vehicle Volume (Thousand Units), 2021 – 2030
    Figure-25:        Americas – Petrol Vehicle Volume (Thousand Units), 2017 – 2020
    Figure-26:        Americas – Forecast for Petrol Vehicle Volume (Thousand Units), 2021 – 2030
    Figure-27:        Asia Pacific & Oceania – EV Volume (Thousand Units), 2017 – 2020
    Figure-28:        Asia Pacific & Oceania – Forecast for EV Volume (Thousand Units), 2021 – 2030
    Figure-29:        Asia Pacific & Oceania – HEV Volume (Thousand Units), 2017 – 2020
    Figure-30:        Asia Pacific & Oceania – Forecast for HEV Volume (Thousand Units), 2021 – 2030
    Figure-31:        Asia Pacific & Oceania – PHEV Volume (Thousand Units), 2017 – 2020
    Figure-32:        Asia Pacific & Oceania – Forecast for PHEV Volume (Thousand Units), 2021 – 2030
    Figure-33:        Asia Pacific & Oceania – MHEV Volume (Thousand Units), 2017 – 2020
    Figure-34:        Asia Pacific & Oceania – Forecast for MHEV Volume (Thousand Units), 2021 – 2030
    Figure-35:        Asia Pacific & Oceania – NGV Volume (Thousand Units), 2017 – 2020
    Figure-36:        Asia Pacific & Oceania – Forecast for NGV Volume (Thousand Units), 2021 – 2030
    Figure-37:        Asia Pacific & Oceania – FCEV Volume (Thousand Units), 2017 – 2020
    Figure-38:        Asia Pacific & Oceania – Forecast for FCEV Volume (Thousand Units), 2021 – 2030
    Figure-39:        Asia Pacific & Oceania – Diesel Vehicle Volume (Thousand Units), 2017 – 2020
    Figure-40:        Asia Pacific & Oceania – Forecast for Diesel Vehicle Volume (Thousand Units), 2021 – 2030
    Figure-41:        Asia Pacific & Oceania – Petrol Vehicle Volume (Thousand Units), 2017 – 2020
    Figure-42:        Asia Pacific & Oceania – Forecast for Petrol Vehicle Volume (Thousand Units), 2021 – 2030
    Figure-43:        Europe – EV Volume (Thousand Units), 2017 – 2020
    Figure-44:        Europe – Forecast for EV Volume (Thousand Units), 2021 – 2030
    Figure-45:        Europe – HEV Volume (Thousand Units), 2017 – 2020
    Figure-46:        Europe – Forecast for HEV Volume (Thousand Units), 2021 – 2030
    Figure-47:        Europe – PHEV Volume (Thousand Units), 2017 – 2020
    Figure-48:        Europe – Forecast for PHEV Volume (Thousand Units), 2021 – 2030
    Figure-49:        Europe – MHEV Volume (Thousand Units), 2017 – 2020
    Figure-50:        Europe – Forecast for MHEV Volume (Thousand Units), 2021 – 2030
    Figure-51:        Europe – NGV Volume (Thousand Units), 2017 – 2020
    Figure-52:        Europe – Forecast for NGV Volume (Thousand Units), 2021 – 2030
    Figure-53:        Europe – FCEV Volume (Thousand Units), 2017 – 2020
    Figure-54:        Europe – Forecast for FCEV Volume (Thousand Units), 2021 – 2030
    Figure-55:        Europe – Diesel Vehicle Volume (Thousand Units), 2017 – 2020
    Figure-56:        Europe – Forecast for Diesel Vehicle Volume (Thousand Units), 2021 – 2030
    Figure-57:        Europe – Petrol Vehicle Volume (Thousand Units), 2017 – 2020
    Figure-58:        Europe – Forecast for Petrol Vehicle Volume (Thousand Units), 2021 – 2030
    Figure-59:        Middle East & Africa – EV Volume (Thousand Units), 2017 – 2020
    Figure-60:        Middle East & Africa – Forecast for EV Volume (Thousand Units), 2021 – 2030
    Figure-61:        Middle East & Africa – HEV Volume (Thousand Units), 2017 – 2020
    Figure-62:        Middle East & Africa – Forecast for HEV Volume (Thousand Units), 2021 – 2030
    Figure-63:        Middle East & Africa – PHEV Volume (Thousand Units), 2017 – 2020
    Figure-64:        Middle East & Africa – Forecast for PHEV Volume (Thousand Units), 2021 – 2030
    Figure-65:        Middle East & Africa – MHEV Volume (Thousand Units), 2017 – 2020
    Figure-66:        Middle East & Africa – Forecast for MHEV Volume (Thousand Units), 2021 – 2030
    Figure-67:        Middle East & Africa – NGV Volume (Thousand Units), 2017 – 2020
    Figure-68:        Middle East & Africa – Forecast for NGV Volume (Thousand Units), 2021 – 2030
    Figure-69:        Middle East & Africa – FCEV Volume (Thousand Units), 2017 – 2020
    Figure-70:        Middle East & Africa – Forecast for FCEV Volume (Thousand Units), 2021 – 2030
    Figure-71:        Middle East & Africa – Diesel Vehicle Volume (Thousand Units), 2017 – 2020
    Figure-72:        Middle East & Africa – Forecast for Diesel Vehicle Volume (Thousand Units), 2021 – 2030
    Figure-73:        Middle East & Africa – Petrol Vehicle Volume (Thousand Units), 2017 – 2020
    Figure-74:        Middle East & Africa – Forecast for Petrol Vehicle Volume (Thousand Units), 2021 – 2030
    Figure-75:        Volkswagen – Global Revenue (Billion US$), 2017 – 2020
    Figure-76:        Volkswagen – Forecast for Global Revenue (Billion US$), 2021 – 2030
    Figure-77:        Toyota Motor Corporation – Global Revenue (Billion US$), 2017 – 2020
    Figure-78:        Toyota Motor Corporation – Forecast for Global Revenue (Billion US$), 2021 – 2030
    Figure-79:        Daimler AG – Global Revenue (Billion US$), 2017 – 2020
    Figure-80:        Daimler AG – Forecast for Global Revenue (Billion US$), 2021 – 2030
    Figure-81:        Ford Motor Company – Global Revenue (Billion US$), 2017 – 2020
    Figure-82:        Ford Motor Company – Forecast for Global Revenue (Billion US$), 2021 – 2030
    Figure-83:        Honda Motor Company – Global Revenue (Billion US$), 2017 – 2020
    Figure-84:        Honda Motor Company – Forecast for Global Revenue (Billion US$), 2021 – 2030


    List Of Tables:

    Table-01:        Global Automotive – Volume Share by Regions (Percent), 2017 – 2020
    Table-02:        Forecast for – Global Automotive Volume Share by Regions (Percent), 2021 – 2030
    Table-03:        Americas – Automotive Region by Categories Volume Share (Percent), 2017 – 2020
    Table-04:        Americas – Forecast for Automotive Region by Categories Volume Share (Percent), 2021 – 2030
    Table-05:        Asia Pacific & Oceania – Automotive Region by Categories Volume Share (Percent), 2017 – 2020
    Table-06:        Asia Pacific & Oceania – Forecast for Automotive Region by Categories Volume Share (Percent), 2021 – 2030
    Table-07:        Europe – Automotive Region by Categories Volume Share (Percent), 2017 – 2020
    Table-08:        Europe – Forecast for Automotive Region Volume Share (Percent), 2021 – 2030
    Table-09:        Middle East & Africa – Automotive Region by Categories Volume Share (Percent), 2017 – 2020
    Table-10:        Middle East & Africa – Forecast for Automotive Region by Categories Volume Share (Percent), 2021 – 2030
    Table-11:        Global Automotive – Volume Share by Category (Percent), 2017 – 2020
    Table-12:        Global Automotive – Forecast for Volume Share by Category (Percent), 2021 – 2030
    Table-13:        EV – Global Automotive Category by Region Volume Share (Percent), 2017 – 2020
    Table-14:        EV – Forecast for Global Automotive Category by Region Volume Share (Percent), 2021 – 2030
    Table-15:        HEV – Global Automotive Category by Region Volume Share (Percent), 2017 – 2020
    Table-16:        HEV – Forecast for Global Automotive Category by Region Volume Share (Percent), 2021 – 2030
    Table-17:        PHEV – Global Automotive Category by Region Volume Share (Percent), 2017 – 2020
    Table-18:        PHEV – Forecast for Global Automotive Category by Region Volume Share (Percent), 2021 – 2030
    Table-19:        MHEV – Global Automotive Category by Region Volume Share (Percent), 2017 – 2020
    Table-20:        MHEV – Forecast for Global Automotive Category by Region Volume Share (Percent), 2021 – 2030
    Table-21:        NGV – Global Automotive Category by Region Volume Share (Percent), 2017 – 2020
    Table-22:        NGV – Forecast for Global Automotive Category by Region Volume Share (Percent), 2021 – 2030
    Table-23:        FCEV – Global Automotive Category by Region Volume Share (Percent), 2017 – 2020
    Table-24:        FCEV – Forecast for Global Automotive Category by Region Volume Share (Percent), 2021 – 2030
    Table-25:        Diesel – Global Automotive Category by Region Volume Share (Percent), 2017 – 2020
    Table-26:        Diesel – Forecast for Global Automotive Category by Region Volume Share (Percent), 2021 – 2030
    Table-27:        Petrol – Global Automotive Category by Region Volume Share (Percent), 2017 – 2020
    Table-28:        Petrol – Forecast for Global Automotive Category by Region Volume Share (Percent), 2021 – 2030

    • Description
      Price
    • Chapter 1, 2, 3, 4 & 5     Pages : 25
      $1,000
    • Chapter 6     Pages : 40
      $900
    • Chapter 7     Pages : 25
      $700
    • Chapter 8     Pages : 25
      $700
    • Chapter 9     Pages : 25
      $700
    • Chapter 10     Pages : 25
      $700
    • Chapter 11     Pages : 25
      $700
    • Chapter 12.1     Pages : 5
      $150
    • Chapter 12.2     Pages : 5
      $150
    • Chapter 12.3     Pages : 5
      $150
    • Chapter 12.4     Pages : 5
      $150
    • Chapter 12.5     Pages : 5
      $150

    Related Reports