Renub

    United States Dairy Market, By Fluid Milk (Whole, Flavored, Fat-Reduced, Buttermilk and Others), Products (Ice Cream, Frozen Yogurt, Sherbet, Cheese & Sour Cream), Companies & Forecast

    Excel: 4 Hours
    PDF: 4 Hours
    Jul 2020
    Pages: 102

    xGet Free Customization in This Report

    The per capita consumption of fluid milk is decreasing in the United States because people prefer a non-dairy product like soya milk, almond milk and other organic products. The many segments of dairy like flavored milk, cottage cheese, low-fat ice-cream and fresh yogurt are rising, and it will continue to grow during the forecast period. The dairy farmer of the United States continues to struggle to meet market demand. Oversupply is one of the biggest issues of the United States dairy market because it creates price fluctuation and margin challenges. The dairy farm of the United States is not able to identify the exact demand for domestic consumption and export supply. Besides many dairy farms of the United States are closing since the last couple of year due to low profitability and government regulation. According to Renub Research report, United States Dairy Market is expected to reach 52 Billion Pound by the end of year 2026.


    The number of cows in the United States is also declining. The average number of cows was declining to reach 9.336 million in 2019 from 9.406 million cows in 2017. Rising milk productivity per cow is one of the core key factors of the United States dairy market. Since the last couple of years, US dairy faces demand and supply gap of milk and dairy product. Therefore actual forecasting of the dairy product will help out the US dairy market in terms of stability of price fluctuation and margin challenges etc. The consumption of whole milk has slightly declined, but on the other hand, flavored whole milk is rising due to preference among children and adults during the exercise. The retail sales of fresh frozen yogurt are rising.


    The milk is produced in almost all the 50 states of the US, western and northern holds large market share. In the United States, the dairy farm is a family-owned business, and they are a member of producer co-operative society. In this report, the market is divided into two parts; fluid milk and soft dairy product which includes ice-cream, yogurt, cheese, sour cream etc. Americans are moving towards dairy alternative product due to health benefits, and large populations of the United States have lactose intolerance. Organic milk and dairy product are one of better substitute of conventional dairy product that will hinder the US dairy market in forecast year. The demand for sour cream was rising in the US because it is the core ingredient of many recipes.


    Whole Milk will hold the largest market share in the forecast period. The conventional fluid milk consumption of the United States is declining because other nutritional and functional substitutes are available in the market. As flavored whole milk demand is rising and it will continue this trend in future.


    Renub Research latest study report “United States Dairy Market, By Fluid Milk (Whole Milk Sales, Flavored Whole Milk, Fat-Reduced Milk, Buttermilk and Other Fluid Milk Products) Soft Dairy Products (Ice Cream, Frozen Yogurt, Sherbet, Other Frozen Dairy, Yogurt (Without Frozen), Cottage Cheese and Sour Cream), Company Analysis (Nestlé USA, Inc, Dean Foods Company, Danone S.A., Dairy Farmers of America, Land O'Lakes, Inc., The Kraft Heinz Company, Schreiber Foods Inc., California Dairies, Inc.)"


    United States Dairy Market by Fluid Milk

    •    Whole Milk Sales
    •    Flavored Whole Milk
    •    Fat-Reduced Milk
    •    Buttermilk
    •    Other Fluid Milk Products


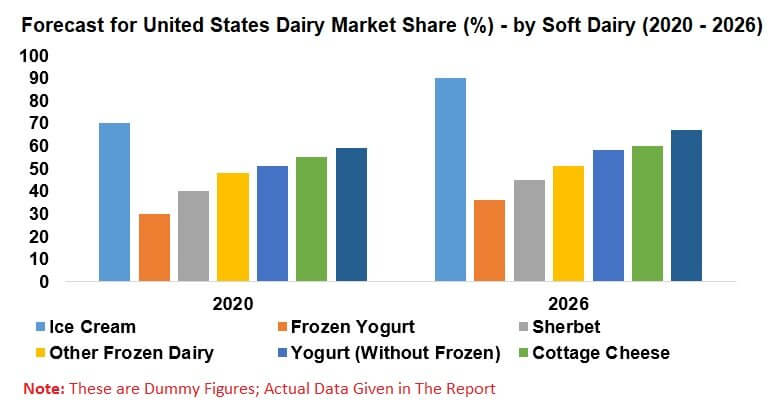
    United States Dairy Market by Soft Dairy

    •    Ice Cream
    •    Frozen Yogurt
    •    Sherbet
    •    Other Frozen Dairy
    •    Yogurt (Without Frozen)
    •    Cottage Cheese
    •    Sour Cream


    United States Ice Cream Market

    •    Regular
    •    Low-Fat
    •    Non-Fat


    If the information you seek is not included in the current scope of the study kindly share your specific requirements with our custom research team at info@renub.com

    1.    Introduction

    2.    Research Methodology
    3.    Executive Summary

    4.    Market Dynamics

    4.1    Growth Drivers
    4.2    Challenges


    5.    United States Dairy Market

    5.1    Overview
    5.2    Retail Sales


    6.    United States Fluid Beverage Milk Volume by Segment

    6.1    Whole Milk Sales
    6.2    Flavored Whole Milk
    6.3    Fat-Reduced Milk
    6.4    Buttermilk
    6.5    Other Fluid Milk Products


    7.    United States Soft Dairy Volume by Segment

    7.1    Ice Cream

    7.1.1    Regular
    7.1.2    Low-Fat
    7.1.3    Non-Fat

    7.2    Frozen Yogurt
    7.3    Sherbet
    7.4    Other frozen dairy
    7.5    Yogurt (Without Frozen)
    7.6    Cottage Cheese
    7.7    Sour Cream


    8.    Key Players

    8.1    Nestlé USA, Inc

    8.1.1    Overview
    8.1.2    Recent Development & Strategy
    8.1.3    Revenue

    8.2    Dean Foods Company

    8.2.1    Overview
    8.2.2    Recent Development & Strategy
    8.2.3    Revenue

    8.3    Danone S.A.

    8.3.1    Overview
    8.3.2    Recent Development & Strategy
    8.3.3    Revenue

    8.4    Dairy Farmers of America

    8.4.1    Overview
    8.4.2    Recent Development & Strategy
    8.4.3    Revenue

    8.5    Land O'Lakes, Inc.

    8.5.1    Overview
    8.5.2    Recent Development & Strategy
    8.5.3    Revenue

    8.6    The Kraft Heinz Company

    8.6.1    Overview
    8.6.2    Recent Development & Strategy
    8.6.3    Revenue

    8.7    Schreiber Foods Inc.

    8.7.1    Overview
    8.7.2    Recent Development & Strategy
    8.7.3    Revenue

    8.8    California Dairies, Inc.

    8.8.1    Overview
    8.8.2    Recent Development & Strategy
    8.8.3    Revenue


    List of Figures:

    Figure-01:        United States – Milk Share by Type (2026) 
    Figure-02:        United States – Forecast for Dairy Produce Milk in (2026) 
    Figure-03:        Per Capita Consumption of Soft Dairy Products (2014 – 2019) 
    Figure-04:        Change in Per Capita Disposable Income in Precentage (Monthly) 
    Figure-05:        Market Share Analysis by Fluid Milk in Percentage (2019, 2026) 
    Figure-06:        United States – Dairy Market (Million Pound), 2016 – 2019
    Figure-07:        United States – Forecast for Dairy Market (Million Pound), 2020 – 2026
    Figure-08:        United States – YOY Change in Licensed Dairy Operation by State, 2019 
    Figure-09:        United States – Whole Milk Market (Million Pound), 2016 – 2019
    Figure-10:        United States – Forecast for Whole Milk Market (Million Pound), 2020 – 2026
    Figure-11:        United States – Flavored Whole Milk Market (Million Pound), 2016 – 2019
    Figure-12:        United States – Forecast for Flavored Whole Milk Market (Million Pound), 2020 – 2026
    Figure-13:        United States – Fat-Reduced Milk Market (Million Pound), 2016 – 2019
    Figure-14:        United States – Forecast for Fat-Reduced Milk Market (Million Pound), 2020 – 2026
    Figure-15:        United States – Buttermilk Market (Million Pound), 2016 – 2019
    Figure-16:        United States – Forecast for Buttermilk Market (Million Pound), 2020 – 2026
    Figure-17:        United States – Other Fluid Milk Market (Million Pound), 2016 – 2019
    Figure-18:        United States – Forecast for Other Fluid Milk Market (Million Pound), 2020 – 2026
    Figure-19:        United States – Ice-Cream Market (Million Pound), 2016 – 2019
    Figure-20:        United States – Forecast for Ice-Cream Market (Million Pound), 2020 – 2026
    Figure-21:        United States – Frozen Yogurt Market (Million Pound), 2016 – 2019
    Figure-22:        United States – Forecast for Frozen Yogurt Market (Million Pound), 2020 – 2026
    Figure-23:        United States – Sherbet Market (Million Pound), 2016 – 2019
    Figure-24:        United States – Forecast for Sherbet Market (Million Pound), 2020 – 2026
    Figure-25:        United States – Other Frozen Dairy Market (Million Pound), 2016 – 2019
    Figure-26:        United States – Forecast for Other Frozen Dairy Market (Million Pound), 2020 – 2026
    Figure-27:        United States – Yogurt without Frozen Market (Million Pound), 2016 – 2019
    Figure-28:        United States – Forecast for Yogurt without Frozen Market (Million Pound), 2020 – 2026
    Figure-29:        United States – Cottage Cheese Market (Million Pound), 2016 – 2019
    Figure-30:        United States – Forecast for Cottage Cheese Market (Million Pound), 2020 – 2026
    Figure-31:        United States – Sour Cream Market (Million Pound), 2016 – 2019
    Figure-32:        United States – Forecast for Sour Cream Market (Million Pound), 2020 – 2026
    Figure-33:        Global – Nestle Revenue (Million US$), 2015 – 2019 
    Figure-34:        Global – Forecast for Nestle Revenue (Million US$), 2020 – 2026 
    Figure-35:        Global – Dean Foods Company Revenue (Million US$), 2015 – 2019 
    Figure-36:        Global – Forecast for Dean Foods Company Revenue (Million US$), 2020 – 2026 
    Figure-37:        Global – Danone S.A Revenue (Billion US$), 2015 – 2019 
    Figure-38:        Global – Forecast for Danone S.A Revenue (Billion US$), 2020 – 2026 
    Figure-39:        Global – Dairy Farmers of America Revenue (Billion US$), 2015 – 2019 
    Figure-40:        Global – Forecast for Dairy Farmers of America Revenue (Billion US$), 2020 – 2026 
    Figure-41:        Global – The Kraft Heinz Company Revenue (Million US$), 2015 – 2019 
    Figure-42:        Global – Forecast for The Kraft Heinz Company Revenue (Million US$), 2020 – 2026 
    Figure-43:        Consumption of Cheese in Pound (2014 – 2018) 


    List of Tables:
        
    Table-1:    Market Share Analysis by Soft Dairy in Percent (2016 – 2019) 
    Table-2:    Forecast for Market Share Analysis by Soft Dairy in Percent (2020 – 2026) 

    Related Reports