1. Introduction
2. Research Methodology
3. Executive Summary
4. Market Dynamics
4.1 Growth Drivers
4.2 Challenges
5. SWOT Analysis
6. United States Organic Dairy Analysis
6.1 Market
6.2 Volume
7. Volume Share Analysis
7.1 Fluid Beverage Milk Sales
7.2 Share Analysis by Segment
7.3 Organic Fat-reduced Milk Share by Type
7.4 Organic Yogurt Share by Packaging Type
7.5 Organic Yogurt Share by Distribution Channel
8. Organic Dairy Market by Segment
8.1 Organic Milk
8.2 Organic Yogurt
8.3 Organic Cheese
9. Organic Milk Market Type
9.1 Whole Milk Sales
9.2 Fat Reduced Milk
9.2.1 Reduced Fat Milk (2%)
9.2.2 Low Fat Milk (1%)
9.2.3 Fat-Free Milk (Skim)
9.2.4 Flavored Fat-Reduced Milk
10. United States Organic Fluid Beverage Milk Sales by Segment
10.1 Whole Milk Sales
10.2 Fat-Reduced Milk
10.2.1 Reduced Fat Milk (2%)
10.2.2 Low Fat Milk (1%)
10.2.3 Fat-Free Milk (Skim)
10.2.4 Flavored Fat-Reduced Milk
11. Organic Yogurt Sales by Packaging Type
11.1.1 Cups
11.1.2 Tubs
11.1.3 Drinks
11.1.4 Tubes
12. Organic Yogurt Sales by Distribution Channel
12.1.1 Grocery stores
12.1.2 Walmart, club, mass merchandisers, and military stores
12.1.3 Convenience store
12.1.4 Drug Store
13. Organic cheese Volume Sales
14. Key Players
14.1 Nestlé USA, Inc
14.1.1 Overview
14.1.2 Recent Development & Strategy
14.1.3 Revenue
14.2 Dean Foods Company
14.2.1 Overview
14.2.2 Recent Development & Strategy
14.2.3 Revenue
14.3 Danone S.A.
14.3.1 Overview
14.3.2 Recent Development & Strategy
14.3.3 Revenue
14.4 Dairy Farmers of America
14.4.1 Overview
14.4.2 Recent Development & Strategy
14.4.3 Revenue
14.5 The Kraft Heinz Company
14.5.1 Overview
14.5.2 Recent Development & Strategy
14.5.3 Revenue
List of Figures:
Figure-01: United States – Organic Dairy Market (Million US$), 2019 - 2026
Figure-02: Organic Yogurt Distributor Channels in (percentage) 2019
Figure-03: Rising per capita consumption of soft dairy products
Figure-04: Increasing per capita disposable income and people are well aware of the nutritional value of the organic dairy product
Figure-05: United States – Organic Dairy Market (Million US$), 2017 – 2019
Figure-06: United States – Forecast for Organic Dairy Market (Million US$), 2020 – 2026
Figure-07: United States – Organic Dairy Volume (Million Pound), 2017 – 2019
Figure-08: United States – Forecast for Organic Dairy Volume (Million Pound), 2020 – 2026
Figure-09: United States – Organic Fluid Beverage Milk Sales Share (%) by Segment, 2017 – 2019
Figure-10: United States – Forecast for Organic Fluid Beverage Milk Sales Share (%) by Segment, 2020 – 2026
Figure-11: United States – Organic Fat Reduced Milk Share (%) by Type, 2017 – 2019
Figure-12: United States – Forecast for Organic Fat Reduced Milk Share (%) by Type, 2020 – 2026
Figure-13: United States – Organic Yogurt Share (%) by Packaging Type, 2017 – 2019
Figure-14: United States – Forecast for Organic Yogurt Share (%) by Packaging Type, 2020 – 2026
Figure-15: United States – Organic Milk Market (Million US$), 2017 – 2019
Figure-16: United States – Forecast for Organic Milk Market (Million US$), 2020 – 2026
Figure-17: United States – Organic Yogurt Market (Million US$), 2017 – 2019
Figure-18: United States – Forecast for Organic Yogurt Market (Million US$), 2020 – 2026
Figure-19: United States – Organic Cheese Market (Million US$), 2017 – 2019
Figure-20: United States – Forecast for Organic Cheese Market (Million US$), 2020 – 2026
Figure-21: United States – Organic Whole Milk Market (Million US$), 2017 – 2019
Figure-22: United States – Forecast for Organic Whole Milk Market (Million US$), 2020 – 2026
Figure-23: United States – Fat Reduced Milk Market (Million US$), 2017 – 2019
Figure-24: United States – Forecast for Fat Reduced Milk Market (Million US$), 2020 – 2026
Figure-25: United States – Fat-Reduced Milk (2%) Market (Million US$), 2017 – 2019
Figure-26: United States – Forecast for Fat-Reduced Milk (2%) Market (Million US$), 2020 – 2026
Figure-27: United States – Organic Low fat Milk (1%) Market (Million US$), 2017 – 2019
Figure-28: United States – Forecast for Organic Low fat Milk (1%) Market (Million US$), 2020 – 2026
Figure-29: United States – Organic Fat Free (Skim) Milk Market (Million US$), 2017 – 2019
Figure-30: United States – Forecast for Organic Fat Free (Skim) Milk Market (Million US$), 2020 – 2026
Figure-31: United States – Flavored Organic Fat-Reduced Milk Market (Million US$), 2017 – 2019
Figure-32: United States – Forecast for Flavored Organic Fat-Reduced Milk Market (Million US$), 2020 – 2026
Figure-33: United States – Organic Whole Milk Sales Volume (Million Pound), 2017 – 2019
Figure-34: United States – Forecast for Organic Whole Milk Sales Volume (Million Pound), 2020 – 2026
Figure-35: United States – Organic Fat Reduced Milk Sales Volume (Million Pound), 2017 – 2019
Figure-36: United States – Forecast for Organic Fat Reduced Milk Sales Volume (Million Pound), 2020 – 2026
Figure-37: United States – Organic Reduced Fat Milk Sales Volume (Million Pound), 2017 – 2019
Figure-38: United States – Forecast for Organic Reduced Fat Milk Sales Volume (Million Pound), 2020 – 2026
Figure-39: United States – Organic Low Fat Milk Sales Volume (Million Pound), 2017 – 2019
Figure-40: United States – Forecast for Organic Low Fat Milk Sales Volume (Million Pound), 2020 – 2026
Figure-41: United States – Organic Fat Free Milk Sales Volume (Million Pound), 2017 – 2019
Figure-42: United States – Forecast for Organic Fat Free Milk Sales Volume (Million Pound), 2020 – 2026
Figure-43: United States – Organic Flavored Fat Reduce Milk Sales Volume (Million Pound), 2017 – 2019
Figure-44: United States – Forecast for Organic Flavored Fat Reduce Milk Sales Volume (Million Pound), 2020 – 2026
Figure-45: United States – Organic Yogurt Volume by Cups (Million Pound), 2017 – 2019
Figure-46: United States – Forecast for Organic Yogurt Volume by Cups (Million Pound), 2020 – 2026
Figure-47: United States – Organic Yogurt Volume by Tubs (Million Pound), 2017 – 2019
Figure-48: United States – Forecast for Organic Yogurt Volume by Tubs (Million Pound), 2020 – 2026
Figure-49: United States – Organic Yogurt Volume by Drinks (Million Pound), 2017 – 2019
Figure-50: United States – Forecast for Organic Yogurt Volumes by Drinks (Million Pound), 2020 – 2026
Figure-51: United States – Organic Yogurt Volume by Tubes (Million Pound), 2017 – 2019
Figure-52: United States – Forecast for Organic Yogurt Volume by Tubes (Million Pound), 2020 – 2026
Figure-53: United States – Organic Yogurt Volume by Grocery Store (Million Pound), 2017 – 2019
Figure-54: United States – Forecast for Organic Yogurt Volume by Grocery Store (Million Pound), 2020 – 2026
Figure-55: United States – Organic Yogurt Volume by Walmart, club, Mass Merchandisers, and Military stores (Million Pound), 2017 – 2019
Figure-56: United States – Forecast for Organic Yogurt Volume by Walmart, club, mass merchandisers, and military stores (Million Pound), 2020 – 2026
Figure-57: United States – Organic Yogurt Volume by Convenience stores (Million Pound), 2017 – 2019
Figure-58: United States – Forecast for Organic Yogurt Volume by Convenience stores (Million Pound), 2020 – 2026
Figure-59: United States – Organic Yogurt Volume by Drug stores (Million Pound), 2017 – 2019
Figure-60: United States – Forecast for Organic Yogurt Volume by Drug stores (Million Pound), 2020 – 2026
Figure-61: United States – Organic Cheese Volume (Million Pound), 2017 – 2019
Figure-62: United States – Forecast for Organic Cheese Volume (Million Pound), 2020 – 2026
Figure-63: Global – Nestle Revenue (Million US$), 2015 – 2019
Figure-64: Global – Forecast for Nestle Revenue (Million US$), 2015 – 2019
Figure-65: Global – Dean Foods Company Revenue (Million US$), 2015 – 2019
Figure-66: Global – Forecast for Dean Foods Company Revenue (Million US$), 2020 – 2026
Figure-67: Global – Danone S.A Revenue (Billion US$), 2015 – 2019
Figure-68: Global – Forecast for Danone S.A Revenue (Billion US$), 2020 – 2026
Figure-69: Global – Dairy Farmers of America Revenue (Billion US$), 2015 – 2019
Figure-70: Global – Forecast for Dairy Farmers of America Revenue (Billion US$), 2020 – 2026
Figure-71: Global – The Kraft Heinz Company Revenue (Million US$), 2015 – 2019
Figure-72: Global – Forecast for The Kraft Heinz Company Revenue (Million US$), 2020 – 2026
List of Tables:
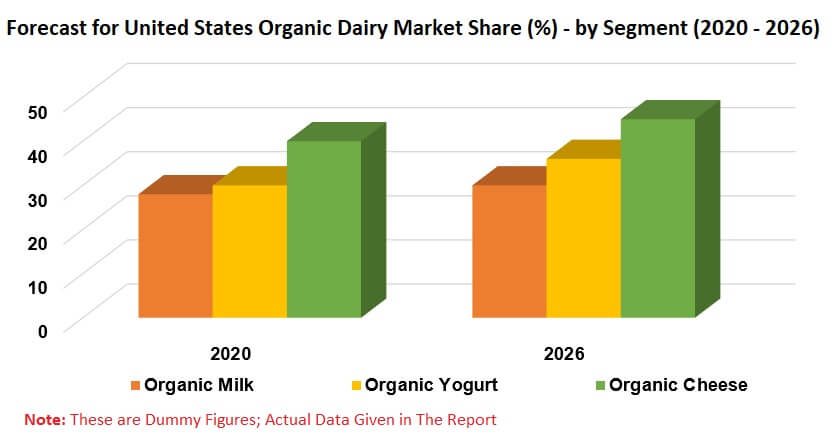
Table-01: United States – Organic Dairy Products Share (%) by Segment, 2017 – 2019
Table-02: United States – Forecast for Organic Dairy Products Share (%) by Segment, 2020 – 2026
Table-03: United States – Organic Yogurt Share (%) by Distribution Channel, 2017 – 2019
Table-04: United States – Forecast for Organic Yogurt Share (%) by Distribution Channel, 2020 – 2026