1. Introduction
2. Research & Methodology
3. Executive Summary
4. Market Dynamics
4.1 Growth Drivers
4.2 Challenges
5. Japan Food & Beverages Analysis
5.1 Market
5.2 Users
6. Market & Users Share – Japan Food & Beverages Market
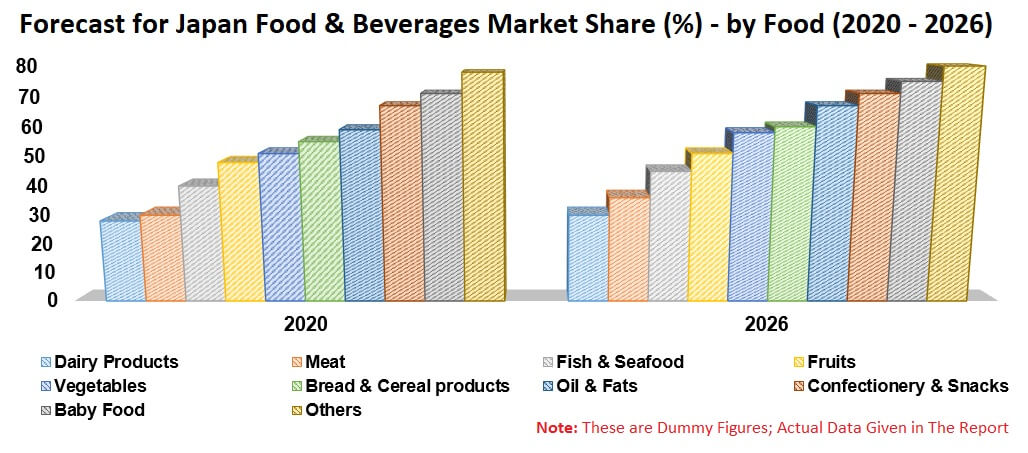
6.1 By (Food & Beverages) Sub-Segments
6.2 By Sales Channels
6.3 By Company
7. Segments – Japan Food & Beverages Market
7.1 Food
7.2 Beverages
8. Food – Market in Japan
8.1 Dairy Products
8.2 Meat
8.3 Fish & Seafood
8.4 Fruits
8.5 Vegetables
8.6 Bread & Cereal products
8.7 Oil & Fats
8.8 Confectionery & Snacks
8.9 Baby Food
8.10 Others
9. Beverages – Market in Japan
9.1 Spreads & Sweeteners
9.2 Tea
9.3 Coffee
9.4 Mineral water
9.5 Juices (Fruit/Vegetable)
9.6 Others
10. Age Group – Japan Food & Beverages Market
10.1 18 -24 Years
10.2 25-34 years
10.3 35 - 44 years
10.4 45 -54 years
10.5 55 - 64 years
11. Gender - Japan Food & Beverages Market
11.1 Male
11.2 Female
12. Income - Japan Food & Beverages Market
12.1 Low income
12.2 Medium Income
12.3 High Income
13. Sales Channels- Japan Food & Beverages Market
13.1 Offline
13.2 Online
14. Company Analysis
14.1 Asahi Group Holdings
14.2 Hanwa Co., Ltd.
14.3 Suntory Group
14.4 Meiji Holdings Co., Ltd.
14.5 Ajinomoto Co. Inc
14.6 Yamazaki Baking Co., Ltd.
14.7 Maruha Nichiro Corporation
14.8 Coca-Cola Company, Limited
List of Figures:
Figure-01: Japan – Food & Beverages Market (Million US$), 2016 – 2019
Figure-02: Japan – Forecast for Food & Beverages Market (Million US$), 2020 – 2026
Figure-03: Japan – Dairy Products Market (Million US$), 2016 – 2019
Figure-04: Japan – Forecast For Dairy Products Market (Million US$), 2020 – 2026
Figure-05: Japan – Meat Market (Million US$), 2016 – 2019
Figure-06: Japan – Forecast for Meat Market (Million US$), 2020 – 2026
Figure-07: Japan – Fish & seafood Market (Million US$), 2016 – 2019
Figure-08: Japan – Forecast for Fish & Seafood (Million US$), 2020 – 2026
Figure-09: Japan – Fruits Market (Million US$), 2016 – 2019
Figure-10: Japan – Forecast for Fruits Market (Million US$, 2020 – 2026
Figure-11: Japan – Vegetables Market (Million US$, 2016 – 2019
Figure-12: Japan – Forecast for Vegetables Market (Million US$), 2020 – 2026
Figure-13: Japan – Food & Cereal Products Market (Million US$, 2016 – 2019
Figure-14: Japan – Forecast for Bread & Cereal Products Market (Million US$), 2020 – 2026
Figure-15: Japan – Oil & Fats Market (Million US$), 2016 – 2019
Figure-16: Japan – Forecast for Oil & Fats Market (Million US$), 2020 – 2026
Figure-17: Japan – Confectionery & Snacks Market (Million Pound), 2016 – 2019
Figure-18: Japan – Forecast for Confectionery & Snacks Market (Million US$), 2020 – 2026
Figure-19: Japan – Baby Food Market (Million US$), 2016 – 2019
Figure-20: Japan – Forecast for Baby Food Market (Million US$), 2020 – 2026
Figure-21: Japan – Others Market (Million US$), 2016 – 2019
Figure-22: Japan – Forecast for Others Market (Million US$), 2020 – 2026
Figure-23: Japan – Spreads & Sweeteners Market (Million US$), 2016 – 2019
Figure-24: Japan – Forecast for Spreads & Sweeteners Market (Million US$), 2020 – 2026
Figure-25: Japan – Tea Market (Million US$), 2016 – 2019
Figure-26: Japan – Forecast for Tea Market (Million US$), 2020 – 2026
Figure-27: Japan – Coffee Market (Million US$), 2016 – 2019
Figure-28: Japan – Forecast for Coffee Market (Million US$), 2020 – 2026
Figure-29: Japan – Mineral Water Market (Million US$), 2016 – 2019
Figure-30: Japan – Forecast for Mineral Water Market (Million US$), 2020 – 2026
Figure-31: Japan – Juices (Fruit/Vegetable ) Market (Million US$), 2016 – 2019
Figure-32: Japan – Forecast for Juices (Fruit/Vegetable) Market (Million US$), 2020 – 2026
Figure-33: Japan – Others Market (Million US$), 2016 – 2019
Figure-34: Japan – Forecast for Others Market (Million US$), 2020 – 2026
Figure-35: Japan – Food & Beverage User Market (Million), 2016 – 2019
Figure-36: Japan – Forecast for Food & Beverage User Market (Million), 2020 – 2026
Figure-37: Japan – Age group, 18 – 24 Year Food & Beverage Market (Million US$), 2016 – 2019
Figure-38: Japan – Forecast for Age group 18 – 24 years Food & Beverages Market (Million US$), 2020 – 2026
Figure-39: Japan – Age group 25 – 34 years, Food & Beverages Market (Million US$), 2016 – 2019
Figure-40: Japan – Forecast for Age group 25 – 34 years Food & Beverages Market (Million US$ ), 2020 – 2026
Figure-41: Japan – Age group 35 44 Years, Food & Beverages Market (Million US$), 2016 – 2019
Figure-42: Japan – Forecast for Age group 35 – 44 years Food & Beverages Market (Million US$), 2020 – 2026
Figure-43: Japan – Age group 45 – 54 years Food & Beverages Market (Million US$), 2016 – 2019
Figure-44: Japan – Forecast for age group 45 – 54 years Food & Beverages Market (Million US$), 2020 – 2026
Figure-45: Japan – Age group 55 – 64 Years Food & Beverage Market (Million US$), 2016 – 2019
Figure-46: Japan – Forecast for age group 55 – 64 User Food & Beverages Market (Million US$), 2020 – 2026
Figure-47: Japan – Male User Food & Beverages Market (Million US$), 2016 – 2019
Figure-48: Japan – Forecast for Male User Food & Beverage Market (Million US$), 2020 – 2026
Figure-49: Japan – Female User Food & Beverages Market (Million US4), 2016 – 2019
Figure-50: Japan – Forecast for Female User Food & Beverages Market (Million US$), 2020 – 2026
Figure-51: Japan – Low Income Food & Beverages Market (Million US$), 2016 – 2019
Figure-52: Japan – Forecasted for Food & Beverages Market (Million US$), 2020 – 2026
Figure-53: Japan – Medium Income Food & Beverages Market (Million US$), 2016 – 2019
Figure-54: Japan – Forecasted for Medium income in Food & Beverages Market (Million US$), 2020 – 2026
Figure-55: Japan – High Income Food & Beverages Market (Million US$), 2016 -2019
Figure-56: Japan – Forecast for High Income Food & Beverages Market (Million US$), 2020 – 2026
Figure-57: Japan – Online Food & Beverages Market (Million US$), 2016 -2019
Figure-58: Japan – Forecast for Offline Food & Beverages Market (Million US$), 2020 – 2026
Figure-59: Japan – Online Food & Beverages Market (Million US$), 2016 – 2019
Figure-60: Japan – Forecast for Online Food & Beverages Market (Million US$), 2020 – 2026
Figure-61: Global – Asahi Group Holdings Revenue (Million US$), 2015 - 2019
Figure-62: Global – Forecast for Asahi Group Holdings Revenue (Million US$), 2020 – 2026
Figure-63: Global – Hanwa Co., Ltd. Revenue (Million US$), 2015 - 2019
Figure-64: Global – Forecast for Hanwa Co., Ltd. Revenue (Million US$), 2020 – 2026
Figure-65: Global – Suntory Group Revenue (Million US$), 2015 - 2019
Figure-66: Global – Forecast for Suntory Group Market (Million US$), 2020 – 2026
Figure-67: Global – Meiji Holdings Co., Ltd. Revenue (Million US$), 2015 - 2019
Figure-68: Global – Forecast for Meiji Holdings Co., Ltd. Revenue (Million US$), 2020 – 2026
Figure-69: Global – Yamazaki Baking Co., Ltd. Revenue (Million US$), 2020 – 2026
Figure-70: Global – Forecast for Yamazaki Baking Co., Ltd. Revenue (Million US$), 2020 – 2026
Figure-71: Japan – Maruha Nichiro Corporation Revenue (Million US$), 2015-2019
Figure-72: Japan – Forecast for Maruha Nichiro Corporation Revenue (Million US$), 2020 – 2026
List of Tables:
Table-01: Japan – Food & Beverages Market Share by Products (Percentage) 2016 – 2019
Table-02: Japan – Forecast for Food & Beverages Market Share by Products (Percentage) 2020 – 2026
Table-03: Japan – Food & Beverages Market Share by Age group (Percentage) 2016 – 2019
Table-04: Japan – Forecast for Food & Beverages Market Share by Age Group (Percentage) 2020 – 2026
Table-05: Japan – Food & Beverages Market Share by Gender (Percentage) 2016 – 2019
Table-06: Japan – Forecast for Food & Beverages Market Share by Gender (Percentage) 2020 – 2026
Table-07: Japan – Food & Beverages Market Share by Income (Percentage) 2016 – 2019
Table-08: Japan – Forecast for Food & Beverages Market Share by Income (Percentage) 2020 – 2026
Table-09: Japan – Food & Beverages Market Share by Sels Channel (Percentage) 2016 – 2019
Table-10: Japan – Forecast for Food & Beverages Market Share by Sels Channel (Percentage) 2020 – 2026