Spain Hotel Market Size, Trends, Forecast 2025-2033
Buy NowSpain Hotel Market Size and Forecast 2025-2033
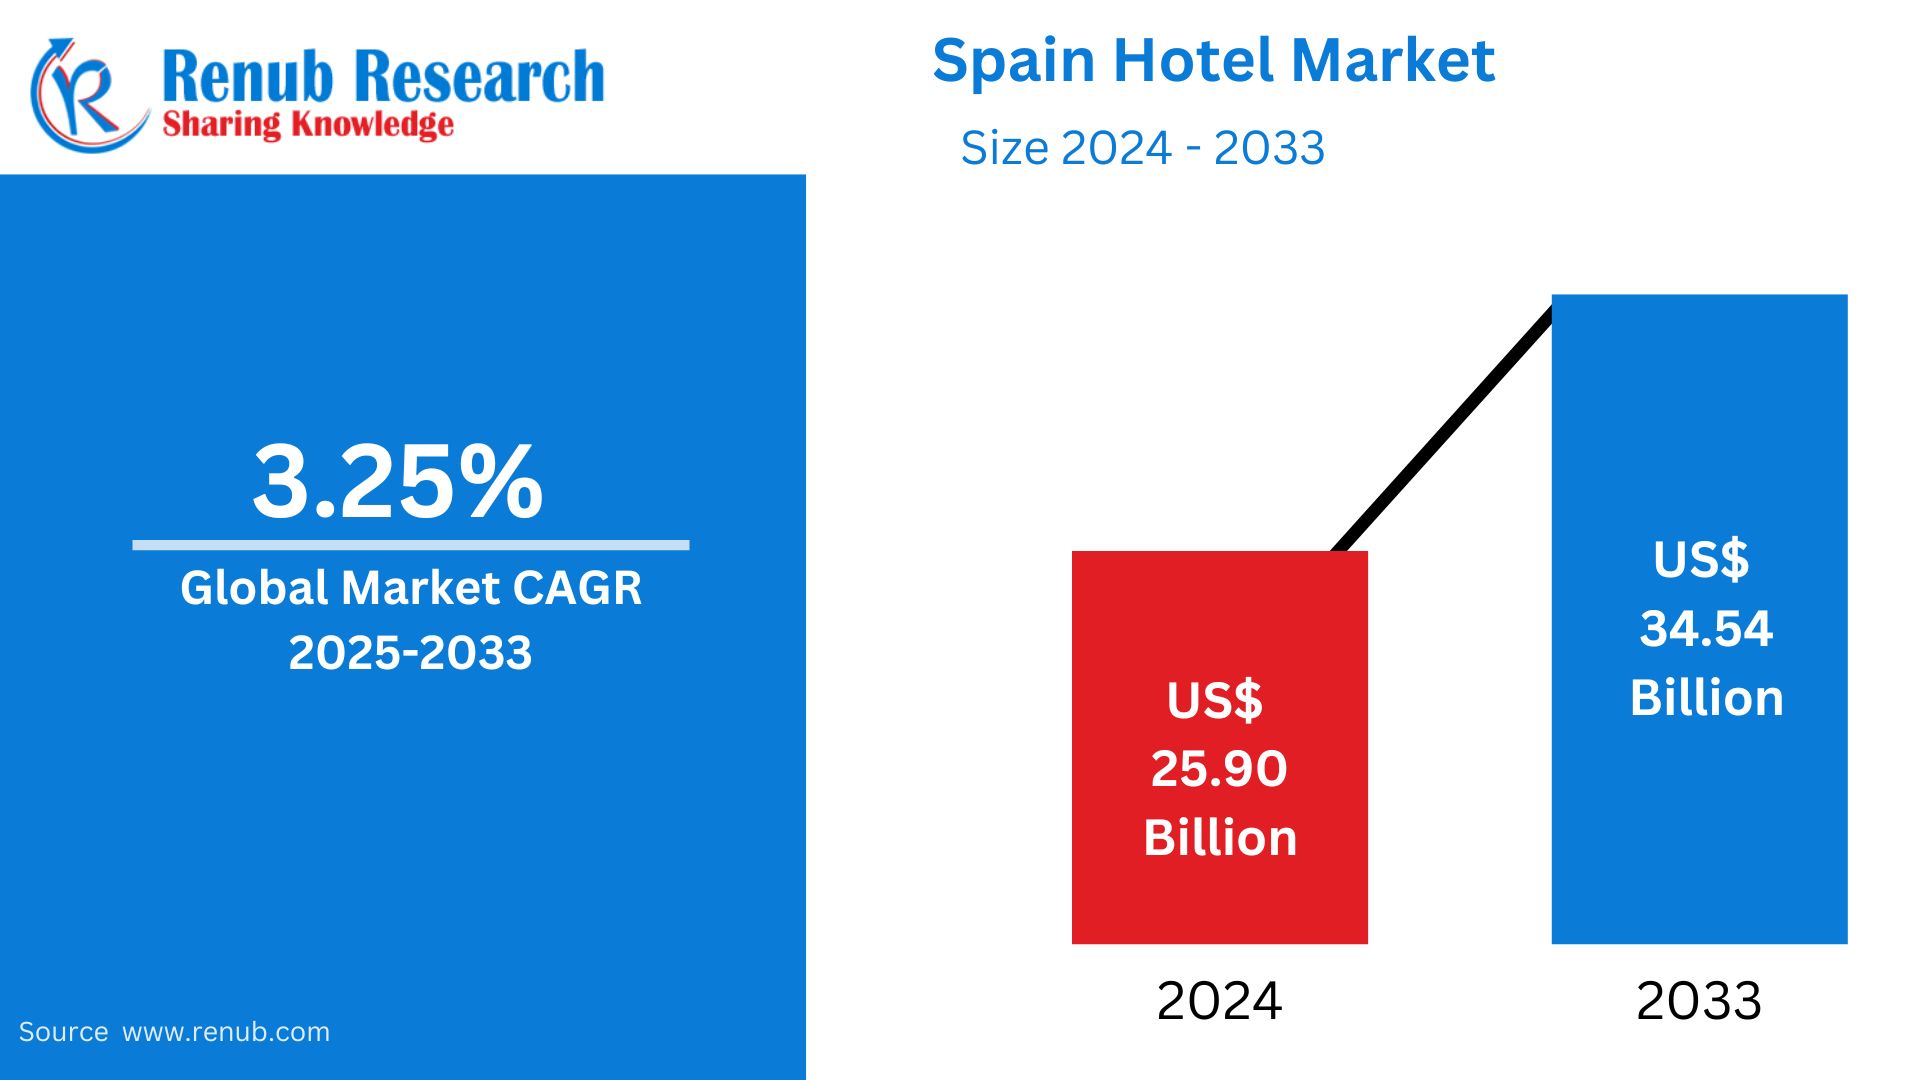
Spain Hotel Market is expected to reach US$ 34.54 billion by 2033 from US$ 25.90 billion in 2024, with a CAGR of 3.25% from 2025 to 2033. Strong cultural and historical attractions, expanding domestic travel, a pleasant climate, infrastructure expenditures, government assistance, and the appeal of coastal, urban, and rural locations are all factors contributing to Spain's hotel market's expansion.
Spain Hotel Market Report by Type (Economy, Midscale, Upscale & Upper-Upscale, Luxury), Business Model (Chain, Independent), Sales Channel (Offline, Online), Age Group (18-24 years, 25-34 years, 35-44 years, 45-54 years, 55-64 years), Gender (Male, Female), Star Rating (1 Star, 2 Star, 3 Star, 4 Star, 5 Star), Cities and Company Analysis 2025-2033
Overview of the Spain Hotel Industry
Spain has been a well-liked travel destination for tourists seeking life-altering experiences because of its diverse landscapes, intriguing history, and vibrant culture. The hotel industry in Spain has evolved to satisfy the needs and preferences of modern travelers as interest in visiting this enticing country grows. Spain's impeccable blend of modern luxury and old world charm has helped it establish itself as a leader in hospitality.
The nation's rich cultural legacy, historical sites, and Mediterranean beaches continue to make it a popular travel destination for millions of tourists each year. Demand is further increased by domestic travel habits, more foreign flights, and better transportation infrastructure. Spain's market is expanded by its varied appeal, which includes both seaside resorts and rural retreats in addition to vibrant cities like Madrid and Barcelona. Growing disposable incomes and government programs promoting travel and eco-friendly behaviors also play a role. The performance of the hotel industry as a whole is also being improved by Spain's post-pandemic recovery and growing interest in wellness, health, and environmentally responsible tourism.
Market Drivers and Opportunities in Spain’s Hospitality Sector
Infrastructure Development
Since infrastructure development improves accessibility and promotes more travel, it has emerged as a key growth engine for Spain's hotel industry. Expanding transportation networks, such as high-speed train systems, modernized airports, and better road infrastructure, facilitates access to Spain's most popular tourist attractions for both local and foreign visitors. Major airport expansions have increased the number of planes and tourists at cities like Madrid and Barcelona. Better connectivity has also helped regional destinations like Costa Brava and the Canary Islands, which have seen increases in hotel occupancy rates and longer stays.
In keeping with these changes, the market is further strengthened by the strategic distribution deal that Hotelbeds and Barceló signed in November 2023. Hotelbeds expands the reach of the luxury brand throughout Europe, the Mediterranean, and Africa by adding 130 Barceló hotels to its portfolio. In addition to increasing the selection of lodging options for tourists, our collaboration enhances Spain's standing as a top travel destination for both business and pleasure.
Growing Travel Industry
Spain's burgeoning tourist industry, which continues to rank among the most popular travel destinations globally, is the main driver of the country's hospitality economy. Spain continues to draw millions of tourists each year because of its rich cultural legacy, historical sites, and varied landscapes, which include everything from charming coastal regions and islands to energetic cities like Barcelona and Madrid. Strong domestic travel and a steady stream of foreign tourists have led to a high demand for a range of hospitality services, such as hotels, resorts, and vacation rentals. With the industry generating 18.66 billion euros following a very successful fourth quarter, the tourism sector contributed 12.8% of Spain's GDP. According to this figure, the majority of economic growth in 2023 came from tourism. The Spanish economy grew by 70.8%, or 2.4%, according to the Bank of Spain, while the GDP from tourism increased by 13.1%.
Increasing Government Assistance and Investment in Infrastructure
The Spanish government's continuous investment in tourism infrastructure and its pro-industry policies are driving significant market expansion. The competitiveness of Spain as a worldwide travel destination is bolstered by initiatives including expanding transportation networks, modernizing airport infrastructure, and improving the entire experience of tourists. Through these initiatives, marketing campaigns, and international trade agreements, Spain has established itself as a leader in the hospitality sector. For example, in March 2024, the government proposed a possible investment of Euro 2.4 billion (US$ 2.6 billion) for Spain's Adolfo Suárez-Madrid Barajas Airport, which would strengthen its position as Europe's main entry point to Latin America.
Challenges in the Spain Hotel Market
Seasonality
Since demand for hotels in Spain peaks in the summer, particularly in coastal and tourist-heavy locations, seasonality is a major concern. In the off-season, this results in erratic revenue sources and changing occupancy rates. In order to meet demand, hotels in these areas frequently turn to seasonal labor and promotions, which can be both financially and operationally problematic. These hotels also struggle to remain profitable throughout the year.
Sustainability Pressures
Spain's hotel industry faces sustainability difficulties as there is a growing demand for eco-friendly travel, which forces hotels to implement green measures including waste reduction and energy efficiency. But making the switch to sustainable operations can be expensive, particularly for smaller lodging establishments. Maintaining profitability in the face of growing operating costs is a delicate balance, and compliance with environmental standards and the requirement to invest in eco-friendly technologies can put additional financial strain on businesses.
Spain Hotel Overview by Cities
Madrid Hotel Market
Madrid's robust tourism and business travel industries are fueling the city's booming hotel industry. Particularly in neighborhoods like Gran Vía and Salamanca, luxury and boutique hotels predominate, providing upscale facilities and distinctive experiences. With an increasing need for eco-friendly and sustainable lodging options, budget and mid-range lodgings also serve a varied clientele. Occupancy rates have increased since the outbreak, and global chains are still growing. Demand is affected by seasonal variations, peaking in the spring and fall as a result of festivals and events.
Barcelona Hotel Market
Barcelona's hotel industry is thriving due to a significant influx of business and foreign visitors. The city offers a variety of lodging alternatives, ranging from modest establishments in the Gothic Quarter to opulent hotels in neighborhoods like the Eixample. With an increasing emphasis on sustainability and eco-friendly methods, the market serves a variety of demands and is well-liked for both leisure and conference travel. Due to its Mediterranean charm, cultural events, and festivals, spring and summer are usually the most sought-after seasons.
Spain Hotel Market Key Segments
Type
- High-End
- Mid-End
- Budget
Business Model
- Chain
- Independent
Sales Channel
- Offline
- Online
End User
- Leisure FIT & Group
- Corporate
- MICE
- Others
Age Group
- 18-24 years
- 25-34 years
- 35-44 years
- 45-54 years
- 55-64 years
Gender
- Male
- Female
Star Rating
- 1 Star
- 2 Star
- 3 Star
- 4 Star
- 5 Star
Regional Insights: Top Spanish Cities for Hotels
- Madrid
- Barcelona
- Palma
- Seville
- Valencia
- Granada
- Malaga
- Bilbao
- Alicante
- Cordoba
- San Sebastian
- Santiago de Compostela
- Santander
- Cadiz
All companies have been covered from 4 viewpoints:
- Company Overview
- Key Persons
- Recent Development
- Sales Analysis
Competitive Landscape and Key Players
- Marriott International Inc.
- Meliá Hotels International
- Barcelo Hotel Group
- NH Hotel Group
- TUI Hotels & Resorts
- Accor Hotels
- Wyndham hotels & resorts
- InterContinental Hotels Group
Report Details:
| Report Features | Details |
| Base Year |
2024 |
| Historical Period |
2021 - 2024 |
| Forecast Period |
2025 - 2033 |
| Market |
US$ Billion |
| Segment Covered |
By Type, By Business Model, By Sales Channel, By Age Group, By Gender, By Star Rating and By Cities |
| Countries Covered |
|
| Companies Covered |
|
| Customization Scope |
20% Free Customization |
| Post-Sale Analyst Support |
1 Year (52 Weeks) |
| Delivery Format |
PDF and Excel through Email (We can also provide the editable version of the report in PPT/Word format on request) |
Customization Services available
- Analysis of Market Size and Its Segments
- More Company Profiles (Upto 10 without any additional cost):
- Additional Countries (Other than mentioned Countries):
- Region/Country Specific Reports:
- Market Entry Strategy:
- Region-Specific Market Dynamics:
- Regional Market Share Analysis:
- Trade Analysis:
- Production Insights:
- Others Customized Requests:
For more information contact our analysts.
Need More Assistance?
- Talk to our analysts to get more precious information on the current market trends.
- Include more countries and segments and customize the report based on the final requirement.
- Get a competitive advantage in your industry by knowing the report findings and making a positive impact on your revenues and operations.
- Our analysts are always ready to provide more help and pertinent information if you need any additional assistance.