Global Next Generation Sequencing Market Size, Share & Forecast 2025–2033
Buy NowNext Generation Sequencing Market Forecast and Opportunities (2025–2033)
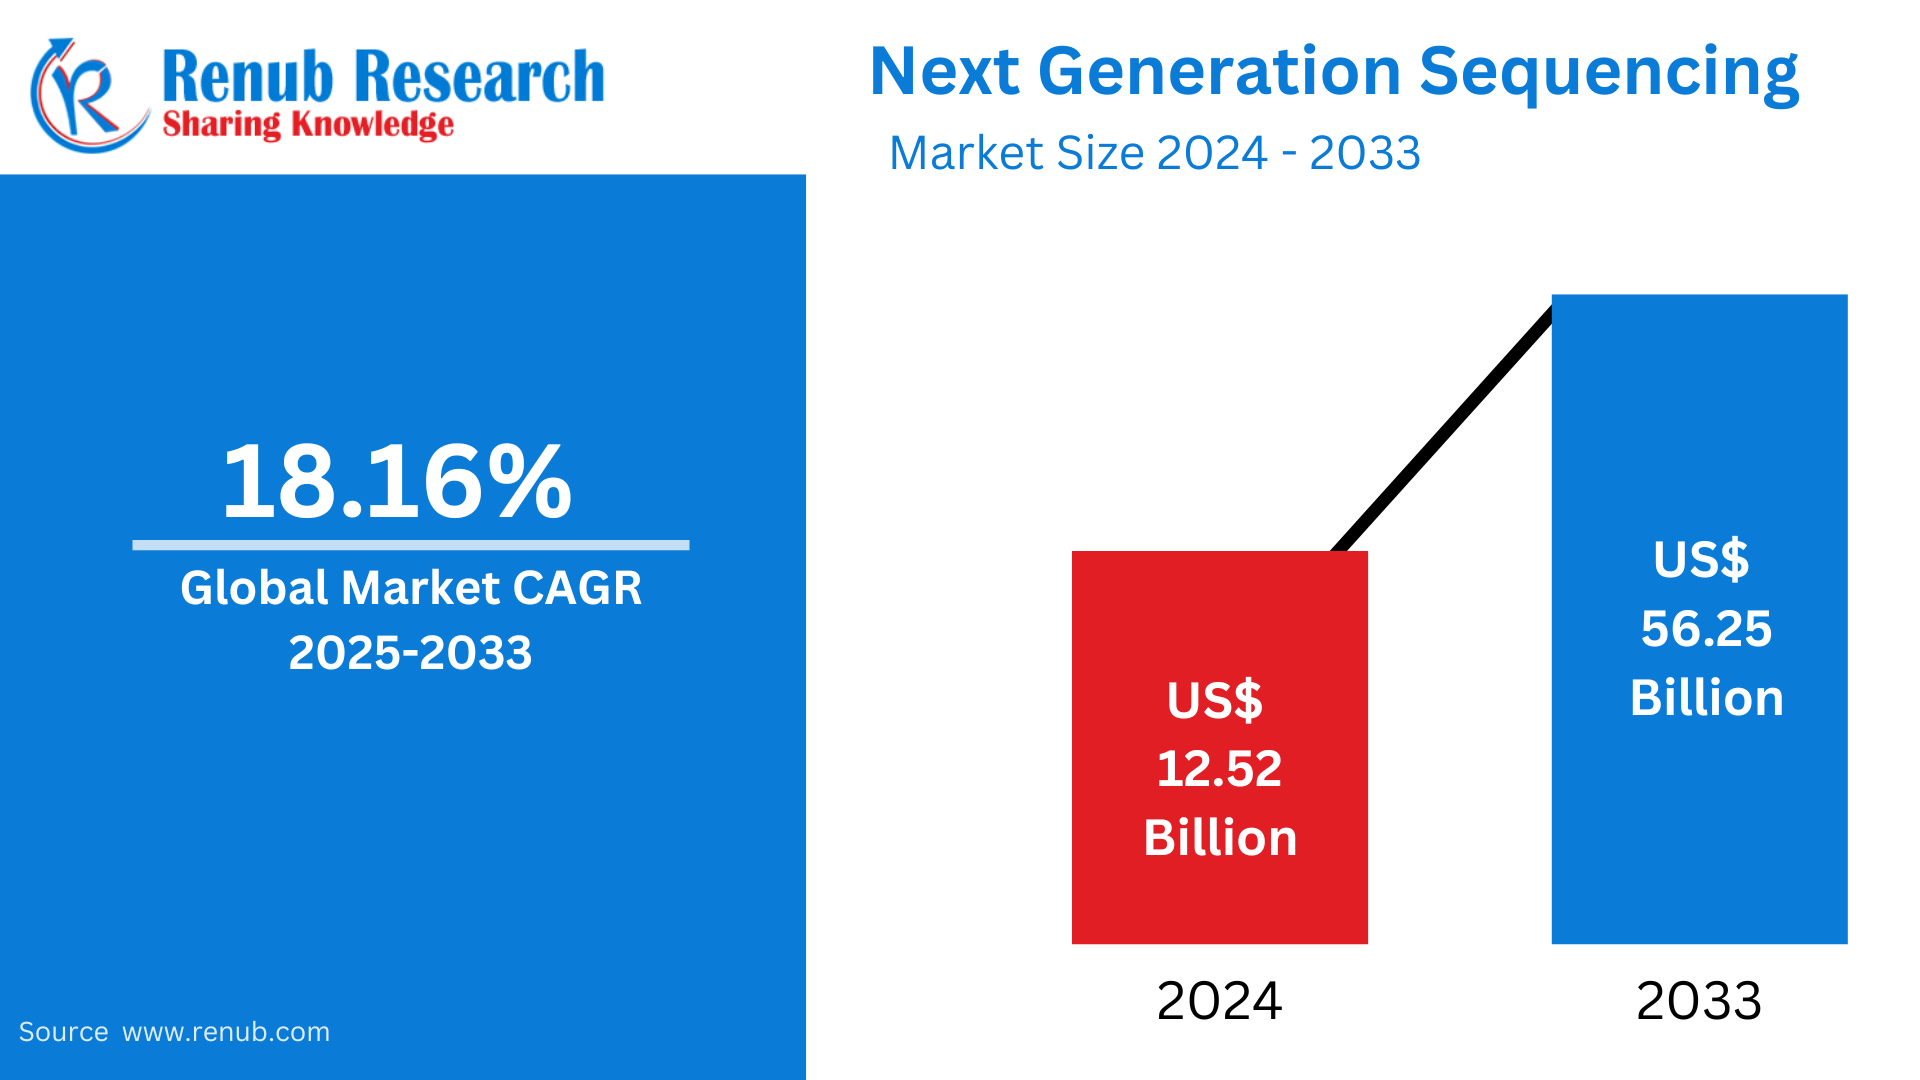
The global next-generation sequencing market is projected to reach US$ 56.25 billion by 2033, growing at a CAGR of 18.16% from 2025 to 2033. This growth is driven by advancements in genomic research, rising applications in precision medicine, and increasing adoption of NGS for disease diagnostics, oncology, and genetic testing. Technological innovations and decreasing sequencing costs further fuel the global market’s rapid expansion across healthcare and research sectors.
The report Next-Generation Sequencing Market & Forecast covers by Products (Instruments, Reagents & Consumables, and Services), Application (Diagnostics, Agriculture and Animal Research, Drug Discovery, Personalized Medicine and Genetic Screening), Technology (Sequencing by Synthesis, Ion Semiconductor, Single-Molecule Read Time, Nanopore), End-Users (Academic and Clinical Research Centers, Pharmaceutical and Biotechnology Companies, Hospitals and Clinics, and Others), Country and Company Analysis 2025-2033.
Next Generation Sequencing Market Overview
Next-generation sequencing (NGS) is an advanced DNA and RNA sequencing technology that enables rapid, accurate, and cost-effective analysis of genetic material. NGS surpasses traditional sequencing methods by allowing millions of fragments to be sequenced simultaneously, significantly reducing the time and cost of decoding entire genomes. This technology plays a vital role in understanding genetic variations, disease mechanisms, and biological processes at an unprecedented scale.
NGS has wide-ranging uses across healthcare, research, and agriculture. In clinical diagnostics, it is used to detect genetic mutations responsible for cancers, rare diseases, and inherited disorders. In precision medicine, NGS helps tailor treatments based on individual genetic profiles, improving patient outcomes. It is also used to identify pathogens and track outbreaks in infectious disease research. In research applications, NGS facilitates genomics, transcriptomics, and epigenomics studies. Additionally, it is valuable in agriculture for crop improvement and livestock genetics. With its versatility, NGS is revolutionizing the medicine, biology, and biotechnology industries worldwide.
Growth Drivers of the Global Next Generation Sequencing Market
Advancements in Genomic Research and Technology
The rapid advancements in genomic research and NGS technology are major market growth drivers. Innovations such as faster sequencing platforms, reduced costs per base pair, and improved accuracy are making NGS more accessible for research and clinical use. Technologies like single-cell sequencing, long-read sequencing, and automation enable scientists to study complex genomes and rare genetic mutations effectively. These advancements allow researchers to uncover new insights in oncology, rare disease diagnostics, and personalized medicine. As sequencing becomes more precise and affordable, its adoption expands across industries, driving significant growth in the global NGS market.
Rising Applications in Precision Medicine
The increasing demand for precision medicine is another key driver for the NGS market. By analyzing individual genetic profiles, NGS helps customize treatments, especially for cancer, genetic disorders, and infectious diseases. In oncology, NGS identifies specific genetic mutations, enabling targeted therapies that improve patient outcomes. This personalized approach to healthcare is transforming clinical decision-making, driving NGS adoption in diagnostics and treatment planning. Governments and healthcare providers worldwide invest heavily in precision medicine initiatives, further boosting NGS market growth. As more therapies become gene-driven, the demand for sequencing technologies will continue to rise.
Growing Prevalence of Genetic Disorders and Cancer
The rising incidence of genetic disorders and cancer globally is fueling demand for advanced diagnostic tools like NGS. Early detection and accurate diagnosis are critical for managing diseases such as cancer, cystic fibrosis, and rare inherited conditions. NGS allows comprehensive genetic analysis, providing insights into mutations that traditional methods cannot detect. This capability enhances early diagnosis and improves treatment outcomes. Additionally, NGS is widely used in cancer research to identify biomarkers for drug development and monitor therapy responses. As disease prevalence increases, healthcare providers are increasingly adopting NGS, driving the growth of the sequencing market worldwide.
Next-generation Reagents and consumables sequencing market
The reagents and consumables phase held one of the most significant shares in the global next-generation sequencing market. This, in particular, is attributed to the recurrent utilization and high demand for reagents and consumables in NGS's commercial and research applications. These consumables encompass sample preparation kits as well as kits for target enrichment. The adoption of NGS reagents and consumables has expanded as most pharmaceutical agencies and research institutes are utilizing NGS for several diagnostic programs and cancer studies.
Next Generation Sequencing Diagnostic Market
Diagnostic applications are pivotal in the global Next-Generation Sequencing (NGS) market due to their direct effect on healthcare. NGS's capability to research genetic versions enables precise disease prognosis, diagnosis, and personalized remedy selection. This section addresses important wishes in oncology, uncommon diseases, infectious illnesses, and prenatal screening, driving market increase. As healthcare structures prioritize precision medicine and genomic-pushed tactics, diagnostic applications become a cornerstone, contributing notably to the prominence and expansion of the global NGS market.
Next Generation Sequencing by Synthesis Market
Sequencing by synthesis (SBS) is one of the most famous technologies in the global Next-Generation Sequencing (NGS) market. This technology permits immediate and correct sequencing by constructing complementary DNA strands step by step. Its significant use is pushed through its capability to utilize vast quantities of data, produce low mistake rates, and be cost-effective, making it ideal for various programs in studies, diagnostics, and customized medicine. As the desire for big-scale genomic evaluation continues to develop, SBS will remain an important technology, expanding the worldwide NGS market in the coming years.
Academic and Clinical Research Centers Next Generation Sequencing Market
The academic and clinical research facilities segment is anticipated to be one of the quickest-growing segments within the market. This is due to the increasing use of next-generation sequencing (NGS) in cancer research. This technology enables the identification of new cancer-related genes, the examination of tumor heterogeneity, and the detection of alterations contributing to tumorigenesis. Also, providing scientific studies through market entities is predicted to offer ample opportunities for enhancing and detecting goals in this area.
United States Next-Generation Sequencing Market
The Next-Generation Sequencing market is expected to be led by the United States. This is due to the country's advanced healthcare infrastructure, robust research capabilities, and significant investments in genomics. The US has created a favorable environment for NGS adoption, supported by extensive funding, a solid regulatory framework, and a thriving biotechnology industry. Predicine, Inc. announced in September 2022 regarding the PredicineCARETMcfDNA Assay. This is an NGS assay used for tumor mutation profiling in cfDNA. The cfDNA is isolated from liquid biopsy samples taken from cancer patients. The US FDA has granted this assay breakthrough device designation. This ensures its prominent role and leadership in the global NGS market.
Germany's NGS Market Trends
The Germany Next-Generation Sequencing (NGS) market is experiencing significant growth, driven by advancements in genomic research, rising applications in personalized medicine, and increasing demand for precision diagnostics. NGS technology enables rapid and cost-effective sequencing of DNA and RNA, facilitating breakthroughs in oncology, rare disease detection, and genetic research. Government initiatives, healthcare infrastructure investments, and collaborations between research institutions and biotech companies further propel market expansion. The growing adoption of NGS for clinical diagnostics and pharmaceutical research positions Germany as a key player in Europe’s genomics landscape. The German NGS market is expected to grow with ongoing innovations.
India NGS Market Trends
The India Next-Generation Sequencing (NGS) market is expanding rapidly, driven by increasing demand for advanced genomic research, precision medicine, and cancer diagnostics. The rising prevalence of genetic disorders and oncology cases has accelerated the adoption of NGS technology in clinical and research applications. Government initiatives to promote biotechnology and growing investments in healthcare infrastructure are fueling market growth. NGS is also widely used in agriculture, pharmacogenomics, and infectious disease research. India’s growing pool of skilled researchers and partnerships with global genomics companies boost its market potential. The affordability and accessibility of NGS technologies will further strengthen India’s position in genomics.
UAE Next-Generation Sequencing Market
The UAE Next-Generation Sequencing (NGS) market is witnessing significant growth, driven by advancements in healthcare infrastructure, rising demand for precision medicine, and an increasing focus on genomic research. The UAE government’s initiatives to promote biotechnology and genomics, particularly in disease diagnostics and personalized treatment, are key growth drivers. NGS technology is widely adopted for cancer genomics, rare disease detection, and infectious disease research. Partnerships between global biotech companies and UAE healthcare institutions further accelerate market expansion. Additionally, growing investments in research and development, coupled with the country’s adoption of advanced healthcare technologies, position the UAE as a leading player in the NGS market in the Middle East.
Market Segmentation
Key Players
- Illumina, Thermo Fisher Scientific, Pacific Biosciences, QIAGEN N.V., Roche, Bio-Rad Laboratories, Inc., Takara Bio Inc., Hamilton Company, Geneious, and BioMérieux SA are the major companies in the global next-generation sequencing (NGS) market.
- In December 2023, Illumina inscribed a memorandum of understanding with the African Society for Laboratory Medicine to improve access to genomics within the African region to combat infectious diseases.
- In March 2023, the company SOPHiA GENETICS partnered with Qiagen to use QIAseq reagent technology with the DDM platform to improve tumor analysis using next-generation sequencing (NGS).
Product – Market breakup in 3 viewpoints:
- Instruments
- Reagents & Consumables
- Services
Application – Market breakup in 5 viewpoints:
- Diagnostics
- Agriculture and Animal Research
- Drug Discovery
- Personalized Medicine and Genetic Screening
- Others
Technology – Market breakup in 5 viewpoints:
- Sequencing by Synthesis
- Ion Semiconductor Sequencing
- Single-Molecule Read Time Sequencing
- Nanopore Sequencing
- Others
End-Users – Market breakup in 4 viewpoints:
- Academic and Clinical Research Centers
- Pharmaceutical and Biotechnology Companies
- Hospitals and Clinics
- Others
Regional Analysis
North America
- United States
- Canada
Europe
- France
- Germany
- Italy
- Spain
- United Kingdom
- Belgium
- Netherlands
- Turkey
Asia Pacific
- China
- Japan
- India
- South Korea
- Thailand
- Malaysia
- Indonesia
- Australia
- New Zealand
Latin America
- Brazil
- Mexico
- Argentina
Middle East & Africa
- Saudi Arabia
- United Arab Emirates
- South Africa
All the Key players have been covered from 3 Viewpoints:
• Overview
• Recent Development
• Revenue Analysis
Top Companies Analysis:
- Illumina
- Thermo Fisher Scientific
- Pacific Biosciences
- QIAGEN N.V.
- Roche
- Bio-Rad Laboratories, Inc.
- Takara Bio Inc.
- Hamilton Company
- Geneious
- BioMérieux SA
Report Details:
| Report Features | Details |
| Base Year |
2024 |
| Historical Period |
2020 - 2024 |
| Forecast Period |
2025 - 2033 |
| Market |
US$ Billion |
| Segment Covered |
Product, Application, Technology, End-User, and Countries |
| Countries Covered |
|
| Companies Covered | 1. Illumina 2. Thermo Fisher Scientific 3. Pacific Biosciences 4. QIAGEN N.V. 5. Roche 6. Bio-Rad Laboratories, Inc. 7. Takara Bio Inc. 8. Hamilton Company 9. Geneious 10. BioMérieux SA |
| Customization Scope |
20% Free Customization |
| Post-Sale Analyst Support |
1 Year (52 Weeks) |
| Delivery Format |
PDF and Excel through Email (We can also provide the editable version of the report in PPT/Word format on request) |
Customization Services available
- Analysis of Market Size and Its Segments
- More Company Profiles (Upto 10 without any additional cost):
- Additional Countries (Other than mentioned Countries):
- Region/Country Specific Reports:
- Market Entry Strategy:
- Region-Specific Market Dynamics:
- Regional Market Share Analysis:
- Trade Analysis:
- Production Insights:
- Others Customized Requests:
For more information contact our analysts.
Need More Assistance?
- Talk to our analysts to get more precious information on the current market trends.
- Include more countries and segments and customize the report based on the final requirement.
- Get a competitive advantage in your industry by knowing the report findings and making a positive impact on your revenues and operations.
- Our analysts are always ready to provide more help and pertinent information if you need any additional assistance.