Global Multiple Myeloma Market Size, Share, Trends & Forecast 2025-2033
Buy NowGlobal Multiple Myeloma Market Size and Forecast 2025-2033
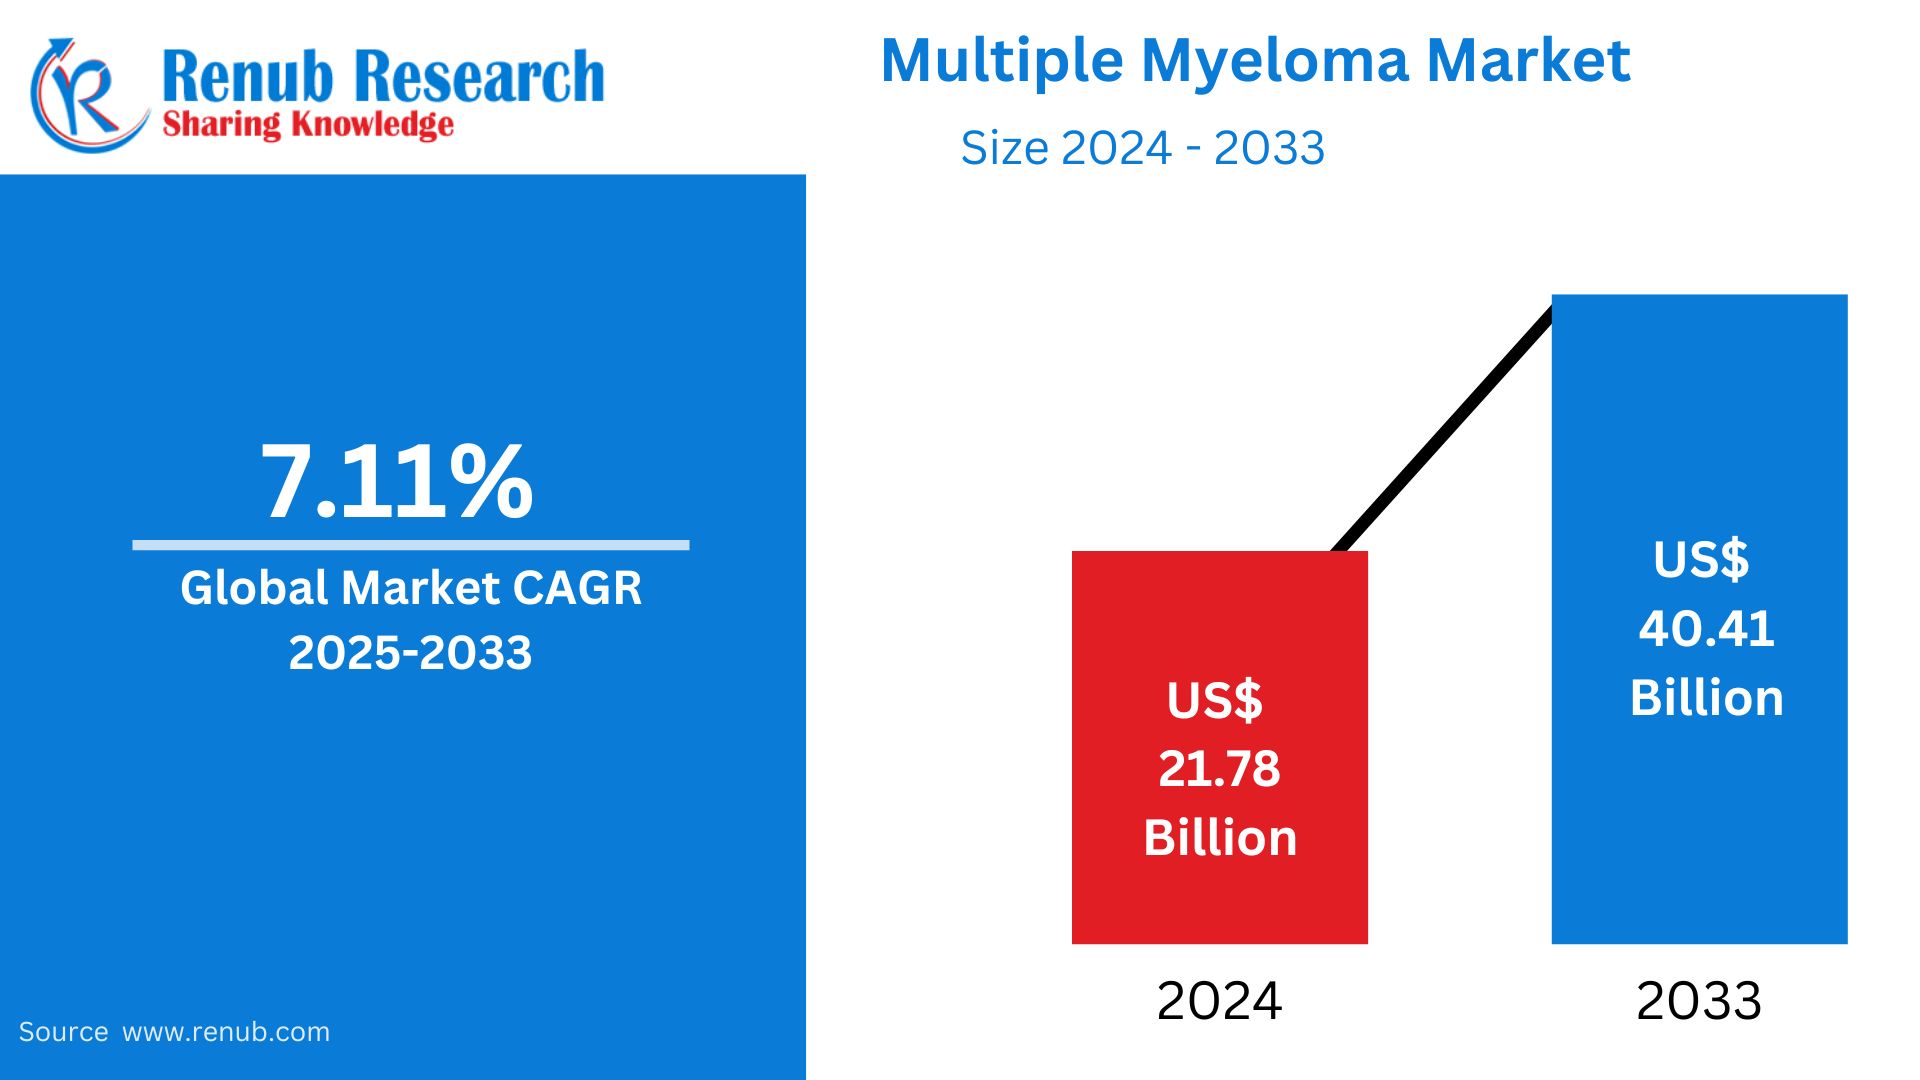
Global Multiple Myeloma Market was valued at USD 21.78 billion in 2024 and is expected to reach USD 40.41 billion by the year 2033, at a CAGR of 7.11% during the forecast period from 2025 to 2033. The growth of the market is fueled by the increasing number of multiple myeloma cases, developments in targeted therapies, and the expanding use of immunotherapies. Increased oncology research, enhanced diagnostic methodologies, and the increasing availability of healthcare facilities are further adding to market growth.
The report Global Multiple Myeloma Market & Forecast covers by Drugs Types (Chemotherapy, Protease Inhibitors, Monoclonal Antibody, Others) Disease Types (Active multiple myeloma, Smoldering multiple myeloma), End User (Hospitals, Clinics, Others), Countries and Company Analysis 2025-2033.
Introduction to the Multiple Myeloma Market
Multiple myeloma is a form of blood cancer that targets plasma cells, which are white blood cells in the bone marrow. The cancerous plasma cells grow in excess, causing bone weakening, kidney failure, anemia, and a compromised immune system. Multiple myeloma is prevalent in older individuals and is typically diagnosed using blood tests, bone marrow biopsies, and imaging scans.
The therapies for multiple myeloma are chemotherapy, immunotherapy, target therapies, corticosteroids, and stem cell transplants. Increasing advancements in monoclonal antibodies and CAR-T cell therapy are enhancing outcomes among patients, and these therapies are becoming more popular globally. With increasing awareness of cancer and better diagnosis methods, multiple myeloma therapies are becoming increasingly popular in the U.S., Europe, and Asia-Pacific. Pharmaceutical industries are heavily investing in new drug development, and governments are also funding cancer research, further propelling treatment availability. Consequently, the multiple myeloma market continues to grow, bringing new hope to patients worldwide.
Drivers of Growth in the Multiple Myeloma Market
Improvements in Targeted Therapies
The emergence of targeted therapies like monoclonal antibodies and proteasome inhibitors has considerably enhanced treatment efficacy for multiple myeloma patients. These treatments have greater efficacy with less side effect than conventional chemotherapy. With continued research in immunotherapy and CAR-T cell therapy, more effective therapies are being made available, and patient survival is on the rise. Consequently, drug companies are investing heavily in drug development, further fueling market growth. Dec 2024, Merck reported that the FDA has accepted for filing the Biologics License Application for clesrovimab (MK-1654), a long-acting monoclonal antibody to help protect infants from RSV in their first RSV season.
Increasing Prevalence of Multiple Myeloma
The worldwide prevalence of multiple myeloma is on the rise, especially among the elderly. Genetic susceptibility, exposure to toxic chemicals, and lifestyle changes are factors that lead to an increased incidence of the disease. As more and more cases are being diagnosed yearly, the need for effective treatment options is on the rise. This has driven governments and health organizations to invest more in multiple myeloma research and the availability of treatments, driving market growth. There were about 35,000 cases of MM in 2021 globally, with the most in China and Germany, with 47,003 and 32,010 cases, respectively. In 2021, Europe boasted the highest ASIR and ASPR, and North America the highest ASMR and DALYs.
Increasing Healthcare Spending and Awareness
Rising healthcare spending in developed and emerging economies is contributing positively towards the multiple myeloma market. Governments and private bodies are initiating awareness campaigns and screening programs to encourage early detection and timely treatment. Patients now enjoy improved access to new therapies through reimbursement schemes and insurance coverage, also driving the adoption of treatments. With increasing numbers of hospitals and clinics incorporating advanced oncology treatments, the multiple myeloma market is set to see significant growth.
Issues in the Multiple Myeloma Market
Exorbitant Cost of Therapy
Immunotherapies and targeted agents used in treating multiple myeloma are costly, hence unavailable to most patients, particularly those in developing areas. Bone marrow transplants and maintenance therapy costs further increase the burden. In spite of availability of reimbursement schemes in certain countries, affordability becomes a serious concern, limiting the growth of the market.
Side Effects and Therapy Resistance
In spite of the progress in treatment, patients tend to develop resistance to current therapies with time, which requires frequent modification of treatment regimens. Moreover, most therapies have serious side effects, such as infections, tiredness, and organ injury, which lower the quality of life for patients. These issues propel the necessity for ongoing research and innovation in treatment methods.
Chemotherapy Multiple Myeloma Market
Chemotherapy has long been a conventional form of treatment for multiple myeloma and is usually given in conjunction with other therapies. Chemotherapy kills cancer cells that are dividing rapidly and is usually given before stem cell transplantation. Although chemotherapy continues to play an essential role in treatment regimens, its use is diminishing with the emergence of more targeted and less toxic therapy. Nonetheless, in areas where newer therapies are not easily available, chemotherapy is an important mode of treatment.
Active Multiple Myeloma Market
Active multiple myeloma is when the disease has reached beyond the smoldering phase, and symptoms like bone damage, kidney impairment, and anemia occur. Active multiple myeloma treatment includes a combination of chemotherapy, targeted therapy, and stem cell transplantation. Due to early diagnosis and enhanced treatment protocols, patients with active multiple myeloma are seeing improved survival rates, which are driving the market forward.
Smoldering Multiple Myeloma Market
Smoldering multiple myeloma is an early phase of the disease that is not yet symptomatic but can potentially evolve into active multiple myeloma. Patients are typically followed up with routine check-ups instead of receiving immediate treatment. Clinical trials are, however, investigating early intervention therapies with immunomodulatory drugs and targeted therapy to postpone disease progression. As recognition of smoldering multiple myeloma increases, more patients are signing up for surveillance programs, increasing this market segment. Multiple Myeloma Hospitals Market
Hospitals become very important centers for the care of multiple myeloma since they offer treatment access to leading-edge therapies, stem cell transplantations, and advanced oncology care. World-class hospitals worldwide are incorporating groundbreaking treatment options including CAR-T cell therapy, monoclonal antibodies, and targeted precision medicine tactics. With continuous hospital investment in oncology infrastructure and specialized units for cancer treatment, the incidence of multiple myeloma procedures in hospitals continues to grow.
Multiple Myeloma Clinics Market
Specialized oncology clinics provide outpatient treatments to multiple myeloma patients, including chemotherapy, targeted therapy, and supportive care. Outpatient treatment in specialized oncology clinics is increasingly popular because it provides a convenient and cost-effective solution compared to hospital-based treatment. As cancer treatment centers and specialty hematology clinics expand, multiple myeloma care becomes more accessible, particularly in developed countries.
USA Multiple Myeloma Market
The USA possesses the most developed multiple myeloma market, attributed to excellent healthcare infrastructure, maximum research investment, and the stronghold of prominent drug manufacturers. The prevalence of immunotherapies and personalized therapies has transformed patient care radically. Insurance provisions and government assistance support patients' access to high-cost treatment and facilitate sustained growth in the market. nsplant. In March 2024, Johnson & Johnson reported that the US FDA Oncologic Drugs Advisory Committee voted to recommend CARVYKTI for adult patients with Relapsed/Refractory Multiple Myeloma who have received one or more prior therapies, including a proteasome inhibitor and an IMiD, and are refractory to lenalidomide.
France Multiple Myeloma Market
In France, technological advancements in precision medicine and government-sponsored healthcare programs are driving the multiple myeloma market. The country has several cancer research centers focusing on innovative therapies and early detection strategies. Access to high-quality treatment through a universal healthcare system ensures that patients receive optimal care, driving market growth in the region. March 2024, Bristol Myers Squibb has announced that the European Commission approved Abecma® (idecabtagene vicleucel; ide-cel) for the treatment of adult patients with relapsed and refractory multiple myeloma who have received at least two previous treatments, including an immunomodulatory agent, a proteasome inhibitor, and an anti-CD38 antibody, and demonstrated disease progression on their previous treatment.
India Multiple Myeloma Market
India's multiple myeloma market is expanding as a result of growing cancer awareness, enhanced diagnostic strength, and the development of healthcare infrastructure. Treatment costs are high, though, and this has been a limitation in making newer therapies accessible to most patients. Government programs and pharma alliances are striving to make treatment affordable, and this is helping drive steady market growth. March 2025: The Postgraduate Institute of Medical Education and Research (PGI) will soon initiate clinical trials for CAR T-cell therapy in patients with multiple myeloma. This project, a part of a nationwide study, provides new hope to those battling this tough disease. PGI's ethics committee has given approval for the trials, thus becoming a site of prime concern for this multi-centric research.
Saudi Arabia Multiple Myeloma Market
Saudi Arabia is experiencing growing investments in the treatment of cancer, with fresh oncology centers and hospitals under construction throughout the country. Improvement in healthcare service and increasing coverage under insurance offered by the government is increasing access to better treatment for multiple myeloma in patients. Escalating incidents of cancer as well as expanding research partnerships are the most influencing factors in growing the market for this region. May 2024, Kite, a Gilead Company, and Arcellx intend to initiate a Phase III clinical trial of anitocabtagene autoleucel (anito-cel) for the treatment of multiple myeloma.vAnito-cel is a BCMA CAR T-cell therapy, one of the companies' operational updates on their partnered programme.
Multiple Myeloma Market Segments
Drugs Types
- Chemotherapy
- Protease Inhibitors
- Monoclonal Antibody
- Others
Disease Types
- Active multiple myeloma
- Smoldering multiple myeloma
End User
- Hospitals
- Clinics
- Others
Regional Insights:
North America
- United States
- Canada
Europe
- France
- Germany
- Italy
- Spain
- United Kingdom
- Belgium
- Netherlands
- Turkey
Asia Pacific
- China
- Japan
- India
- Australia
- South Korea
- Thailand
- Malaysia
- Indonesia
- New Zealand
Latin America
- Brazil
- Mexico
- Argentina
Middle East & Africa
- South Africa
- Saudi Arabia
- UAE
All the Key players have been covered from 4 Viewpoints:
- Overviews
- Key Person
- Recent Developments
- Product Portfolio
- Revenue
Competitive Landscape and Key Players
- Novartis AG
- Abbvie Inc.
- Sanofi
- Johnson and Johnson
- Baxter International Inc.
- Pfizer Inc.
- Takeda Pharmaceutical Company Ltd
- Bristol-Myers Squibb Company
Report Details:
| Report Features | Details |
| Base Year |
2024 |
| Historical Period |
2021 - 2024 |
| Forecast Period |
2025 - 2033 |
| Market |
US$ Billion |
| Segment Covered |
Drugs Type, Disease Type, End User and Countries |
| Countries Covered |
|
| Companies Covered |
|
| Customization Scope |
20% Free Customization |
| Post-Sale Analyst Support |
1 Year (52 Weeks) |
| Delivery Format |
PDF and Excel through Email (We can also provide the editable version of the report in PPT/Word format on request) |
Customization Services available
- Analysis of Market Size and Its Segments
- More Company Profiles (Upto 10 without any additional cost):
- Additional Countries (Other than mentioned Countries):
- Region/Country Specific Reports:
- Market Entry Strategy:
- Region-Specific Market Dynamics:
- Regional Market Share Analysis:
- Trade Analysis:
- Production Insights:
- Others Customized Requests:
For more information contact our analysts.
Need More Assistance?
- Talk to our analysts to get more precious information on the current market trends.
- Include more countries and segments and customize the report based on the final requirement.
- Get a competitive advantage in your industry by knowing the report findings and making a positive impact on your revenues and operations.
- Our analysts are always ready to provide more help and pertinent information if you need any additional assistance.