
")
Electric Bus Market, Volume Global Analysis by Types (Battery Electric e-bus & Plug-in Hybrid e-bus) Regions (China, Europe, Nordics, United States, India) Company (Yutong, BYD, Proterra Inc.)
Get Free Customization in This Report
Electric Bus Market is expected to surpass USD 400 Billion by the year 2024. China is gaining high prominence in developing electric bus over rest of the world. The e-bus is comparatively new discovery than electric car and electric bike but, now every country is talking about battery powered bus with great interest. The governments of many countries understand that electric bus will transform the city transport, where many cities across the world are facing severe air pollution. According to Renub Research, e-bus has great potential to change and reshape the whole transportation industry.
The major growth driver of electric bus market is pro government support. Climate change is one of the big concerns across the world and government of many countries set their national target to mitigate the carbon emission to control the air pollution. Electric bus will transform the city transport and shift from conventional energy to environmental friendly energy.
In this report we have done in-depth analysis of pilot project, demonstration project, technology testing, and operational efficiency testing project of different electric bus models developed by major manufacturer across the world. We have covered almost 90 cities of Europe and Nordics to provide clear picture of current electric bus adoption by government and independent agencies.
Request a free sample copy of the report: https://www.renub.com/contactus.php
Renub Research study titled “Electric Bus Market, Volume Global Analysis by Types (Battery Electric e-bus & Plug-in Hybrid e-bus) Regions (China, Europe, Nordics, United States, India) Company (Yutong, BYD, Proterra Inc.)" provides a comprehensive assessment of the fast–evolving, high–growth electric bus market. This report studies separate sales analysis of manufacturer: BYD, Yutong and Proterra Inc. This report consists of analysis of technological development, model launched and strategy toward future development. This market research report studies the Global Electric Bus market from 7 view points:
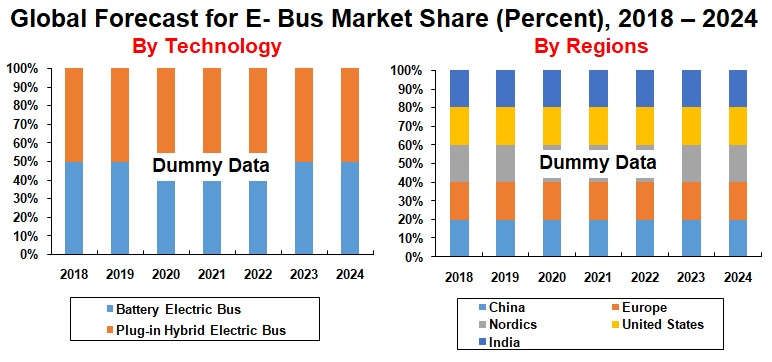
Battery Electric Bus controls the Electric Bus Market
This report studies the market of both the segments Battery Electric Bus and Plug-in hybrid Electric Bus. This report provides the comprehensive insight of e-bus technology, the stock of e-bus by country and regions and their respective market. We have also fragmented the market of electric bus into five regions; China, Europe, Nordic, United States and India.
Client can purchase this report in sections through Purchase by Chapter Tab given above
The report has been studied from the following 7 points
1) Market and Forecast
2) Market Share and Forecast
3) Volume Share and Forecast
4) By Technological Segment (PHEV and BEV) Market and Forecast
5) By Technological Segment (PHEV and BEV) Volume and Forecast
6) Electric Bus Market by Regions
7) Electric Bus Volume by Regions
Key Companies covered in the report are as follows
1. Yutong
2. BYD
3. Proterra Inc
Regions - Battery Electric Bus (BEB) Market
• China
• Europe
• Nordics
• United States
• India
Regions - Plug-in Hybrid Electric Bus Market
• China
• Europe
• Nordics
• United States
• India
If the information you seek is not included in the current scope of the study kindly share your specific requirements with our custom research team at info@renub.com
1. Executive Summary
2. Global Electric Bus Market
3. Global Electric Bus Volume
4. Market Share – Global E-Bus
4.1 By Technology (PHEV, BEV)
4.2 By Regions
5. Volume Share – Global Electric Bus
5.1 By Regions
6. China Electric Bus Analysis
6.1 Electric Bus Market
6.1.1 China Battery Electric Bus (BEB) Market
6.1.2 China Plug-in Hybrid Electric Bus (PHEB) Market
6.2 Electric Bus Volume
6.2.1 China Battery Electric Bus (BEB) Volume
6.2.2 China Plug-in Hybrid Electric Bus (PHEB) Volume
6.3 Charging Infrastructure
6.4 Major E-Bus Manufacturers in China
6.5 Government Initiatives and Subsidies Plan
7. Europe E-Bus Analysis
7.1 Electric Bus Market
7.1.1 Europe Battery Electric Bus (BEB) Market
7.1.2 Europe Plug-in Hybrid Electric Bus (PHEB) Market
7.2 Electric Bus Volume
7.2.1 Europe Battery Electric Bus (BEB) Volume
7.2.2 Europe Plug-in Hybrid Electric Bus (PHEB) Volume
7.3 Country – Electric Bus Operational Project in their Respective Cities
7.3.1 Austria
7.3.2 Belgium
7.3.3 Czech Republic
7.3.4 France
7.3.5 Germany
7.3.6 Hungary
7.3.7 Italy
7.3.8 Netherlands
7.3.9 Poland
7.3.10 Spain
7.3.11 Switzerland
7.3.12 United Kingdom
7.4 Charging Infrastructure of E-Bus by Companies
7.4.1 ABB
7.4.2 BOMBARDIER PRIMOVE GMBH
7.4.3 EKOENERGETYKA-POLSKA
7.4.4 Heliox Automotive Bv
7.4.5 Jema Energy
7.4.6 Powerdale Nv
7.4.7 Schunk Carbon Technology
7.4.8 Siemens
7.5 Government Initiatives and Subsidies Plan
8. NORDICS Electric Bus Analysis
8.1 E-Bus Market
8.2 E-Bus Volume
8.3 NORDICS – E-Bus Operational Project and their Respective Cities
8.3.1 Denmark
8.3.2 Finland
8.3.3 Sweden
8.3.4 Norway
8.4 E-Bus Charging Infrastructure
8.4.1 Slow EVSE
8.4.2 Fast EVSE
8.5 Government Initiatives and Subsidies Plan
9. United States Electric Bus Analysis
9.1 Electric Bus Market
9.2 Electric Bus Volume
9.3 Charging Infrastructure
9.4 Government Initiatives and Subsidies
10. India Electric Bus Analysis
10.1 Electric Bus Market
10.2 Electric Bus Volume
10.3 Charging Infrastructure
10.4 Government Initiatives and Subsidies
11. Major Electric Bus Manufacturers
11.1 Yutong
11.1.1 Company Overview
11.1.2 Company Sales
11.2 BYD
11.2.1 Company Overview
11.2.2 Company Sales
11.3 Proterra
11.3.1 Company Overview
11.3.2 Company Sales
12. Growth Drivers
12.1 Price of Lithium-ion Battery Packs Driving Down Costs
12.2 Environment Friendly
13. Key Challenges
List of Figures:
Figure 2‑1: Global- E- Bus Market (Million US$), 2011 – 2017
Figure 2‑2: Global- Forecast for E- Bus Market (Million US$), 2018 – 2024
Figure 3‑1: Global- E- Bus Volume (Number), 2011 – 2017
Figure 3‑2: Global- Forecast for E- Bus Volume (Number), 2018 – 2024
Figure 4‑1: Global- E- Bus Market Share by Technology (Percent), 2015 – 2017
Figure 4‑2: Global- Forecast for E- Bus Market Share by Technology (Percent), 2018 – 2024
Figure 4‑3: Global- Forecast for E- Bus Market Share by Regions (Percent), 2018 – 2024
Figure 4‑4: Global- Forecast for E- Bus Volume Share by Regions (Percent), 2018 – 2024
Figure 5‑1: China- E- Bus Market (Million US$), 2011 – 2017
Figure 5‑2: China- Forecast for E- Bus Market (Million US$), 2018 – 2024
Figure 5‑3: China- Battery Electric Bus (BEB) Market (Million US$), 2011 – 2017
Figure 5‑4: China- Forecast for Battery Electric Bus (BEV) Market (Million US$), 2018 – 2024
Figure 5‑5: China- Plug-in Hybrid Electric Bus (PHEB) Market (Million US$), 2011 – 2017
Figure 5‑6: China- Forecast for Plug-in Hybrid Electric Vehicle (PHEV) Market (Million US$), 2018 – 2024
Figure 5‑7: China- E- Bus Volume (Number), 2011 – 2017
Figure 5‑8: China- Forecast for E- Bus Volume (Number), 2018 – 2024
Figure 5‑9: China- Battery Electric Bus (BEB) Volume (Number), 2011 – 2017
Figure 5‑10: China- Forecast for Battery Electric Bus (BEB) Volume (Number), 2018 – 2024
Figure 5‑11: China- Plug-in Hybrid Electric Bus (PHEB) Volume (Number), 2011 – 2017
Figure 5‑12: China- Forecast for Plug-in Hybrid Electric Bus (PHEB) Volume (Number), 2018 – 2024
Figure 5‑13: China – Share of Charging Technology (Percent), 2017
Figure 5‑14: China – Electric Bus Manufacturer Share (Percent), 2015
Figure 5‑15: China – Electric Bus Manufacturer Share (Percent), 2016
Figure 6‑1: Europe- Electric Bus Market (Million US$), 2015 – 2017
Figure 6‑2: Europe- Forecast for Electric Bus Market (Million US$), 2018 – 2024
Figure 6‑3: Europe- Battery Electric Bus (BEB) Market (Million US$), 2015 – 2017
Figure 6‑4: Europe- Forecast for Battery Electric Bus (BEB) Market (Million US$), 2018 – 2024
Figure 6‑5: Europe- Plug-in Hybrid Electric Bus (PHEB) Market (Million US$), 2015 – 2017
Figure 6‑6: Europe- Forecast for Plug-in Hybrid Electric Bus (PHEB) Market (Million US$), 2018 – 2024
Figure 6‑7: Europe – Electric Bus Volume (Number), 2015 – 2017
Figure 6‑8: Europe – Forecast for Electric Bus Volume (Number), 2018 – 2024
Figure 6‑9: Europe- Battery Electric Bus (BEB) Volume (Number), 2015 – 2017
Figure 6‑10: Europe- Forecast for Battery Electric Bus (BEB) Volume (Number), 2018 – 2024
Figure 6‑11: Europe- Plug-in Hybrid Electric Bus (PHEB) Volume (Number), 2015 – 2017
Figure 6‑12: Europe- Forecast for Plug-in Hybrid Electric Bus (PHEB) Volume (Number), 2018 – 2024
Figure 7‑1: NORDIC- Forecast for Electric Bus Market (Million US$), 2018 - 2024
Figure 7‑2: NORDIC- Forecast for Electric Bus Volume (Number), 2018 - 2024
Figure 8‑1: United States – Electric Bus Market (Million US$), 2015 – 2017
Figure 8‑2: United States – Forecast for Electric Bus Market (Million US$), 2018 – 2024
Figure 8‑3: United States – Electric Bus Volume (Number), 2015 – 2017
Figure 8‑4: United States – Forecast for Electric Bus Volume (Number), 2018 – 2024
Figure 9‑1: India – Forecast for Electric Bus Market (Million US$), 2018 – 2024
Figure 9‑2: India – Forecast for Electric Bus Volume (Number), 2018 – 2024
Figure 10‑1: Global- Yutong Electric Bus Sales (Number), 2014 – 2017
Figure 10‑2: Global- Forecast for Yutong Electric Bus Sales (Number), 2018 – 2024
Figure 10‑3: Global- BYD Electric Bus Sales (Number), 2014 – 2017
Figure 10‑4: Global- Forecast for BYD Electric Bus Sales (Number), 2018 – 2024
Figure 10‑5: Global- Proterra Inc Electric Bus Sales (Number), 2015 – 2017
Figure 10‑6: Global- Forecast for Proterra Inc Electric Bus Sales (Number), 2018 – 2024
Figure 11‑1: Price of Lithium-ion Battery Packs Driving Down Costs
List of Tables:
Table 4‑1: Global- E- Bus Market Share by Regions (Percent), 2017
Table 4‑2: Global- E- Bus Volume Share by Regions (Percent), 2017
Table 5‑1: China - Publicly Accessible Charger Stock, (Number), 2014 – 2016
Table 6‑1: Austria – Electric bus Projects by Cities
Table 6‑2: Belgium – Electric bus Projects by Cities
Table 6‑3: Czech Republic – Electric bus Projects by Cities
Table 6‑4: France – Electric bus Projects by Cities
Table 6‑5: Germany – Electric bus Projects by Cities
Table 6‑6: Hungary – Electric bus Projects by Cities
Table 6‑7: Italy – Electric bus Projects by Cities
Table 6‑8: Netherlands – Electric bus Projects by Cities
Table 6‑9: Poland – Electric bus Projects by Cities
Table 6‑10: Spain – Electric bus Projects by Cities
Table 6‑11: Switzerland – Electric bus Projects by Cities
Table 6‑12: United Kingdom – Electric bus Projects by Cities
Table 6‑13: ABB- Charging Infrastructure of E- Bus
Table 6‑14: BOMBARDIER PRIMOVE GMBH - Charging Infrastructure of E- Bus
Table 6‑15: EKOENERGETYKA-POLSKA - Charging Infrastructure of E- Bus
Table 6‑16: HELIOX AUTOMOTIVE BV - Charging Infrastructure of E- Bus
Table 6‑17: JEMA ENERGY - Charging Infrastructure of E- Bus
Table 6‑18: POWERDALE NV - Charging Infrastructure of E- Bus
Table 6‑19: SCHUNK CARBON TECHNOLOGY - Charging Infrastructure of E- Bus
Table 6‑20: SIEMENS - Charging Infrastructure of E- Bus
Table 7‑1: NORDIC- Electric Bus Market (Million US$), 2017
Table 7‑2: NORDIC- Electric Bus Volume (Number), 2017
Table 7‑3: Denmark – Electric bus Projects by Cities
Table 7‑4: Finland – Electric bus Projects by Cities
Table 7‑5: Sweden – Electric bus Projects by Cities
Table 7‑6: Norway – Electric bus Projects by Cities
Table 7‑7: Nordics - Publicly accessible slow EVSE stock by country, 2011 – 17
Table 7‑8: Nordic - Publicly accessible Fast EVSE stock by country, 2011 – 17
Table 8‑1: United States – Charging Infrastructure
Table 9‑1: India –Electric Bus Market (Million US$), 2017
Table 9‑2: India –Electric Bus Volume (Number), 2017
Table 9‑3: India – Charging Infrastructure
Table 9‑4: India – Manufacturer of Electric Buses
Reach out to us
Call us on
USA: +1-678-302-0700
INDIA: +91-120-421-9822
Drop us an email at
info@renub.com