
")
China Hotel Market, Size, Forecast 2023-2028, Industry Trends, Growth, Share, Outlook, Impact of Inflation, Opportunity Company Analysis
China Hotel Market Outlook
China Hotel Market is anticipated to be US$ 166.02 Billion by 2028, according to Renub Research. China hotel market is flourishing with strong economic growth and rising tourism. Increased travel demand from the middle class and higher disposable income has led to more hotel construction and investment. Government initiatives like the Belt and Road Initiative and special economic zones attract travellers, while online platforms make hotel reservations more accessible.
Hosting major international events drives infrastructure development and hotel investments. The market diversifies with new hotel brands catering to consumer preferences. With positive economic prospects and government support, the China hotel market is set for further expansion driven by increasing travellers, infrastructure development, and hotel chain expansion.
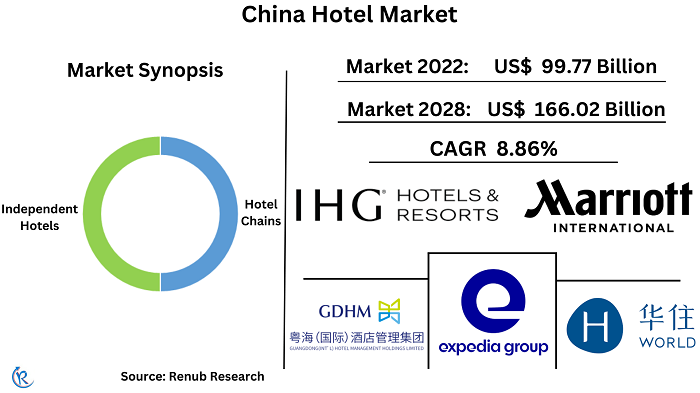
China Hotel Market is expected to expand at a CAGR of 8.86% from 2022 to 2030
The growth of the China hotel market is propelled by the creation of opportunities for businesses and investors. The demand for hotels with a range of amenities and services, such as Wi-Fi, fitness centers, and restaurants, has led to increased hotel construction in Tier 1 and Tier 2 cities. The expansion of the MICE (Meetings, Incentives, Conferences, and Exhibitions) market in China presents opportunities for businesses to host events and for investors to invest in hotels.
China's growing importance as a global business destination has contributed to the rise in MICE events and the demand for hotel accommodations. The rapid growth of the online travel market in China has increased the number of online bookings for MICE events and hotel accommodations. The booming Chinese tourism industry has further driven the demand for hotel accommodations in popular tourist destinations.
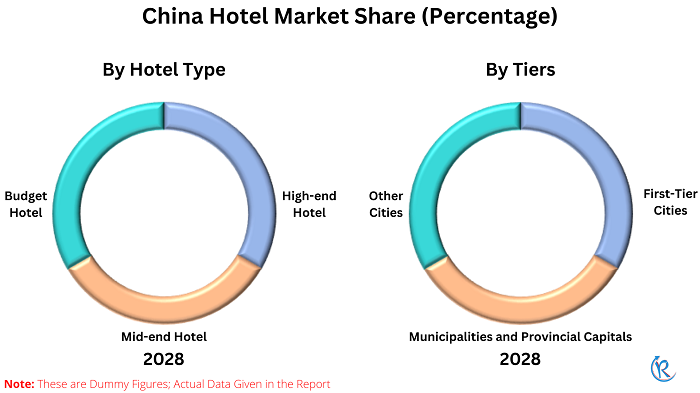
Mid-range hotels will continue to remain popular in the China hotel market in the coming years
High-end hotel, Mid-end hotel, and Budget hotel are the types in the China hotel market. Mid-range hotels in the China hotel market dominate due to their wide appeal to business travellers, tourists, and budget-conscious individuals, capturing a significant market share. They offer a balance of affordability and quality, providing comfortable accommodations and essential amenities at a reasonable price. With their widespread presence in urban and rural areas, mid-range hotels ensure accessibility and convenience across different regions. Their adaptability to changing consumer preferences and technological advancements, including online booking platforms and mobile apps, enhances the guest experience, contributing to their market dominance.
The expanding middle class and rising demand for cost-effective options drive the need for budget accommodations. These hotels, with smaller size and basic facilities, provide accessible and numerous establishments, meeting travellers’ convenience needs across regions. The significant domestic tourism market in China further supports their dominance as affordable accommodation options are sought after. Budget hotels effectively cater to the growing demand within the domestic tourism sector with competitive pricing and widespread presence.
Hotel chains dominate China hotel market
By business models, the China hotel market is divided into hotel chains, and independent hotels. Hotel chains dominate the China hotel market due to their strong brand recognition appeals to travelers, who prefer familiar brands. The standardized quality offered by hotel chains ensures consistency and reliability, especially important for business travelers. Moreover, hotel chains provide conveniences like loyalty programs, online booking, and 24-hour customer service, making the booking and stay experience easier. Their significant marketing power enables them to reach a wide audience and effectively promote their hotels, attracting potential customers.
Online booking aggregators has the highest share in the China hotel market
Direct Booking from Hotel Website, Online Booking Aggregators, Offline Booking, and Others are the ordering types in the China hotel market. Online booking aggregators' ability to negotiate discounted rates and exclusive deals with hotels attracts budget-conscious travellers seeking competitive prices. The transparency provided through customer reviews and ratings builds trust and enables travellers to make informed decisions based on previous guests' experiences. The growing trend of mobile usage in China, supported by smartphones and mobile apps, enhances the accessibility and seamlessness of online booking, allowing travellers to conveniently search, compare, and book accommodations on the go.
Direct booking from hotel websites is expected to grow in the China hotel market due to increased competition and the convenience it offers. Hotels are actively providing direct booking options to attract customers, offering features like price comparison, review reading, and direct booking. Travelers value the sense of control and transparency that direct booking provides, enabling a direct relationship with the hotel and potentially better customer service.
By customer age-group, the China hotel market is categorized into Before 1970, 1970-1980, 1980-1985, 1985-1990, 1990-1995, 1995-2000, and After 2000.
The rapid growth of the online travel market in China has made online booking the preferred choice, especially among the 1990-1995 age group. This demographic is more inclined to book hotel rooms online and utilizes social media for hotel research and bookings. Moreover, their preference for experiences over possessions and their interest in trying new things and exploring different cultures drive their travel decisions. The increasing disposable income of this age group further enables them to afford travel expenses, including hotel stays.
Municipalities and provincial capital cities in China are experiencing strong growth in the hotel market.
Municipalities and provincial capital cities serve as economic and political centers, attracting business travellers and government officials. They also offer cultural attractions and vibrant urban environments that appeal to tourists. Their role as educational, healthcare, and research hubs increases the demand for temporary accommodation. Ongoing infrastructure development and urbanization efforts further contribute to the growth, catering to the expanding population and business activities in these cities.
The volume of municipalities and provincial capital cities in the China hotel market is expected to grow due to their appeal as cultural and tourist attractions, leading to increased demand for hotel accommodations. Furthermore, the presence of educational, healthcare, and research institutions in these cities generates additional demand for hotel rooms.
1-star, 2-star, 3-star, 4-star, and 5-star hotel are prominent in the China hotel market.
The expanding middle class and focus on affordability contribute to increased demand for mid-range accommodations. The development of tourism infrastructure and growth in travel broaden the customer base, serving both leisure and business travellers with reasonable prices and comfortable amenities. Online travel agencies and booking platforms facilitate convenient access and reservations, boosting volume and market share. Government initiatives support the growth by encouraging mid-range accommodations to meet the needs of domestic and international travellers.
Based on cities, the China hotel market is fragmented into Beijing, Shanghai, Guangzhou, Shenzhen, Hong Kong, Macau, and Others.
Shanghai's dominance in the China hotel market can be due to its status as a major economic and financial centre attracts significant business travel, generating high demand for hotel accommodations. Shanghai's popularity as a tourist destination, thanks to its renowned attractions, leads to a constant influx of tourists and increased demand for hotel rooms. The city's role as a major transportation hub and its accessibility further contribute to the need for hotel accommodations. Moreover, the large population and strong economy of Shanghai provide a substantial local market for hotels, ensuring a steady flow of guests.
Guangzhou's potential for growth in the China hotel market stems from its increasing popularity as a tourist destination with notable attractions. Its strategic location and robust transportation infrastructure facilitate easy access for domestic and international travellers, fostering hotel market expansion. Government initiatives to promote tourism and investment have further led to the development of new attractions and business districts, creating opportunities for hotel expansion.
Competitive Landscape
Huazhu Hotels Group Ltd, Zhejiang New Century Hotel Management Co. Limited, Emei Shan Tourism Co.,Ltd, Expedia Group Inc, Guangdong International Hotel Management Holdings Ltd., Huangshan Tourism Development Co. Ltd, InterContinental Hotels Group PLC, Shanghai Jin Jiang International Hotels (Group) Company, Marriott International Inc, and Tongcheng Travel Holdings Ltd, are the key players in the China hotel market.
Renub Research report titled “China Hotel Market by Market & Volume Share, by Hotel Type (High-end Hotel, Mid-end Hotel, and Budget Hotel), Business Model (Hotel Chains, and Independent Hotels), Ordering (Direct Book from Hotel Website, Online Booking Aggregators, Offline Booking, and Others), Customer Age Group (Before 1970, 1970-1980, 1980-1985, 1985-1990, 1990-1995, 1995-2000, and After 2000), Tiers (First-tier Cities, Municipalities and Provincial Cities, and Other Cities), Star Rating (1-star, 2-star, 3-star, 4-star, and 5-star), Cities (Beijing, Shanghai, Guangzhou, Shenzhen, Hong Kong, Macau, and Others), Company Analysis (Huazhu Hotels Group Ltd, Zhejiang New Century Hotel Management Co. Limited, Emei Shan Tourism Co.,Ltd, Expedia Group Inc, Guangdong International Hotel Management Holdings Ltd., Huangshan Tourism Development Co. Ltd, InterContinental Hotels Group PLC, Shanghai Jin Jiang International Hotels (Group) Company, Marriott International Inc, and Tongcheng Travel Holdings Ltd,)" provides complete study of China Hotel Market.
Hotel Type – China Hotel Market breakup from 3 Viewpoints:
1. High-end hotel
2. Mid-end hotel
3. Budget hotel
Business Model – China Hotel Market breakup from 2 Viewpoints:
1. Hotel Chains
2. Independent Hotels
Ordering – China Hotel Market breakup from 4 Viewpoints:
1. Direct Book from Hotel Website
2. Online Booking Aggregators
3. Offline Booking
4. Others
Customer age group – China Hotel Market breakup from 7 Viewpoints:
1. Before 1970
2. 1970-1980
3. 1980-1985
4. 1985-1990
5. 1990-1995
6. 1995-2000
7. After 2000
Tiers – China Hotel Market breakup from 3 Viewpoints:
1. First-tier cities
2. Municipalities and Provincial cities
3. other cities
Star Rating – China Hotel Market breakup from 5 Viewpoints:
1. 1-star
2. 2-star
3. 3-star
4. 4-star
5. 5-star
Cities – China Hotel Market breakup from 7 Viewpoints:
1. Beijing
2. Shanghai
3. Guangzhou
4. Shenzhen
5. Hong Kong
6. Macau
7. Others
Company has been covered from 3 Viewpoints:
• Overview
• Recent Developments
• Revenue
Company Analysis:
1. Huazhu Hotels Group Ltd
2. Zhejiang New Century Hotel Management Co. Limited
3. Emei Shan Tourism Co.,Ltd
4. Expedia Group Inc
5. Guangdong International Hotel Management Holdings Ltd.
6. Huangshan Tourism Development Co. Ltd
7. InterContinental Hotels Group PLC
8. Shanghai Jin Jiang International Hotels (Group) Company
9. Marriott International Inc
10. Tongcheng Travel Holdings Ltd
Report Details:
| Report Features | Details |
| Base Year | 2022 |
| Historical Period | 2018 - 2022 |
| Forecast Period | 2023 - 2028 |
| Market | US$ Billion |
| Segment Covered | Hotel Type, Business Model, Ordering, Customer Age Group, Tiers, Star Rating, Cities |
| Cities Covered | Beijing, Shanghai, Guangzhou, Shenzhen, Hong Kong, Macau, and Others |
| Companies Covered | Huazhu Hotels Group Ltd, Zhejiang New Century Hotel Management Co. Limited, Emei Shan Tourism Co.,Ltd, Expedia Group Inc, Guangdong International Hotel Management Holdings Ltd., Huangshan Tourism Development Co. Ltd, InterContinental Hotels Group PLC, Shanghai Jin Jiang International Hotels (Group) Company, Marriott International Inc, and Tongcheng Travel Holdings Ltd |
| Customization Scope | 20% Free Customization |
| Post-Sale Analyst Support | 1 Year (52 Weeks) |
| Delivery Format | PDF and Excel through Email (We can also provide the editable version of the report in PPT/Word format on request) |
1. Introduction
2. Research & Methodology
3. Executive Summary
4. Market Dynamics
4.1 Growth Drivers
4.2 Challenges
5. Porters Five Forces
5.1 Competitive Rivalry
5.2 Supplier Power
5.3 Buyer Power
5.4 Threat of Substitution
5.5 Threat of New Entry
6. PESTLE Analysis
6.1 Political
6.2 Economic
6.3 Social
6.4 Technological
6.5 Legal
6.6 Environmental
7. China Hotel Market and Volume
7.1 Market
7.2 Volume
8. Market Share – China Hotel Analysis
8.1 By Hotel Type
8.2 By Business Model
8.3 By Ordering
8.4 By Customer Age Group
8.5 By Tiers
8.6 By Star Ratings
8.7 By Cities
9. Volume Share – China Hotel Analysis
9.1 By Hotel Type
9.2 By Tiers
9.3 By Star Ratings
9.4 By Cities
10. Hotel Type – China Hotel Market and Volume Analysis
10.1 High-end Hotel
10.1.1 Market
10.1.2 Volume
10.2 Mid-end Hotel
10.2.1 Market
10.2.2 Volume
10.3 Budget Hotel
10.3.1 Market
10.3.2 Volume
11. Business Model – China Hotel Market
11.1 Hotel Chains
11.1.1 Market
11.1.2 Volume
11.2 Independent Hotels
11.2.1 Market
11.2.2 Volume
12. Ordering – China Hotel Market
12.1 Direct Book from Hotel Website
12.2 Online Booking Aggregators
12.3 Offline Booking
12.4 Other
13. Customer Age Group – China Hotel Market
13.1 Before 1970
13.2 1970-1980
13.3 1980-1985
13.4 1985-1990
13.5 1990-1995
13.6 1995-2000
13.7 After 2000
14. Tiers – China Hotel Market
14.1 First-Tier Cities
14.1.1 Market
14.1.2 Volume
14.2 Municipalities and Provincial Capitals
14.2.1 Market
14.2.2 Volume
14.3 Other Cities
14.3.1 Market
14.3.2 Volume
15. Star Ratings – China Hotel Market
15.1 1-Star Hotel
15.1.1 Market
15.1.2 Volume
15.2 2-Star Hotel
15.2.1 Market
15.2.2 Volume
15.3 3-Star Hotel
15.3.1 Market
15.3.2 Volume
15.4 4-Star Hotel
15.4.1 Market
15.4.2 Volume
15.5 5-Star Hotel
15.5.1 Market
15.5.2 Volume
16. Cities – China Hotel Market
16.1 Beijing
16.1.1 Market
16.1.2 Volume
16.2 Shanghai
16.2.1 Market
16.2.2 Volume
16.3 Guangzhou
16.3.1 Market
16.3.2 Volume
16.4 Shenzhen
16.4.1 Market
16.4.2 Volume
16.5 Hong Kong
16.5.1 Market
16.5.2 Volume
16.6 Macau
16.6.1 Market
16.6.2 Volume
16.7 Others
16.7.1 Market
16.7.2 Volume
17. Company Analysis
17.1 Huazhu Hotels Group Ltd
17.1.1 Overview
17.1.2 Recent Developments
17.1.3 Revenue Analysis
17.2 Zhejiang New Century Hotel Management Co. Limited
17.2.1 Overview
17.2.2 Recent Developments
17.2.3 Revenue Analysis
17.3 Emei Shan Tourism Co.,Ltd
17.3.1 Overview
17.3.2 Recent Developments
17.3.3 Revenue Analysis
17.4 Expedia Group Inc.
17.4.1 Overview
17.4.2 Recent Developments
17.4.3 Revenue Analysis
17.5 Guangdong International Hotel Management Holdings Ltd.
17.5.1 Overview
17.5.2 Recent Developments
17.5.3 Revenue Analysis
17.6 Huangshan Tourism Development Co. Ltd.
17.6.1 Overview
17.6.2 Recent Developments
17.6.3 Revenue Analysis
17.7 InterContinental Hotels Group PLC
17.7.1 Overview
17.7.2 Recent Developments
17.7.3 Revenue Analysis
17.8 Shanghai Jin Jiang International Hotels (Group) Company Limited
17.8.1 Overview
17.8.2 Recent Developments
17.8.3 Revenue Analysis
17.9 Marriott International Inc.
17.9.1 Overview
17.9.2 Recent Developments
17.9.3 Revenue Analysis
17.10 Tongcheng Travel Holdings Ltd.
17.10.1 Overview
17.10.2 Recent Developments
17.10.3 Revenue Analysis
List of Figures:
Figure-01: China – Hotel Market (Billion US$), 2018 – 2022
Figure-02: China – Forecast for Hotel Market (Billion US$), 2023 – 2028
Figure-03: China – Hotel Volume (Number of Hotel Rooms in Million), 2018 – 2022
Figure-04: China – Forecast for Hotel Volume (Number of Hotel Rooms in Million), 2023 – 2028
Figure-05: Hotel Type – High-end Hotel Market (Billion US$), 2018 – 2022
Figure-06: Hotel Type – Forecast for High-end Hotel Market (Billion US$), 2023 – 2028
Figure-07: Hotel Type – High-end Hotel Volume (Number of Hotels in Thousand), 2018 – 2022
Figure-08: Hotel Type – Forecast for High-end Hotel Volume (Number of Hotels in Thousand), 2023 – 2028
Figure-09: Hotel Type – Mid-end Hotel Market (Billion US$), 2018 – 2022
Figure-10: Hotel Type – Forecast for Mid-end Hotel Market (Billion US$), 2023 – 2028
Figure-11: Hotel Type – Mid-end Hotel Volume (Number of Hotels in Thousand), 2018 – 2022
Figure-12: Hotel Type – Forecast for Mid-end Hotel Volume (Number of Hotels in Thousand), 2023 – 2028
Figure-13: Hotel Type – Budget Hotel Market (Billion US$), 2018 – 2022
Figure-14: Hotel Type – Forecast for Budget Hotel Market (Billion US$), 2023 – 2028
Figure-15: Hotel Type – Budget Hotel Volume (Number of Hotels in Thousand), 2018 – 2022
Figure-16: Hotel Type – Forecast for Budget Hotel Volume (Number of Hotels in Thousand), 2023 – 2028
Figure-17: Business Model – Hotel Chains Market (Billion US$), 2018 – 2022
Figure-18: Business Model – Forecast for Hotel Chains Market (Billion US$), 2023 – 2028
Figure-19: Business Model – Hotel Chains Volume (Number of Hotels in Thousand), 2018 – 2022
Figure-20: Business Model – Forecast for Hotel Chains Volume (Number of Hotels in Thousand), 2023 – 2028
Figure-21: Business Model – Independent Hotels Market (Billion US$), 2018 – 2022
Figure-22: Business Model – Forecast for Independent Hotels Market (Billion US$), 2023 – 2028
Figure-23: Business Model – Independent Hotels Volume (Number of Hotels in Thousand), 2018 – 2022
Figure-24: Business Model – Forecast for Independent Hotels Volume (Number of Hotels in Thousand), 2023 – 2028
Figure-25: Ordering – Direct Book from Hotel Website Market (Billion US$), 2018 – 2022
Figure-26: Ordering – Forecast for Direct Book from Hotel Website Market (Billion US$), 2023 – 2028
Figure-27: Ordering – Online Booking Aggregators Market (Billion US$), 2018 – 2022
Figure-28: Ordering – Forecast for Online Booking Aggregators Market (Billion US$), 2023 – 2028
Figure-29: Ordering – Offline Booking Market (Billion US$), 2018 – 2022
Figure-30: Ordering – Forecast for Offline Booking Market (Billion US$), 2023 – 2028
Figure-31: Ordering – Other Market (Billion US$), 2018 – 2022
Figure-32: Ordering – Forecast for Other Market (Billion US$), 2023 – 2028
Figure-33: Customer Age Group – Before 1970 Market (Billion US$), 2018 – 2022
Figure-34: Customer Age Group – Forecast for Before 1970 Market (Billion US$), 2023 – 2028
Figure-35: Customer Age Group – 1970-1980 Market (Billion US$), 2018 – 2022
Figure-36: Customer Age Group – Forecast for 1970-1980 Market (Billion US$), 2023 – 2028
Figure-37: Customer Age Group – 1980-1985 Market (Billion US$), 2018 – 2022
Figure-38: Customer Age Group – Forecast for 1980-1985 Market (Billion US$), 2023 – 2028
Figure-39: Customer Age Group – 1985-1990 Market (Billion US$), 2018 – 2022
Figure-40: Customer Age Group – Forecast for 1985-1990 Market (Billion US$), 2023 – 2028
Figure-41: Customer Age Group – 1990-1995 Market (Billion US$), 2018 – 2022
Figure-42: Customer Age Group – Forecast for 1990-1995 Market (Billion US$), 2023 – 2028
Figure-43: Customer Age Group – 1995-2000 Market (Billion US$), 2018 – 2022
Figure-44: Customer Age Group – Forecast for 1995-2000 Market (Billion US$), 2023 – 2028
Figure-45: Customer Age Group – After 2000 Market (Billion US$), 2018 – 2022
Figure-46: Customer Age Group – Forecast for After 2000 Market (Billion US$), 2023 – 2028
Figure-47: First-Tier Cities – Hotel Market (Billion US$), 2018 – 2022
Figure-48: First-Tier Cities – Forecast for Hotel Market (Billion US$), 2023 – 2028
Figure-49: First-Tier Cities – Hotel Volume (Number of Hotels in Thousand), 2018 – 2022
Figure-50: First-Tier Cities – Forecast for Hotel Volume (Number of Hotels in Thousand), 2023 – 2028
Figure-51: Municipalities and Provincial Capitals – Hotel Market (Billion US$), 2018 – 2022
Figure-52: Municipalities and Provincial Capitals – Forecast for Hotel Market (Billion US$), 2023 – 2028
Figure-53: Municipalities and Provincial Capitals – Hotel Volume (Number of Hotels in Thousand), 2018 – 2022
Figure-54: Municipalities and Provincial Capitals – Forecast for Hotel Volume (Number of Hotels in Thousand), 2023 – 2028
Figure-55: Other Cities – Hotel Market (Billion US$), 2018 – 2022
Figure-56: Other Cities – Forecast for Hotel Market (Billion US$), 2023 – 2028
Figure-57: Other Cities – Hotel Volume (Number of Hotels in Thousand), 2018 – 2022
Figure-58: Other Cities – Forecast for Hotel Volume (Number of Hotels in Thousand), 2023 – 2028
Figure-59: Star Ratings – 1-Star Hotel Market (Million US$), 2018 – 2022
Figure-60: Star Ratings – Forecast for 1-Star Hotel Market (Million US$), 2023 – 2028
Figure-61: Star Ratings – 1-Star Hotel Volume (Number of Hotels in Thousand), 2018 – 2022
Figure-62: Star Ratings – Forecast for 1-Star Hotel Volume (Number of Hotels in Thousand), 2023 – 2028
Figure-63: Star Ratings – 2-Star Hotel Market (Million US$), 2018 – 2022
Figure-64: Star Ratings – Forecast for 2-Star Hotel Market (Million US$), 2023 – 2028
Figure-65: Star Ratings – 2-Star Hotel Volume (Number of Hotels in Thousand), 2018 – 2022
Figure-66: Star Ratings – Forecast for 2-Star Hotel Volume (Number of Hotels in Thousand), 2023 – 2028
Figure-67: Star Ratings – 3-Star Hotel Market (Million US$), 2018 – 2022
Figure-68: Star Ratings – Forecast for 3-Star Hotel Market (Million US$), 2023 – 2028
Figure-69: Star Ratings – 3-Star Hotel Volume (Number of Hotels in Thousand), 2018 – 2022
Figure-70: Star Ratings – Forecast for 3-Star Hotel Volume (Number of Hotels in Thousand), 2023 – 2028
Figure-71: Star Ratings – 4-Star Hotel Market (Million US$), 2018 – 2022
Figure-72: Star Ratings – Forecast for 4-Star Hotel Market (Million US$), 2023 – 2028
Figure-73: Star Ratings – 4-Star Hotel Volume (Number of Hotels in Thousand), 2018 – 2022
Figure-74: Star Ratings – Forecast for 4-Star Hotel Volume (Number of Hotels in Thousand), 2023 – 2028
Figure-75: Star Ratings – 5-Star Hotel Market (Million US$), 2018 – 2022
Figure-76: Star Ratings – Forecast for 5-Star Hotel Market (Million US$), 2023 – 2028
Figure-77: Star Ratings – 5-Star Hotel Volume (Number of Hotels in Thousand), 2018 – 2022
Figure-78: Star Ratings – Forecast for 5-Star Hotel Volume (Number of Hotels in Thousand), 2023 – 2028
Figure-79: Beijing – Hotel Market (Billion US$), 2018 – 2022
Figure-80: Beijing – Forecast for Hotel Market (Billion US$), 2023 – 2028
Figure-81: Beijing – Hotel Volume (Number of Hotels in Thousand), 2018 – 2022
Figure-82: Beijing – Forecast for Hotel Volume (Number of Hotels in Thousand), 2023 – 2028
Figure-83: Shanghai – Hotel Market (Billion US$), 2018 – 2022
Figure-84: Shanghai – Forecast for Hotel Market (Billion US$), 2023 – 2028
Figure-85: Shanghai – Hotel Volume (Number of Hotels in Thousand), 2018 – 2022
Figure-86: Shanghai – Forecast for Hotel Volume (Number of Hotels in Thousand), 2023 – 2028
Figure-87: Guangzhou – Hotel Market (Billion US$), 2018 – 2022
Figure-88: Guangzhou – Forecast for Hotel Market (Billion US$), 2023 – 2028
Figure-89: Guangzhou – Hotel Volume (Number of Hotels in Thousand), 2018 – 2022
Figure-90: Guangzhou – Forecast for Hotel Volume (Number of Hotels in Thousand), 2023 – 2028
Figure-91: Shenzhen – Hotel Market (Billion US$), 2018 – 2022
Figure-92: Shenzhen – Forecast for Hotel Market (Billion US$), 2023 – 2028
Figure-93: Shenzhen – Hotel Volume (Number of Hotels in Thousand), 2018 – 2022
Figure-94: Shenzhen – Forecast for Hotel Volume (Number of Hotels in Thousand), 2023 – 2028
Figure-95: Hong Kong – Hotel Market (Billion US$), 2018 – 2022
Figure-96: Hong Kong – Forecast for Hotel Market (Billion US$), 2023 – 2028
Figure-97: Hong Kong – Hotel Volume (Number of Hotels in Thousand), 2018 – 2022
Figure-98: Hong Kong – Forecast for Hotel Volume (Number of Hotels in Thousand), 2023 – 2028
Figure-99: Macau – Hotel Market (Billion US$), 2018 – 2022
Figure-100: Macau – Forecast for Hotel Market (Billion US$), 2023 – 2028
Figure-101: Macau – Hotel Volume (Number of Hotels in Thousand), 2018 – 2022
Figure-102: Macau – Forecast for Hotel Volume (Number of Hotels in Thousand), 2023 – 2028
Figure-103: Others – Hotel Market (Billion US$), 2018 – 2022
Figure-104: Others – Forecast for Hotel Market (Billion US$), 2023 – 2028
Figure-105: Others – Hotel Volume (Number of Hotels in Thousand), 2018 – 2022
Figure-106: Others – Forecast for Hotel Volume (Number of Hotels in Thousand), 2023 – 2028
Figure-107: Huazhu Hotels Group Ltd – Global Revenue (Million US$), 2018 – 2022
Figure-108: Huazhu Hotels Group Ltd – Forecast for Global Revenue (Million US$), 2023 – 2028
Figure-109: Zhejiang New Century Hotel Management Co. Limited – Global Revenue (Million US$), 2018 – 2022
Figure-110: Zhejiang New Century Hotel Management Co. Limited – Forecast for Global Revenue (Million US$), 2023 – 2028
Figure-111: Emei Shan Tourism Co.,Ltd – Global Revenue (Million US$), 2018 – 2022
Figure-112: Emei Shan Tourism Co.,Ltd – Forecast for Global Revenue (Million US$), 2023 – 2028
Figure-113: Expedia Group Inc. – Global Revenue (Million US$), 2018 – 2022
Figure-114: Expedia Group Inc. – Forecast for Global Revenue (Million US$), 2023 – 2028
Figure-115: Guangdong International Hotel Management Holdings Ltd. – Global Revenue (Million US$), 2018 – 2022
Figure-116: Guangdong International Hotel Management Holdings Ltd. – Forecast for Global Revenue (Million US$), 2023 – 2028
Figure-117: Huangshan Tourism Development Co. Ltd. – Global Revenue (Million US$), 2018 – 2022
Figure-118: Huangshan Tourism Development Co. Ltd. – Forecast for Global Revenue (Million US$), 2023 – 2028
Figure-119: InterContinental Hotels Group PLC – Global Revenue (Million US$), 2018 – 2022
Figure-120: InterContinental Hotels Group PLC – Forecast for Global Revenue (Million US$), 2023 – 2028
Figure-121: Shanghai Jin Jiang International Hotels (Group) Company Limited – Global Revenue (Million US$), 2018 – 2022
Figure-122: Shanghai Jin Jiang International Hotels (Group) Company Limited – Forecast for Global Revenue (Million US$), 2023 – 2028
Figure-123: Marriott International Inc. – Global Revenue (Million US$), 2018 – 2022
Figure-124: Marriott International Inc. – Forecast for Global Revenue (Million US$), 2023 – 2028
Figure-125: Tongcheng Travel Holdings Ltd. – Global Revenue (Million US$), 2018 – 2022
Figure-126: Tongcheng Travel Holdings Ltd. – Forecast for Global Revenue (Million US$), 2023 – 2028
List of Tables:
Table-01: China – Hotel Market Share by Hotel Type (Percent), 2018 – 2022
Table-02: China – Forecast for Hotel Market Share by Hotel Type (Percent), 2023 – 2028
Table-03: China – Hotel Market Share by Business Model (Percent), 2018 – 2022
Table-04: China – Forecast for Hotel Market Share by Business Model (Percent), 2023 – 2028
Table-05: China – Hotel Market Share by Ordering (Percent), 2018 – 2022
Table-06: China – Forecast for Hotel Market Share by Ordering (Percent), 2023 – 2028
Table-07: China – Hotel Market Share by Customer Age Group (Percent), 2018 – 2022
Table-08: China – Forecast for Hotel Market Share by Customer Age Group (Percent), 2023 – 2028
Table-09: China – Hotel Market Share by Tiers (Percent), 2018 – 2022
Table-10: China – Forecast for Hotel Market Share by Tiers (Percent), 2023 – 2028
Table-11: China – Hotel Market Share by Star Ratings (Percent), 2018 – 2022
Table-12: China – Forecast for Hotel Market Share by Star Ratings (Percent), 2023 – 2028
Table-13: China – Hotel Market Share by Cities (Percent), 2018 – 2022
Table-14: China – Forecast for Hotel Market Share by Cities (Percent), 2023 – 2028
Table-15: China – Hotel Volume Share by Hotel Type (Percent), 2018 – 2022
Table-16: China – Forecast for Hotel Volume Share by Hotel Type (Percent), 2023 – 2028
Table-17: China – Hotel Volume Share by Tiers (Percent), 2018 – 2022
Table-18: China – Forecast for Hotel Volume Share by Tiers (Percent), 2023 – 2028
Table-19: China – Hotel Volume Share by Star Ratings (Percent), 2018 – 2022
Table-20: China – Forecast for Hotel Volume Share by Star Ratings (Percent), 2023 – 2028
Table-21: China – Hotel Volume Share by Cities (Percent), 2018 – 2022
Table-22: China – Forecast for Hotel Volume Share by Cities (Percent), 2023 – 2028
Reach out to us
Call us on
USA: +1-678-302-0700
INDIA: +91-120-421-9822
Drop us an email at
info@renub.com