Global Vegetable Oil Market Size, Share, Trends & Forecast 2025-2033
Buy NowGlobal Vegetable Oil Market Size and Forecast 2025-2033
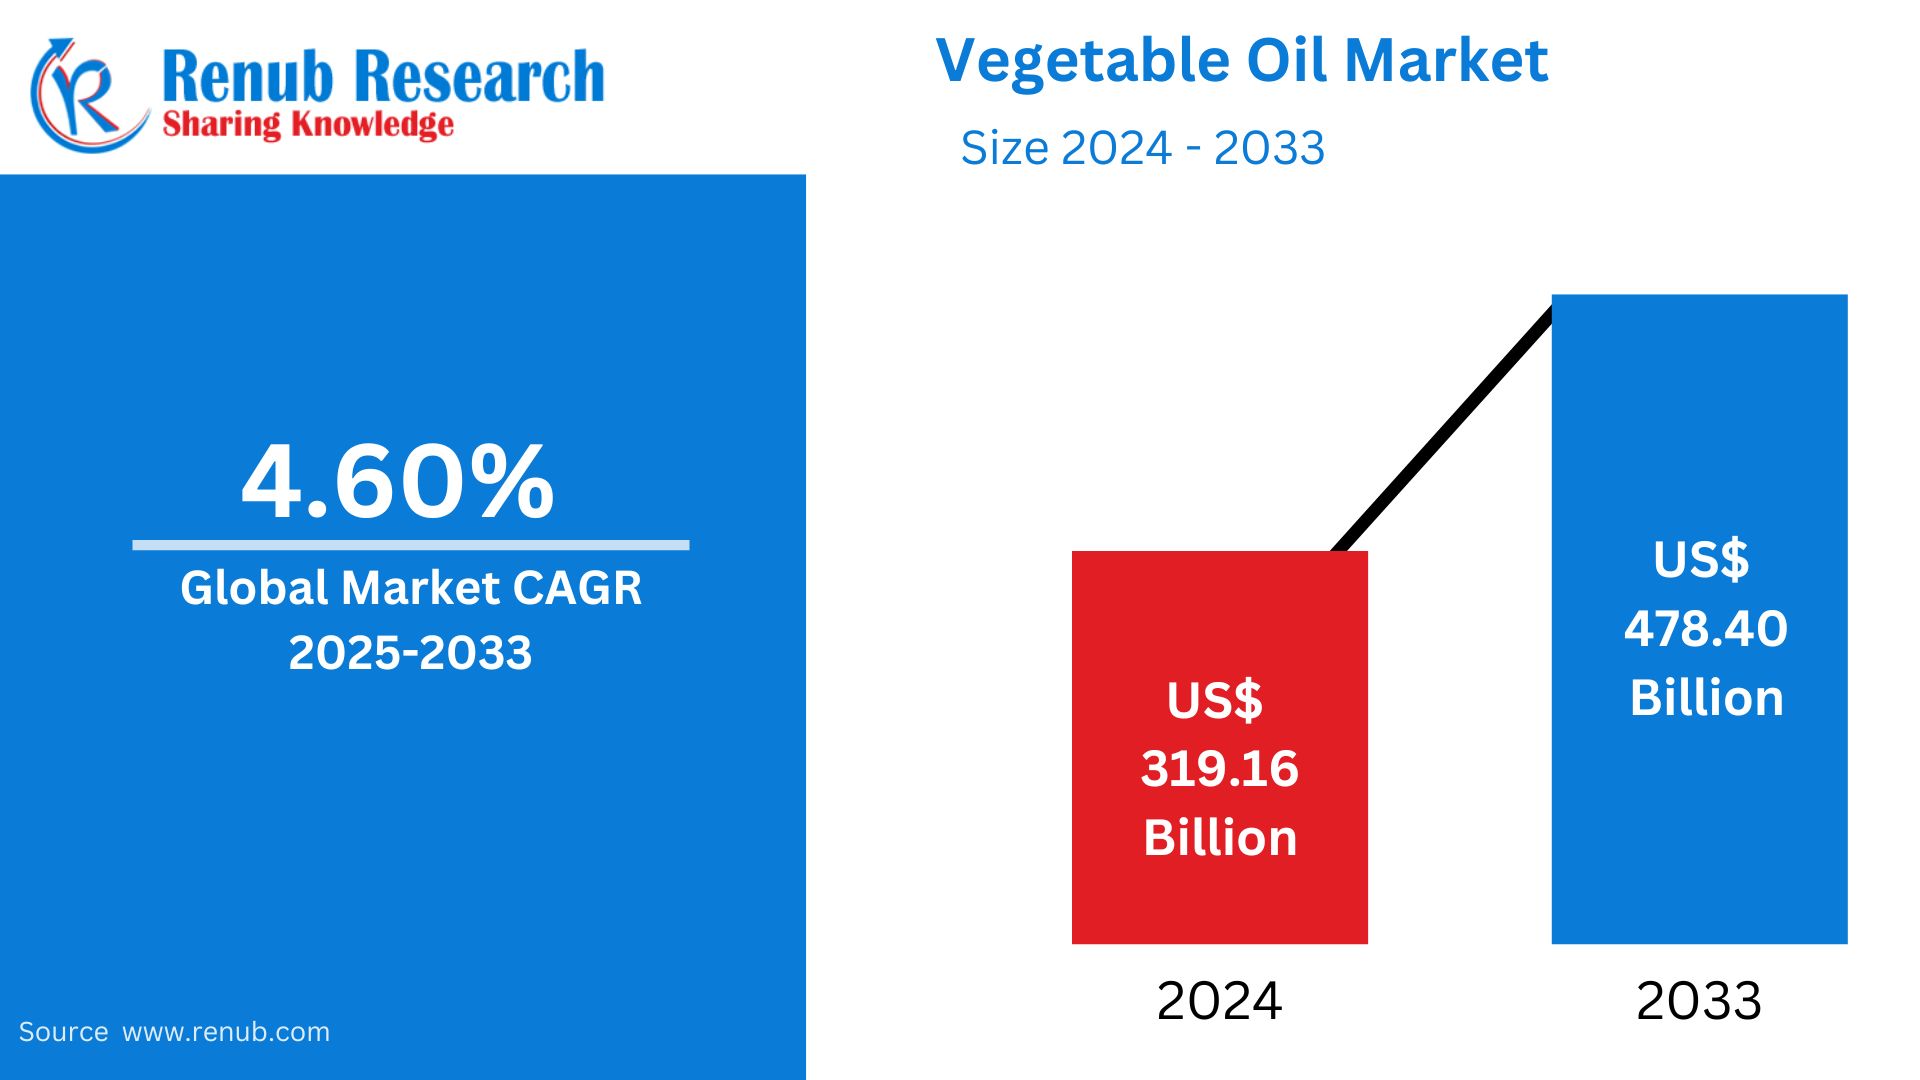
Vegetable Oil Market is expected to reach US$ 478.40 billion in 2033 from US$ 319.16 billion in 2024, with a CAGR of 4.60% from 2025 to 2033. Some of the key reasons driving the market include the growing trend toward healthy eating, the expanding industrial usage of vegetable oils, improvements in farming techniques, rising disposable income, and growing knowledge of the health advantages of specific cooking oils.
Vegetable Oil Market Global Report by Oil Type (Palm Oil, Soybean Oil, Rapeseed Oil, Sunflower Oil, Olive Oil, Others), Application (Food, Feed, Others), Distribution Channel (B2B, B2C), Countries and Company Analysis 2025-2033.
Introduction to the Vegetable Oil Industry
A liquid fat that is extracted from a variety of plants, mostly from seeds or fruits, is called vegetable oil. Soybeans, corn, sunflower, and canola are common suppliers. It is frequently used in baking and cooking as a flavor enhancer, heat transmission medium, and food-moistening agent. Additionally, vegetable oils are used to make biofuels, cosmetics products, and soaps. Although the nutritional value varies based on the source, they are high in essential fatty acids. Unsaturated fats, which are generally thought to be heart-healthy when ingested in moderation, are abundant in certain vegetable oils.
One of the main factors propelling the market's expansion globally is consumers' shifting preferences for healthy oils that are high in unsaturated fats. Consumers' growing health consciousness is another factor propelling the industry and affecting the demand for oils like canola and olive. The market is expanding as a result of the industrial use of vegetable oils in soaps, cosmetics, and biofuels. The demand for edible oils is being fueled by the expanding worldwide population as well as rising affluence in emerging economies. The production of vegetable oil is becoming more economical and efficient as a result of improved yields brought about by improvements in agricultural techniques. The market is significantly shaped by trade laws and government policies, which have an impact on price and manufacturing costs. A range of oils are more easily accessible to consumers thanks to distribution methods, including internet platforms. Concerns about sustainability and moral farming methods are starting to shape consumer preferences, which is good news for the global market.
Key Drivers of the Global Vegetable Oil Market
Growing use in industry
Vegetable oils have several industrial use outside of cooking, which is significantly increasing consumer demand for them. The industry is also being driven by the fact that these oils are essential components of soaps, detergents, cosmetics, and even biofuels. Vegetable oils are essential in many industrial processes due to their multifunctionality. Vegetable oils are in greater demand as businesses grow and diversify. For example, the vegetable oil industry is expanding thanks to the growing biofuels sector, especially biodiesel. The demand for vegetable oils is being further increased by businesses spending money on research to find new industrial uses for them.
Growing global population
As per United Nations, from the current 8 billion to 9.7 billion in 2050 and possibly reaching a peak of about 10.4 billion in the mid-2080s, the world's population is predicted to grow by almost 2 billion people during the next 30 years. Naturally, as the world's population grows, so does the demand for food and, consequently, cooking oils, which is driving significant market expansion. The market is expanding as more individuals can purchase a greater range of oils due to population expansion, particularly in emerging markets where earnings are rising. As the population increases, so does the need for vegetable oils in the manufacturing of food. Furthermore, the demand for the oils used in international cuisines is increasing as those cuisines become more widely available and well-liked.
Consumer tastes are shifting toward healthier options.
Vegetable oils that are high in unsaturated fats and low in saturated fats are becoming more and more popular in today's health-conscious society. Oils that are high in monounsaturated and polyunsaturated fats, including avocado, canola, and olive oils, are becoming more and more popular than conventional oils that are heavy in saturated fats, such coconut or palm oil. Omega-3 fatty acid-rich oils are also becoming more popular due to their shown health advantages. This tendency is being accelerated by labeling measures, scientific study, and public awareness campaigns. The market demand for particular kinds of vegetable oils that are promoted as being healthier is being greatly boosted by the fact that many customers are making better decisions based on the health benefits of oils.
Challenges in the Vegetable Oil Market
Fluctuating raw material prices
In the market for vegetable oil, fluctuating raw material prices pose a serious problem. A number of variables, including weather, crop yields, geopolitical conflicts, and market speculation, can cause significant fluctuations in the price of essential ingredients including soybeans, palm oil, and sunflower seeds. Both businesses and consumers experience pricing volatility as a result of these swings in production costs. Because of this, companies would have trouble making ends meet, and consumers might have to pay more, which would hinder the expansion and stability of the market as a whole.
Labor issues and fair trade concerns
In the vegetable oil sector, labor and fair trade concerns are major obstacles. Particularly in the production of palm oil, laborers in some areas endure exploitation, low pay, and unfavorable working conditions. Governments, NGOs, and consumers are now paying closer attention as a result of these ethical issues. Operational expenses may rise as a result of demand on businesses to implement fair trade policies and guarantee ethical sourcing. To address these problems and ensure the longevity of the industry, certification systems, openness, and worker welfare investments are necessary.
Vegetable Oil Market Overview by Regions
The market for vegetable oil is broad worldwide. Production of palm oil is the most common in Asia-Pacific, especially in Southeast Asia. Due to health trends, the main oils consumed in North America and Europe are soybean, canola, and sunflower. The production of soybean oil is heavily influenced by Latin America, particularly Brazil and Argentina. Due to growing urbanization and health-conscious customers, Africa is seeing a surge in demand for oils like palm and sunflower. Local agricultural and food patterns influence regional production and preferences.
United States Vegetable Oil Market
Due to the strong demand for oils including soybean, canola, and sunflower, the US vegetable oil market is among the biggest in the world. The most extensively produced and used oil is soybean oil, which is mostly used for frying, food processing, and as an ingredient in packaged foods. Consumption is influenced by health trends, since there is a growing desire for better oils like avocado and olive oils. Concerns about trans fats and the drive for non-GMO products also have an effect on the market. The price volatility of raw materials and growing competition from alternative oils and sustainable sourcing methods are further issues facing the U.S. vegetable oil sector.
Germany Vegetable Oil Market
Health-conscious consumers are driving the vegetable oil market in Germany, and they have a strong preference for oils like olive, sunflower, and rapeseed (canola). Growing interest in sustainable, non-GMO food and plant-based diets is driving demand. Because more people are aware of the advantages of healthy fats, the market is also seeing a rise in the use of premium oils. The market is further shaped by Germany's strict regulations on food safety and sustainability, which promote ethical manufacturing methods and open sourcing in the vegetable oil industry.
India Vegetable Oil Market
India has one of the biggest vegetable oil markets in the world, thanks to factors including urbanization, changing dietary trends, and population growth. The market is dominated by sunflower, palm, and soybean oils; sunflower oil is becoming more and more well-liked because of its alleged health advantages. Given the high demand for sunflower oil in Tamil Nadu and Kerala, Freedom Refined Sunflower Oil, a division of Gemini Edibles & Fats India (GEF India), announced plans to enter these markets in June 2022, signaling strategic growth.
Furthermore, the industry is becoming more competitive and consolidated, as seen by Cargill Incorporated's purchase of an edible oil refinery in Nellore in November 2021 and subsequent USD 35 million investment to improve the facility. In order to satisfy rising customer demand, Cargill is expanding its supply chain and increasing its manufacturing capacity. Price swings, trade regulations, and sustainability issues all have an effect on the Indian vegetable oil market. To meet the varied tastes of the nation's consumers, businesses are concentrating on strengthening their sourcing procedures and broadening their geographical reach.
Saudi Arabia Vegetable Oil Market
The food processing industry, increased urbanization, and rising packaged food consumption all contribute to the strong demand for oils like palm, soybean, and sunflower that affect Saudi Arabia's vegetable oil market. The trend toward healthier cooking options is also driving industry growth. Saudi Arabia depends on imports to meet demand despite having little domestic supply. Along with rising customer demand for premium, non-GMO oils, government programs to promote sustainable practices and increase food security also influence the market.
Market Segmentation:
Oil Type
- Palm Oil
- Soybean Oil
- Rapeseed Oil
- Sunflower Oil
- Olive Oil
- Others
Application
- Food
- Feed
- Others
Distribution Channel
- B2B
- B2C
Regional Analysis: Asia-Pacific, North America, Europe, etc.
North America
- United States
- Canada
Europe
- France
- Germany
- Italy
- Spain
- United Kingdom
- Belgium
- Netherlands
- Turkey
Asia Pacific
- China
- Japan
- India
- South Korea
- Thailand
- Malaysia
- Indonesia
- Australia
- New Zealand
Latin America
- Brazil
- Mexico
- Argentina
Middle East & Africa
- Saudi Arabia
- UAE
- South Africa
All the Key players have been covered from 4 Viewpoints:
- Overview
- Key Persons
- Recent Development & Strategies
- Revenue Analysis
Key Players Analysis
- Archer – Daniels -Midland Company
- Wilmar
- AAK (Aarhuskarlshamn)
- Unilever Plc
- Bunge
- Cargill
- Sime Darby
- Associated British Foods
Report Details:
| Report Features | Details |
| Base Year |
2024 |
| Historical Period |
2020 - 2024 |
| Forecast Period |
2025 - 2033 |
| Market |
US$ Billion |
| Segment Covered |
By Oil Type, By Application, By Distribution Channel and By Countries |
| Countries Covered |
|
| Companies Covered |
|
| Customization Scope |
20% Free Customization |
| Post-Sale Analyst Support |
1 Year (52 Weeks) |
| Delivery Format |
PDF and Excel through Email (We can also provide the editable version of the report in PPT/Word format on request) |
Customization Services available
- Analysis of Market Size and Its Segments
- More Company Profiles (Upto 10 without any additional cost):
- Additional Countries (Other than mentioned Countries):
- Region/Country Specific Reports:
- Market Entry Strategy:
- Region-Specific Market Dynamics:
- Regional Market Share Analysis:
- Trade Analysis:
- Production Insights:
- Others Customized Requests:
For more information contact our analysts.
Need More Assistance?
- Talk to our analysts to get more precious information on the current market trends.
- Include more countries and segments and customize the report based on the final requirement.
- Get a competitive advantage in your industry by knowing the report findings and making a positive impact on your revenues and operations.
- Our analysts are always ready to provide more help and pertinent information if you need any additional assistance.