United States Fast Food and Quick Services Restaurants Market Report by Product, States and Company Analysis 2026-2034
Buy NowUnited States Fast Food & Quick Service Restaurant Market Size and Forecast
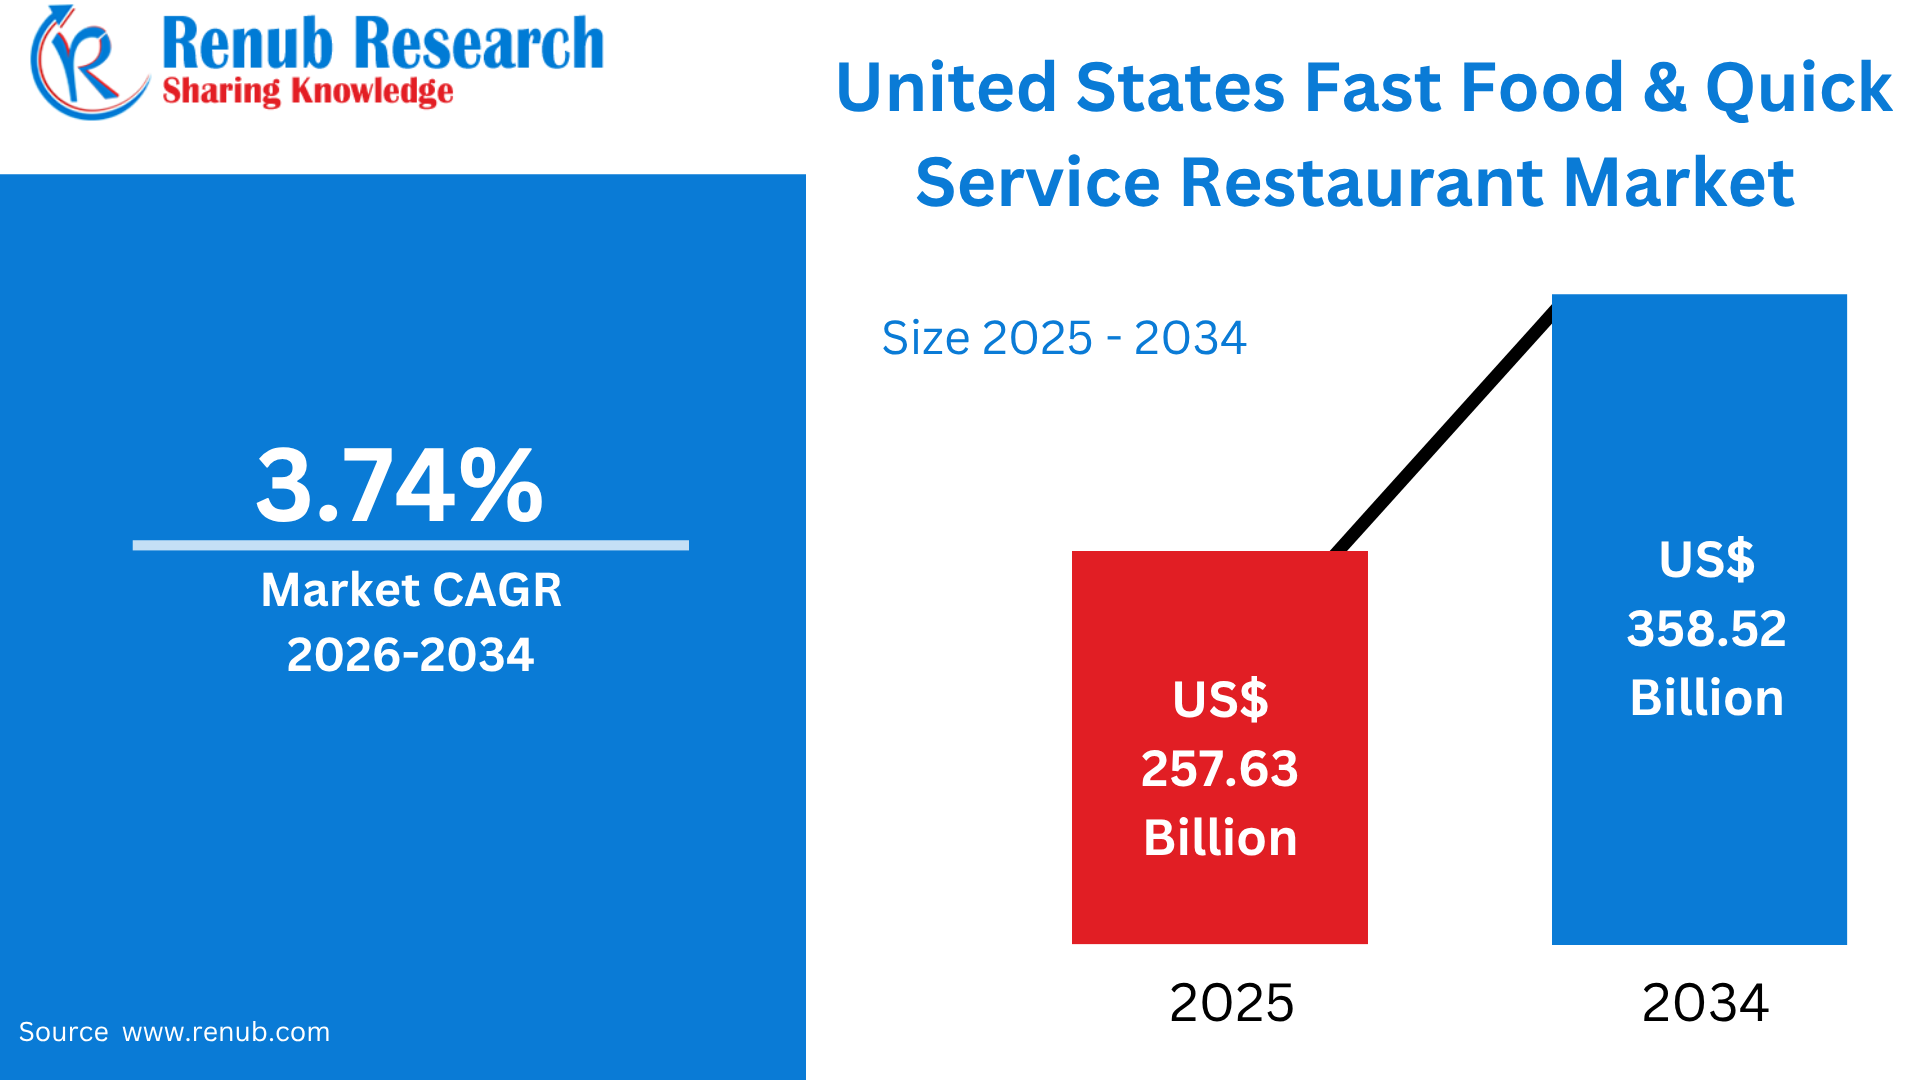
United States fast food and quick service restaurant market is projected to expand from US$ 257.63 billion in 2025 to US$ 358.52 billion by 2034, registering a CAGR of 3.74% during the forecast period of 2026–2034. Market growth is being supported by increasing consumer demand for convenient and affordable dining options, rising adoption of online and mobile food ordering, expanding delivery and takeaway services, and continuous menu innovation. In addition, the growing integration of digital ordering platforms, self-service technologies, loyalty programs, and personalized promotions is strengthening customer engagement and supporting revenue growth across the U.S. fast food and QSR industry.
What is Fast Food & Quick Service Restaurant and Its Uses & Popularity in the USA
Fast food and quick service restaurants (QSRs) are foodservice establishments designed to provide meals and beverages rapidly, usually through counter service, drive-thru, takeaway, delivery, or digital ordering. Unlike full-service restaurants, QSRs generally operate with limited table service, standardized menus, streamlined preparation processes, and relatively short customer waiting times. Typical offerings include burgers, sandwiches, pizza, fried chicken, tacos, salads, breakfast items, snacks, desserts, and beverages. In the United States, QSRs are widely used by consumers seeking convenient, affordable, and accessible meal solutions for breakfast, lunch, dinner, and snacks. Their popularity is supported by busy lifestyles, commuting, increasing use of takeout and delivery, and the expansion of drive-thru locations and mobile ordering. USDA data show that fast food accounted for 16.3% of food energy consumed by Americans in 2017–2018, compared with 5.9% in 1977–1978, demonstrating the category’s long-term importance. In 2025, 47% of U.S. adults used restaurant takeout weekly and 42% used drive-thru weekly, highlighting the continuing importance of convenience-oriented dining.
Growth Drivers of the United States Fast Food & Quick Service Restaurant Market
Rising Demand for Convenience, Takeout, and Drive-Thru Services
Convenience remains one of the strongest growth drivers for the U.S. fast food and QSR market. Consumers increasingly prefer foodservice formats that minimize waiting time and fit around work, commuting, family responsibilities, and other daily activities. Takeout, drive-thru, delivery, and quick counter service allow customers to purchase meals without spending significant time inside a restaurant. According to the National Restaurant Association, 47% of U.S. adults reported using restaurant takeout at least once a week in 2025, while 42% used drive-thru services weekly. Delivery was also used weekly by 37% of adults. Nearly 75% of restaurant traffic now occurs through off-premises channels, including takeout, delivery, and drive-thru. Younger consumers are particularly important: more than 6 in 10 younger adults reported using takeout, drive-thru, and delivery more frequently than the previous year. This behavioral shift encourages QSR chains to expand drive-thru lanes, pickup counters, delivery partnerships, and digitally enabled ordering systems.
Rapid Adoption of Digital Ordering and Delivery Platforms
Digitalization is transforming how Americans discover, order, pay for, and receive fast food. Mobile applications, restaurant websites, third-party delivery platforms, digital wallets, self-service kiosks, loyalty applications, and personalized promotions are becoming integral to QSR operations. USDA Economic Research Service data indicate that third-party delivery spending at U.S. quick-service restaurants increased from approximately US$0.4 billion before the pandemic to US$1.4 billion by late 2022, while restaurant-specific app spending on carryout increased from US$0.9 billion to US$1.6 billion. The National Restaurant Association reported in 2025 that 57% of adults had recently used mobile ordering, increasing to 74% among millennials and 65% among Gen Z adults. Technology also influences restaurant selection, with 53% of limited-service customers saying technology options for ordering and payment factor into their choice. Consequently, QSR companies are investing in mobile apps, loyalty programs, automated ordering, digital menus, and integrated delivery systems.
Menu Innovation, Value Offers, and Changing Consumer Preferences
Continuous menu innovation is helping fast food and QSR operators attract new customers while retaining existing ones. U.S. consumers increasingly seek variety, convenience, affordability, healthier alternatives, premium ingredients, limited-time products, plant-based choices, breakfast offerings, snacks, beverages, and customized meals. Value pricing has become particularly important as consumers remain sensitive to household budgets and food prices. National Restaurant Association research indicates that eight in 10 off-premises customers respond positively to value deals, including limited-time offers, discounts, and buy-one-get-one promotions. In addition, the U.S. restaurant industry was projected to reach US$1.5 trillion in sales in 2025, demonstrating continued underlying consumer demand for restaurant meals. QSR chains are responding through seasonal launches, meal bundles, loyalty-member discounts, premium menu extensions, healthier products, and personalized digital promotions. These strategies increase purchase frequency and enable brands to appeal to different consumer groups while maintaining the speed and affordability associated with the QSR model.
Challenges of the United States Fast Food & Quick Service Restaurant Market
Rising Labor, Food, and Operating Costs
Increasing operating expenses represent a major challenge for U.S. fast food and QSR operators because profitability depends heavily on maintaining high transaction volumes while controlling costs. Restaurants face expenses related to labor, ingredients, rent, utilities, technology, transportation, packaging, insurance, and equipment. Persistent cost inflation can compress margins when operators cannot fully transfer higher expenses to customers without reducing demand. The National Restaurant Association reported in 2026 that persistent cost pressures, uneven customer traffic, and cautious household spending continue to affect restaurant profitability. Labor is another significant issue. In the Association’s 2025 industry findings, 77% of restaurant operators identified recruiting and retaining employees as a leading challenge, despite turnover improving to its lowest level in a decade. QSR companies therefore need to balance competitive wages and employee retention with productivity improvements. Automation, self-service kiosks, optimized staffing, streamlined kitchens, and technology-enabled operations are increasingly being used to improve efficiency and protect margins.
Intense Competition and Consumer Price Sensitivity
U.S. QSR market is highly competitive, with major national chains, regional brands, independent restaurants, convenience stores, fast-casual operators, grocery retailers, and delivery platforms competing for consumers’ food budgets. This competition makes it difficult for established brands to maintain traffic and pricing power. Consumers are also increasingly sensitive to food prices and may switch between brands based on promotions, portion sizes, perceived quality, convenience, and value. The National Restaurant Association noted that restaurant operators continue to face intensifying competitive pressures, while consumers remain financially constrained. The challenge is further amplified by the growing importance of off-premises channels, where customers can easily compare restaurants through digital platforms. Although nearly three-quarters of restaurant traffic occurs off-premises, operators must continually invest in technology, delivery, loyalty programs, promotions, and menu innovation to retain customers. As a result, QSR companies must simultaneously protect affordability, maintain food quality, differentiate their brands, and manage increasingly complex customer expectations.
Top Five States with the Highest Percentage of Fast Food Restaurants
- Maryland – 46.76%: Maryland ranks first, with fast food restaurants accounting for 46.76% of its restaurant establishments.
- New Mexico – 42.02%: New Mexico follows with a 42.02% share, reflecting a strong presence of fast food establishments.
- Alabama – 40.76%: Fast food restaurants represent 40.76% of restaurant establishments in Alabama.
- West Virginia – 40.01%: West Virginia records a 40.01% share of fast food restaurants.
- Virginia – 39.99%: Virginia rounds out the top five, with fast food restaurants making up 39.99% of establishments.
Sources: Escoffier and Renub Research
Pizza Consumption Statistics
- Nearly 93% of Americans consumed pizza within the past month.
- The average person in the United States eats around 23 pounds of pizza annually.
- About 13% of the U.S. population eats pizza on any particular day.
- Thin crust pizza is the most preferred crust style globally, favored by nearly 61% of consumers.
- Pepperoni remains the top pizza topping, accounting for approximately 36% of total pizza orders.
- Extra cheese ranks as the second most requested topping, appearing in nearly 25% of orders.
- More than 3 billion pizzas are purchased across the United States every year.
- Americans eat an estimated 350 pizza slices every second.
- The United States currently has more than 78,000 operational pizza restaurants.
- Around 17% of all restaurants in the country are pizzerias.
- Super Bowl Sunday represents the highest pizza consumption day annually in the United States.
- Saturday night is consistently the most popular time for pizza consumption during the week.
- Halloween ranks as the second busiest occasion for pizza delivery services in the United States.
Strong Consumer Demand and Established Burger Chains
U.S. hamburger segment remains one of the largest and most recognizable categories within quick-service restaurants, supported by broad consumer acceptance, affordability, and extensive restaurant availability. Hamburgers appeal to consumers across age groups and income levels because they offer convenient meal solutions with extensive customization. The strength of leading chains demonstrates the scale of the category. According to QSR Magazine’s 2026 QSR 50 ranking, McDonald’s generated US$55.06 billion in U.S. systemwide sales in 2025, while Wendy’s recorded US$11.90 billion and Burger King generated US$11.07 billion. Burger restaurants are also increasingly introducing premium burgers, chicken alternatives, plant-based patties, specialty sauces, and limited-time offerings to stimulate demand. Drive-thru availability, mobile ordering, delivery applications, and loyalty programs further support sales by improving accessibility. The continued expansion of burger restaurants across urban, suburban, and highway locations also strengthens consumer convenience and helps maintain hamburgers as a core component of the U.S. fast-food industry.
High Consumer Spending and Extensive Restaurant Network
Pizza represents another major category within the U.S. fast-food and QSR landscape, benefiting from its versatility, affordability, and suitability for individual and group consumption. Pizza can be customized through crust types, toppings, portion sizes, sauces, and dietary alternatives, making it attractive to diverse consumer groups. The U.S. pizza restaurant industry had more than 75,700 businesses in 2025, while the industry’s market size was approximately US$49.45 billion. Consumer spending in the quick-service pizza category reached approximately US$43.4 billion in 2025, demonstrating substantial demand. Pizza also benefits strongly from digital ordering, delivery, takeaway, and promotional bundles. Domino’s, Pizza Hut, Little Caesars, and Papa Johns remain important participants in the category, while regional and independent operators continue to introduce differentiated products. Gluten-free crusts, plant-based toppings, premium ingredients, Detroit-style and other specialty pizzas are expanding consumer choice. Loyalty programs, limited-time promotions, family meals, and digital discounts further encourage repeat purchases and strengthen the overall QSR pizza marketUnited States Fast Food and Quick Service Restaurants Sandwich Market
Customization and Growing Demand for Convenient Meals
U.S. sandwich market continues to benefit from consumers seeking convenient, customizable, and portable meals for breakfast, lunch, dinner, and snacks. Sandwiches can accommodate a broad range of ingredients, including chicken, turkey, beef, seafood, vegetables, cheese, whole-grain breads, wraps, and plant-based proteins. This flexibility enables QSR operators to address changing preferences around nutrition, portion sizes, and flavor variety. The competitive scale of the segment is demonstrated by leading brands. QSR Magazine reported that Subway generated approximately US$9.20 billion in U.S. systemwide sales in 2025, followed by Panera at US$5.89 billion, Arby’s at US$4.24 billion, and Jersey Mike’s at US$4.22 billion. Digital ordering, delivery, pickup, and loyalty applications are further improving accessibility. Restaurants are also introducing grilled chicken sandwiches, premium deli offerings, wraps, salads, vegetarian selections, and limited-time products. Customizable ingredients and value-oriented meal combinations help brands attract price-conscious consumers while encouraging repeat visits. As convenience remains central to U.S. foodservice consumption, sandwich-focused QSRs are positioned to maintain strong demand.
Tourism and Population Growth Supporting Restaurant Demand
Florida represents an important market for fast food and quick-service restaurants because of its large resident population, strong tourism industry, and extensive urban and suburban development. The state had an estimated 23.5 million residents in 2025, representing an 8.9% increase from 2020, expanding the potential customer base for restaurant operators. Tourism provides an additional source of demand. Florida welcomed approximately 143.3 million visitors in 2025, including domestic and international travelers. Dining was also among the major activities reported by visitors, with 23% of domestic visitors participating in culinary or dining activities. QSRs benefit from this combination of permanent residents, tourists, students, workers, and seasonal visitors. Major metropolitan areas and tourism destinations support extensive demand for burgers, pizza, sandwiches, chicken, seafood, and regional cuisines. Operators are increasingly using mobile applications, digital ordering, drive-thru facilities, delivery, and loyalty programs to improve convenience. Menu localization, healthier products, seafood offerings, and Latin American-inspired foods also help restaurants serve Florida’s diverse consumer base.
Dense Population and High Demand for Convenient Dining In New York
New York remains a significant fast-food and QSR market because of its dense population, extensive business activity, tourism, and fast-paced consumer lifestyles. The state offers a particularly strong environment for restaurants that can provide meals quickly through counter service, takeaway, delivery, and digital ordering. New York City is especially important because consumers frequently seek convenient food options around workplaces, educational institutions, transportation hubs, residential neighborhoods, and tourist destinations. The state’s diverse population also creates demand for a broad range of cuisines, including burgers, sandwiches, pizza, Mexican food, Asian-inspired dishes, vegetarian meals, and premium fast-casual offerings. QSR operators increasingly rely on mobile ordering, delivery applications, self-service kiosks, loyalty programs, and compact restaurant formats to improve service efficiency. Customization and healthier menu choices are also becoming increasingly important as consumers seek greater control over ingredients and portion sizes. Competition encourages brands to introduce limited-time products, value meals, premium offerings, and localized menus. Continuous innovation in delivery, restaurant technology, and menu development therefore supports the long-term expansion of New York’s fast-food and quick-service restaurant market.
Texas Population Expansion and Strong Regional Food Culture
Texas is one of the most attractive U.S. markets for fast food and QSR operators because of its large and expanding population, major metropolitan areas, suburban development, and strong dining culture. Cities including Houston, Dallas, Austin, and San Antonio provide substantial customer bases supported by employment, residential construction, education, and tourism. Texas consumers also demonstrate strong demand for regionally influenced food, encouraging restaurants to offer Tex-Mex, barbecue-inspired products, spicy flavors, burgers, tacos, sandwiches, and customized meals. QSR operators benefit from Texas’s extensive road network and automobile-oriented development, which supports drive-thru formats and convenient pickup. Digital ordering, mobile payments, delivery applications, and loyalty programs are increasingly integrated into restaurant operations, improving customer convenience and allowing brands to generate additional orders. Expanding suburban communities also create opportunities for new restaurant locations near residential developments, shopping centers, and transportation corridors. National chains compete alongside regional brands and independent restaurants by introducing value meals, limited-time products, premium menu items, and localized flavors. This combination of population growth, convenience-oriented consumption, and strong food culture supports sustained market opportunities across Texas.
California Health-Conscious Consumers and Restaurant Innovation
California represents one of the most innovative and diverse markets for fast food and quick-service restaurants in the United States. Consumers increasingly combine demand for convenience with interest in healthier ingredients, sustainability, customization, and premium food experiences. These preferences encourage QSR operators to introduce plant-based proteins, fresh vegetables, salads, organic ingredients, lower-calorie meals, specialty beverages, and environmentally conscious packaging. California’s large and culturally diverse population also creates demand for international cuisines and fusion-inspired menu concepts. Major metropolitan areas such as Los Angeles, San Francisco, and San Diego have strong adoption of online ordering, delivery, mobile applications, digital payments, and restaurant loyalty programs. Technology is particularly important, with operators experimenting with automated kitchens, self-service ordering, advanced drive-thru systems, artificial intelligence, and personalized digital promotions. California also provides an important testing environment for emerging restaurant concepts before wider national expansion. Competition encourages operators to continually refresh menus and improve customer experiences. The combination of a large consumer base, technology adoption, health-oriented preferences, and culinary diversity makes California a strategically important market for fast-food and QSR companies.
United States Fast Food and Quick Services Restaurants Market Segments
Product
- Hamburgers
- Sandwich
- Pizza
- Mexican
- Others
States
- California
- Texas
- New York
- Florida
- Illinois
- Pennsylvania
- Ohio
- Georgia
- New Jersey
- Washington
- North Carolina
- Massachusetts
- Virginia
- Michigan
- Maryland
- Colorado
- Tennessee
- Indiana
- Arizona
- Minnesota
- Wisconsin
- Missouri
- Connecticut
- South Carolina
- Oregon
- Louisiana
- Alabama
- Kentucky
- Rest of United States
All the Key players have been covered from 5 Viewpoints:
- Overviews
- Key Person
- Recent Developments
- SWOT Analysis
- Revenue Analysis
Company Analysis
- McDonald's
- Pizza Hut, LLC
- KFC Corporation
- Domino’s Pizza, Inc.
- Taco Bell IP Holder, LLC
- Chick-fil-A, Inc.
- Starbucks
- Chipotle Mexican Grill
Report Details:
| Report Features | Details |
| Base Year |
2025 |
| Historical Period |
2022 - 2025 |
| Forecast Period |
2026 - 2034 |
| Market |
US$ Billion |
| Segment Covered |
Product, and States |
| States Covered |
|
| Companies Covered |
|
| Customization Scope |
20% Free Customization |
| Post-Sale Analyst Support |
1 Year (52 Weeks) |
| Delivery Format |
PDF and Excel through Email (We can also provide the editable version of the report in PPT/Word format on request) |
Key Questions Answered in This Report:
- What was the market size of the U.S. Fast Food & Quick Service Restaurant market in 2025?
- What is the projected market size of this industry by 2034?
- What is the expected compound annual growth rate (CAGR) for the market from 2025 to 2034?
- What are some key factors driving the growth of the U.S. Fast Food & Quick Service Restaurant market?
- How has digital ordering and technological advances influenced the industry?
- What challenges are faced by the U.S. Fast Food & Quick Service Restaurant market?
- Which product categories are covered in the market analysis (e.g., hamburgers, sandwiches, pizza)?
- What are some regional trends in the U.S. Fast Food & Quick Service Restaurant market?
- How is the growing demand for healthier menu options impacting the industry?
- Who are some of the major companies analyzed in the market report?
Customization Services available
- Analysis of Market Size and Its Segments
- More Company Profiles (Upto 10 without any additional cost):
- Additional Countries (Other than mentioned Countries):
- Region/Country Specific Reports:
- Market Entry Strategy:
- Region-Specific Market Dynamics:
- Regional Market Share Analysis:
- Trade Analysis:
- Production Insights:
- Others Customized Requests:
For more information contact our analysts.
Need More Assistance?
- Talk to our analysts to get more precious information on the current market trends.
- Include more countries and segments and customize the report based on the final requirement.
- Get a competitive advantage in your industry by knowing the report findings and making a positive impact on your revenues and operations.
- Our analysts are always ready to provide more help and pertinent information if you need any additional assistance.