Renub

    United States Desalination Market, Size, Forecast 2023-2028, Industry Trends, Growth, Share, Outlook, Impact of Inflation, Opportunity Company Analysis

    Excel: 8 Hours
    PDF: 24 Hours
    Apr 2023
    Pages: 140

    United States Desalination Market Outlook

    United States Desalination Market will reach to US$ 2.63 Billion by 2028 from US$ 1.63 Billion in 2022, according to Renub Research. The various techniques used for water purification include thermal and membrane processes. Water scarcity is one of the important issues to be looked upon in coming years, as only 3% of usable water is present on earth. Currently, desalination accounts for 1% of the drinking water across the globe. Apart from this, the other factors which are expected to drive the market growth are rising consumer awareness regarding clean water, regulations for water conservation and consumption, and increasing urbanization.

    united-states-desalination-market-share


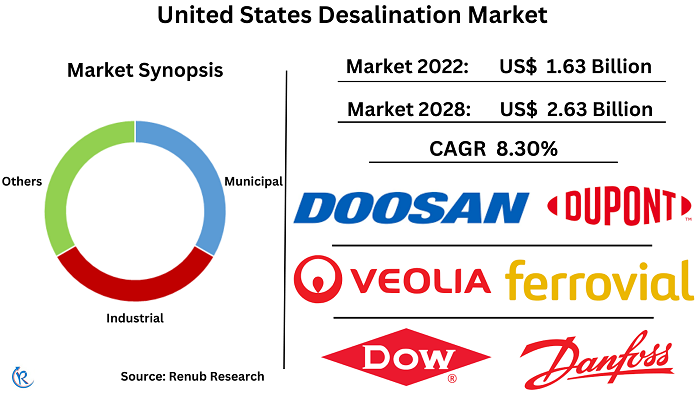
    The United States is facing a shortage of freshwater reserves, particularly in California, Florida, and Texas, which are the leading states in the US desalination market. These regions are deficient in surface water sources like rivers and lakes, necessitating the establishment of desalination plants to meet the increasing demand for water. The desalination market is experiencing a surge in demand, thanks to the continual progress in desalination technology. The viability of seawater and brackish water development in the United States is reliant on the implications of the water and energy nexus. As a result, United States Desalination Market will grow at a CAGR of 8.30% from 2023 to 2028.


    Reverse Osmosis will remain the market leader, owing to its benefits of easy processing, low installation cost

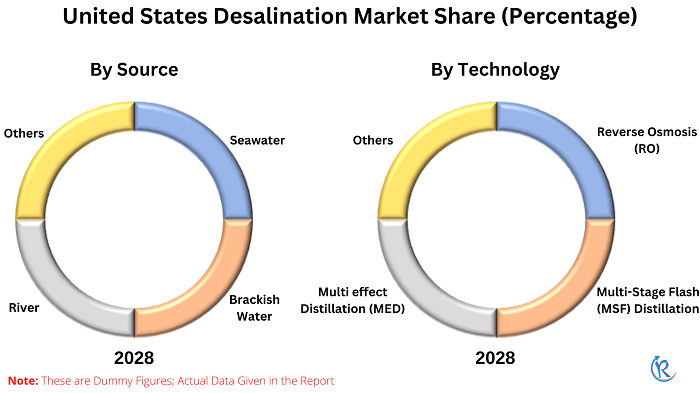
    Based on Technology, The U.S. desalination Market is divided into Reverse Osmosis (RO), Multi-Stage Flash (MSF) Distillation, Multi effect Distillation (MED) and Others. The United States reverse osmosis desalination market is of great importance due to the growing water scarcity and high demand for fresh water in areas such as California, Florida, and Texas. Reverse osmosis has emerged as a favored technology for producing freshwater from brackish or seawater, owing to its cost-effectiveness, low energy consumption, and superior efficiency. Furthermore, as a technologically advanced country, the US is driving innovation in desalination technology, which is further boosting the demand for reverse osmosis systems.


    United States Urban Population is growing, and Traditional Freshwater Sources are becoming scarcer, leading to an increasing demand for clean water in Urban Areas

    Based on Application, United States desalination industry was segmented into Municipal, Industrial and Others. Where Municipal application will capture most of the share due to the rising demand for clean water in urban areas, the United States municipal desalination market has gained significant importance. Municipalities are in need of dependable and sustainable water sources to meet the growing water demands of their populations, particularly in regions facing water scarcity, droughts, and the effects of climate change.

    Additionally, the US government has implemented policies and regulations to promote water conservation and management, resulting in a heightened emphasis on desalination as an alternative water supply source. As a consequence, the US municipal desalination market is projected to experience substantial growth in the coming years.

    The US Industrial desalination market is expanding due to various reasons industries need high-quality water, technological advancements, increasing regulations related to water quality and discharge standards and increasing concerns about climate change and droughts. These factors have contributed to the growth of the United States Industrial desalination market.


    Brackish Water Desalination demand in the United States Desalination market is expanding as Brackish Water is a more abundant source of Water compared to Seawater

    By Source, USA Desalination market is split into Sea Water, Brackish Water, River Water and Others. Over the forecast period, it is expected that the brackish water sector will experience a greater market share. This is due to the abundance of sources of brackish water that can be utilized to generate freshwater, which is anticipated to fuel the demand for brackish water desalination technology across the United States of America.

    In response to the drought conditions affecting the Colorado River, the United States is turning to desalination as a potential solution to address the river's shortfall and increase water supplies in the western region of the country. There is currently a significant demand for the river water desalination industry in the Western United States. While most desalination plants in the US use seawater or brackish water as their source, there is growing interest in exploring the feasibility of using river water desalination as a means of mitigating water scarcity in specific areas.


    Florida will contribute maximum market in United States Desalination Market

    By Region, United States desalination market divided into Florida, California, Texas, North Carolina, Iowa, Illinois, Arizona and Others. Florida is poised to make a significant contribution to the United States' desalination market. The state's rapidly growing population and tourism industry have led to a higher demand for water, prompting the exploration of alternative sources like desalination. Moreover, Florida's favorable geography and geology make it an ideal location for desalination, with an abundant supply of seawater that can be readily accessed and processed. The state has already invested heavily in desalination infrastructure, with numerous large-scale plants in operation, including the Tampa Bay Seawater Desalination Plant, which is one of the largest in the country and can produce up to 25 million gallons of freshwater per day.


    Key Company Analysis

    The United States' desalination market is characterized by a high degree of fragmentation, with numerous key players operating within the industry. These major players include Veolia Environnement SA, Doosan Enerbility Co. Ltd, Xylem, Ferrovial, S.A., DuPOnt, Wartsila, Danfoss, DOW, and several others.

    • Nine projects that offer innovative and novel water treatment technologies, which may potentially make previously unusable water available, have been awarded a total of US$ 1.69 Million in funding by the Bureau of Reclamation as of November 2022.
    • As of September 2022, the Department of Water Resources (DWR) has made available US$ 6 Million in financial aid to support desalination projects that aim to establish new sources of local water supplies in California.


    Renub Research latest Report "United States Desalination Market by Technology (Reverse Osmosis(RO), Multi-Stage Flash(MSF) Distillation, Multi effect Distillation (MED) and Others), Application (Municipal, Industrial and Others), By Source (Sea Water, Brackish Water, River Water and Others), Region (Florida, California, Texas, North Carolina, Iowa, Illinois, Arizona and Others), Company Analysis (Veolia Environment SA, Doosan Enerbility Co. Ltd, Xylem, Ferrovial, S.A.,DuPOnt, Wartsila, Danfoss and DOW)." studies on United States Water Desalination Industry.

    united-states-desalination-market


    Technology – USA Desalination Market studied from 4 Types of Technology

    1.    Reverse Osmosis
    2.    Multi-stage Filtration
    3.    Multi-effect Distillation
    4.   Others


    Application – USA Desalination Market breakup from 3 viewpoints

    1.    Municipal
    2.    Industrial
    3.    Others


    Source – USA Desalination Market breakup from 4 viewpoints

    1.    Sea Water
    2.    Brackish Water
    3.    River Water 
    4.    Others


    Region – Desalination Market breakup from 8 viewpoints

    1.    Florida
    2.    California
    3.    Texas
    4.    North Carolina
    5.    Iowa
    6.    Illinois
    7.    Arizona
    8.    Others


    All the 8 Companies have been covered from 3 viewpoints

    •    Overviews
    •    Recent Developments
    •    Revenues


    Company Analysis

    1.    Veolia Environnement SA
    2.    Doosan Enerbility Co. Ltd
    3.    Xylem
    4.    Ferrovial, S.A.
    5.    DuPOnt
    6.    Wartsila
    7.    Danfoss
    8.    DOW


    Report Details:

    Report Features Details
    Base Year 2022
    Historical Period 2018 - 2022
    Forecast Period 2023 - 2028
    Market US$ Billion
    Segment Covered Technology, Application, Source, and Region
    Region Covered Florida, California, Texas, North Carolina, Iowa, Illinois, Arizona and Others
    Companies Covered Veolia Environment SA, Doosan Enerbility Co. Ltd, Xylem, Ferrovial, S.A.,DuPOnt, Wartsila, Danfoss and DOW
    Customization Scope 20% Free Customization
    Post-Sale Analyst Support 1 Year (52 Weeks)
    Delivery Format PDF and Excel through Email (We can also provide the editable version of the report in PPT/Word format on request)

    1.    Introduction

    2.    Research & Methodology

    3.    Executive Summary

    4.    Market Dynamics

    4.1    Growth Drivers
    4.2    Challenges


    5.    PESTLE Analysis

    5.1    Political
    5.2    Economic
    5.3    Social
    5.4    Technological
    5.5    Legal
    5.6    Environmental


    6.    United States Desalination Market

    7.    Market Share – United States Desalination Market

    7.1    By Technology
    7.2    By Application
    7.3    By Source
    7.4    By Region


    8.    Technology – United States Desalination Market

    8.1    Reverse Osmosis(RO)
    8.2    Multi-Stage Flash(MSF) Distillation
    8.3    Multi effect Distillation (MED)
    8.4    Others


    9.    Application – United States Desalination Market

    9.1    Municipal
    9.2    Industrial
    9.3    Others


    10.    Source – United States Desalination Market

    10.1    Seawater
    10.2    Brackish Water
    10.3    River
    10.4    Other


    11.    Region – United States Desalination Market

    11.1    Florida
    11.2    California
    11.3    Texas
    11.4    North Carolina
    11.5    Iowa
    11.6    Illinois
    11.7    Arizona
    11.8    Others


    12.    Key Players Analysis

    12.1    Veolia Environnement SA

    12.1.1    Company overview
    12.1.2    Sales Analysis
    12.1.3    Recent Development

    12.2    Doosan Enerbility Co. Ltd

    12.2.1    Company overview
    12.2.2    Sales Analysis
    12.2.3    Recent Development

    12.3    Xylem

    12.3.1    Company overview
    12.3.2    Sales Analysis
    12.3.3    Recent Development

    12.4    Ferrovial, S.A.

    12.4.1    Company overview
    12.4.2    Sales Analysis
    12.4.3    Recent Development

    12.5    DuPont

    12.5.1    Company overview
    12.5.2    Sales Analysis
    12.5.3    Recent Development

    12.6    Wartsila

    12.6.1    Company overview
    12.6.2    Sales Analysis
    12.6.3    Recent Development

    12.7    Danfoss

    12.7.1    Company overview
    12.7.2    Sales Analysis
    12.7.3    Recent Development

    12.8    DOW

    12.8.1    Company overview
    12.8.2    Sales Analysis
    12.8.3    Recent Development


    List of Figures:

    Figure-01:    United States – Desalination Market (Billion US$), 2018 – 2022
    Figure-02:    United States – Forecast for Desalination Market (Billion US$), 2023 – 2028
    Figure-03:    Technology – Reverse Osmosis(RO) Market (Million US$), 2018 – 2022
    Figure-04:    Technology – Forecast for Reverse Osmosis(RO) Market (Million US$), 2023 – 2028
    Figure-05:    Technology – Multi-Stage Flash(MSF) Distillation Market (Million US$), 2018 – 2022
    Figure-06:    Technology – Forecast for Multi-Stage Flash(MSF) Distillation Market (Million US$), 2023 – 2028
    Figure-07:    Technology – Multi effect Distillation (MED) Market (Million US$), 2018 – 2022
    Figure-08:    Technology – Forecast for Multi effect Distillation (MED) Market (Million US$), 2023 – 2028
    Figure-09:    Technology – Others Market (Million US$), 2018 – 2022
    Figure-10:    Technology – Forecast for Others Market (Million US$), 2023 – 2028
    Figure-11:    Application – Municipal Market (Million US$), 2018 – 2022
    Figure-12:    Application – Forecast for Municipal Market (Million US$), 2023 – 2028
    Figure-13:    Application – Industrial Market (Million US$), 2018 – 2022
    Figure-14:    Application – Forecast for Industrial Market (Million US$), 2023 – 2028
    Figure-15:    Application – Others Market (Million US$), 2018 – 2022
    Figure-16:    Application – Forecast for Others Market (Million US$), 2023 – 2028
    Figure-17:    Source – Seawater Market (Million US$), 2018 – 2022
    Figure-18:    Source – Forecast for Seawater Market (Million US$), 2023 – 2028
    Figure-19:    Source – Brackish Water Market (Million US$), 2018 – 2022
    Figure-20:    Source – Forecast for Brackish Water Market (Million US$), 2023 – 2028
    Figure-21:    Source – River Market (Million US$), 2018 – 2022
    Figure-22:    Source – Forecast for River Market (Million US$), 2023 – 2028
    Figure-23:    Source – Other Market (Million US$), 2018 – 2022
    Figure-24:    Source – Forecast for Other Market (Million US$), 2023 – 2028
    Figure-25:    Florida – Desalination Market (Million US$), 2018 – 2022
    Figure-26:    Florida – Forecast for Desalination Market (Million US$), 2023 – 2028
    Figure-27:    California – Desalination Market (Million US$), 2018 – 2022
    Figure-28:    California – Forecast for Desalination Market (Million US$), 2023 – 2028
    Figure-29:    Texas – Desalination Market (Million US$), 2018 – 2022
    Figure-30:    Texas – Forecast for Desalination Market (Million US$), 2023 – 2028
    Figure-31:    North Carolina – Desalination Market (Million US$), 2018 – 2022
    Figure-32:    North Carolina – Forecast for Desalination Market (Million US$), 2023 – 2028
    Figure-33:    Iowa – Desalination Market (Million US$), 2018 – 2022
    Figure-34:    Iowa – Forecast for Desalination Market (Million US$), 2023 – 2028
    Figure-35:    Illinois – Desalination Market (Million US$), 2018 – 2022
    Figure-36:    Illinois – Forecast for Desalination Market (Million US$), 2023 – 2028
    Figure-37:    Arizona – Desalination Market (Million US$), 2018 – 2022
    Figure-38:    Arizona – Forecast for Desalination Market (Million US$), 2023 – 2028
    Figure-39:    Others – Desalination Market (Million US$), 2018 – 2022
    Figure-40:    Others – Forecast for Desalination Market (Million US$), 2023 – 2028
    Figure-41:    Veolia Environnement SA – Global Revenue Market (Billion US$), 2018 – 2022
    Figure-42:    Veolia Environnement SA – Forecast for Global Revenue Market (Billion US$), 2023 – 2028
    Figure-43:    Doosan Enerbility Co. Ltd – Global Revenue Market (Billion US$), 2018 – 2022
    Figure-44:    Doosan Enerbility Co. Ltd – Forecast for Global Revenue Market (Billion US$), 2023 – 2028
    Figure-45:    Xylem – Global Revenue Market (Billion US$), 2018 – 2022
    Figure-46:    Xylem – Forecast for Global Revenue Market (Billion US$), 2023 – 2028
    Figure-47:    Ferrovial, S.A. – Global Revenue Market (Billion US$), 2018 – 2022
    Figure-48:    Ferrovial, S.A. – Forecast for Global Revenue Market (Billion US$), 2023 – 2028
    Figure-49:    DuPont – Global Revenue Market (Billion US$), 2018 – 2022
    Figure-50:    DuPont – Forecast for Global Revenue Market (Billion US$), 2023 – 2028
    Figure-51:    Wartsila – Global Revenue Market (Billion US$), 2018 – 2022
    Figure-52:    Wartsila – Forecast for Global Revenue Market (Billion US$), 2023 – 2028
    Figure-53:    Danfoss – Global Revenue Market (Billion US$), 2018 – 2022
    Figure-54:    Danfoss – Forecast for Global Revenue Market (Billion US$), 2023 – 2028
    Figure-55:    DOW – Global Revenue Market (Billion US$), 2018 – 2022
    Figure-56:    DOW – Forecast for Global Revenue Market (Billion US$), 2023 – 2028


    List of Tables:

    Table-01:    United States – Desalination Market Share by Technology (Percent), 2018 – 2022
    Table-02:    United States – Forecast for Desalination Market Share by Technology (Percent), 2023 – 2028
    Table-03:    United States – Desalination Market Share by Application (Percent), 2018 – 2022
    Table-04:    United States – Forecast for Desalination Market Share by Application (Percent), 2023 – 2028
    Table-05:    United States – Desalination Market Share by Source (Percent), 2018 – 2022
    Table-06:    United States – Forecast for Desalination Market Share by Source (Percent), 2023 – 2028
    Table-07:    United States – Desalination Market Share by Region (Percent), 2018 – 2022
    Table-08:    United States – Forecast for Desalination Market Share by Region (Percent), 2023 – 2028

    • Description
      Price
    • Chapter 1 & 4     Pages : 4
      $200
    • Chapter 5     Pages : 6
      $200
    • Chapter 6     Pages : 3
      $200
    • Chapter 8     Pages : 8
      $300
    • Chapter 9     Pages : 6
      $300
    • Chapter 10     Pages : 8
      $300
    • Chapter 11     Pages : 16
      $600
    • Chapter 12.1     Pages : 5
      $150
    • Chapter 12.2     Pages : 5
      $150
    • Chapter 12.3     Pages : 5
      $150
    • Chapter 12.4     Pages : 5
      $150
    • Chapter 12.5     Pages : 5
      $150
    • Chapter 12.6     Pages : 5
      $150
    • Chapter 12.7     Pages : 5
      $150
    • Chapter 12.8     Pages : 5
      $150

    Related Reports