Global OTC Artificial Tears Market Size and Forecast 2025-2033
Buy NowGlobal OTC Artificial Tears Market Size and Forecast 2025-2033
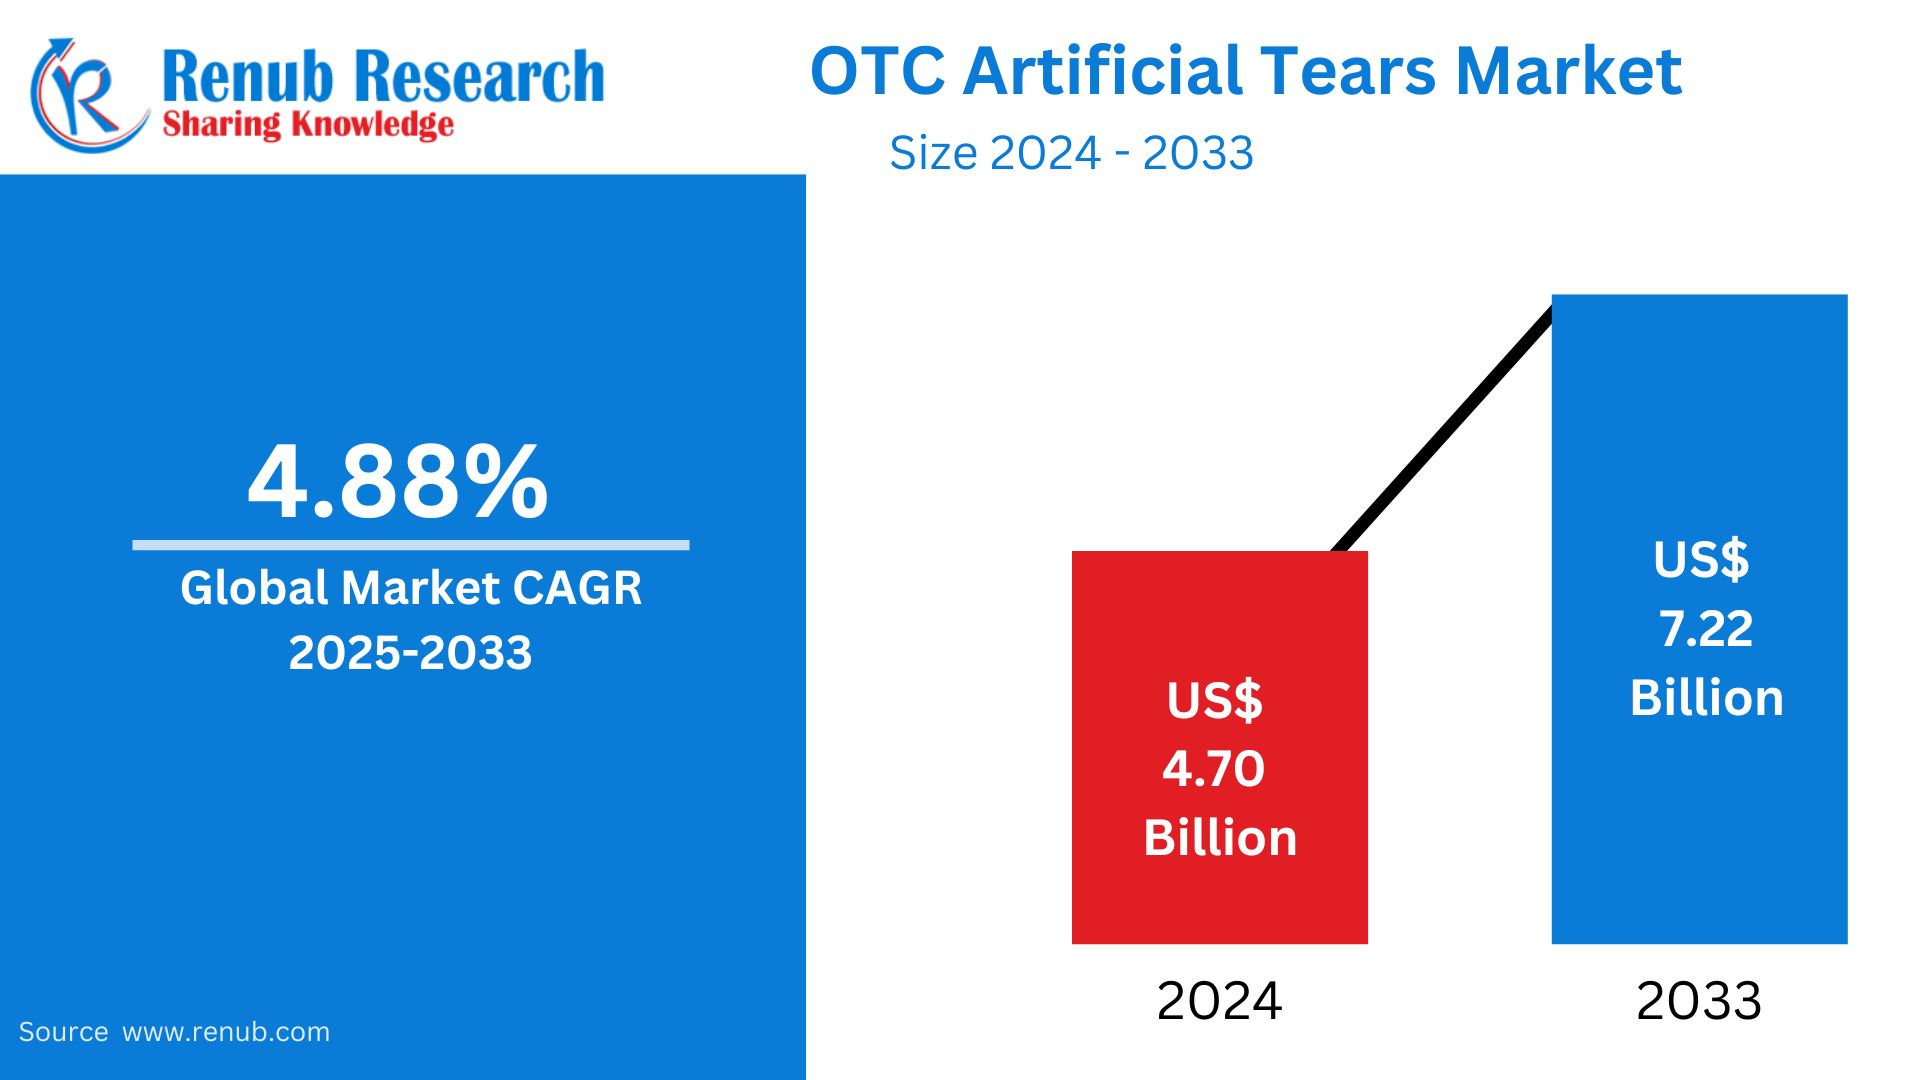
OTC Artificial Tears market is expected to reach US$ 7.22 billion by 2033 from US$ 4.70 billion in 2024, with a CAGR of 4.88% from 2025 to 2033. Some of the main drivers driving the market include the expanding number of public access places, the growing number of ambulance services, and the rising frequency of cardiac disorders such coronary artery disease and arrhythmias.
The report OTC Artificial Tears Market & Forecast covers by Product Types (Solution, Ointment, Emulsion, Gel, Spray Solution, and Suspensions), Application (Dry Eye Syndrome, Allergies, Infections, UV and Blue Light Protection, Contact Lens Moisture Retention, and Others), Distribution Channel (Drugstores & Supermarkets, Online Pharmacies, Retail Pharmacies, and Others), Regions and Company Analysis 2025-2033
OTC Artificial Tears Market Overview
Artificial tears, often known as lubricant eye drops, are used to relieve dryness and irritation that are mostly brought on by insufficient tear production. In addition to treating a variety of eye conditions like allergies, infections, and UV and blue light protection, these artificial tears are designed to stimulate natural tears. The contact lens was also moistened with it.
The rise in the prevalence of dry eye syndrome and eye procedures has made the creation of efficient over-the-counter artificial tears imperative. Depending on the indication, over-the-counter eye drops are given in a variety of dosage forms, including solution, ointment, emulsion, gel, spray solution, and suspension. Over the years, market participants have concentrated on developing new methods for the production of over-the-counter artificial tears, such as recombinant, small molecule, and biologic technologies. The market for over-the-counter eye drops is expected to grow as a result of rising R&D expenditures for the creation of novel artificial tears for the treatment of dry eye syndrome, allergies, and UV and blue light protection, as well as an aging population. The population's growing awareness of dry eye condition also contributes to the market's expansion.
For example, in February 2021, the eye health goods manufacturer Bausch & Lomb, Inc. introduced a new Alaway preservative. Free antihistamine eye drops were given out to relieve allergen-induced eye irritation. It is the first antihistamine eye drop solution to be sold over-the-counter.
Growth Drivers for the OTC Artificial Tears Market
Increase in the number of elderly people
The global market for over-the-counter eye drops is growing due to the aging of the world's population. The elderly are most likely to suffer from eye conditions such dry eye, glaucoma, age-related macular degeneration, cataracts, and presbyopia. For instance, statistics released by the United Nations indicates that there were over 703 million individuals over 65 in 2019. The percentage of people over 65 who are geriatric grew from 6% in 1990 to 9% in 2019. Between 5% and 30% of the senior population suffers from dry eye. The market for over-the-counter artificial tears is growing because to an aging population.
Increased incidence of allergic conjunctivitis and des
One of the main factors propelling the market expansion is the availability of various dose forms of over-the-counter artificial tears for the diagnosis, treatment, and prevention of patients with dry eye condition. According to the American Academy of Ophthalmology (AAO), 1.68 million men and 3.2 million women received a dry eye syndrome diagnosis in 2019. A prolonged duration of untreated dry eye condition might result in infection, blurred vision, and sensitivity. Furthermore, compared to high-income countries, the incidence rate of distance vision impairment is projected to be four times higher in low- and middle-income countries.
Many formulations for treating dry eye syndrome, such as eye drops, solutions, gels, suspensions, and ointments, also contain over-the-counter artificial tears. Medication distribution to patients is the responsibility of the distribution channels, which include drug stores, internet pharmacies, and hospital pharmacies. Furthermore, one of the main reasons of irritation in the eyes is allergic conjunctivitis. About 40% of people worldwide will receive a diagnosis of allergic conjunctivitis in 2021, predicts StartPearls. Therefore, the market for over-the-counter eye drops is growing due to the quick growth of dry eye syndrome and allergic conjunctivitis.
Rising Air Pollution and Environmental Factors
The prevalence of dry eye symptoms is rising due in large part to environmental causes and rising air pollution, which in turn fuels the demand for artificial tears. Pollutant exposure can cause dryness, redness, and irritation in the eyes. Examples of these pollutants include dust, smoke, and automobile emissions. Furthermore, these problems are made worse by dry weather and the frequent use of air conditioning, which lowers humidity levels and aggravates eye discomfort. Artificial tears offer a practical and efficient way to reduce discomfort and maintain eye lubrication for people who live in polluted areas or work in air-conditioned offices. The need for artificial tears is predicted to increase as environmental conditions continue to affect eye health, particularly in urban areas.
Challenges in the OTC Artificial Tears Market
Side Effects and Preservatives
Preservatives are added to some artificial tear solutions to assist extend their shelf life, but extended use may result in irritation or allergic responses. The presence of preservatives might cause discomfort, dryness, and even more severe eye irritation for people who wear contact lenses or have sensitive eyes. Because preservative-free artificial tears are thought to be kinder and safer for long-term use, this problem has led to an increase in demand for them. However, because preservative-free formulas need specialized packaging and quicker turnover to guarantee product freshness, their manufacturing can be more complicated and expensive. Therefore, even if preservative-free options provide a solution for consumers who are sensitive, their greater production costs may result in a higher price for these products on the market.
Competition from Prescription Alternatives
Preservatives are added to some artificial tear solutions to assist extend their shelf life, but extended use may result in irritation or allergic responses. The presence of preservatives might cause discomfort, dryness, and even more severe eye irritation for people who wear contact lenses or have sensitive eyes. Because preservative-free artificial tears are thought to be kinder and safer for long-term use, this problem has led to an increase in demand for them. However, because preservative-free formulas need specialized packaging and quicker turnover to guarantee product freshness, their manufacturing can be more complicated and expensive. Therefore, even if preservative-free options provide a solution for consumers who are sensitive, their greater production costs may result in a higher price for these products on the market.
Solutions are a leading product category in the OTC artificial tears market
The global OTC artificial tears market is fragmented into Solution, Ointment, Emulsion, Gel, Spray Solution, and Suspensions by product type. Solutions are among the dominant product types in the global over-the-counter (OTC) artificial tears market. This is because of their versatility and simplicity of use. These solutions quickly relieve numerous eye discomforts, including dryness and irritation, making them famous among customers searching for immediate comfort. Further, their liquid form allows for easy utility, catering to many users, such as those with sensitive eyes or contact lens wearers. As a result, solutions maintain an outstanding position in the OTC eye ointments market.
Dry eye syndrome is set for significant growth in OTC eye ointments market
Dry eye syndrome is poised for significant growth in the over-the-counter (OTC) eye ointments market. This surge is attributed to growing awareness and diagnosis of the situation, fueled by elements like growing elderly populations, increased display screen time, and environmental factors. As dry eye syndrome becomes more prevalent globally, the demand for OTC artificial tears, presenting convenient relief from symptoms like irritation and pain, is predicted to bounce. Thus, dry eye syndrome is expected to guide market growth as consumers seek accessible solutions for coping with this common ocular circumstance.
Drugstores and supermarkets may dominate distribution channels in OTC eye gels market
Drugstores and Supermarkets could become the leading segments in the global over-the-counter (OTC) eye gels market. This is due to their extensive accessibility and comfort. These shops offer various artificial tear products, catering to a large client base seeking immediate relief for ocular soreness. Further, the familiarity and agreement with drugstores and supermarkets make them preferred destinations for getting healthcare products like artificial tears. Thus, their prominence in distribution channels solidifies their leading role in the market.
OTC Eye Drops Market Overview by Regions
By country, the global OTC artificial tears market is divided into North America (United States, Canada), Europe (France, Germany, Italy, Spain, United Kingdom, Belgium, the Netherlands, and Turkey), Asia Pacific (China, Japan, India, Australia, South Korea, Thailand, Malaysia, Indonesia, and New Zealand), Latin America (Brazil, Mexico, and Argentina), Middle East & Africa (South Africa, Saudi Arabia, and the UAE). The United States eye drops market is flourishing.
United States OTC Artificial Tears Market
The market for over-the-counter artificial tears in the US is expanding steadily due to an aging population, rising incidences of dry eye disease, and digital eye strain. A common treatment for mild to moderate dry eye symptoms brought on by the environment, extended screen time, or aging is the use of artificial tears. Growing consumer knowledge and the availability of a large variety of products, such as contact lens wearing alternatives and formulas devoid of preservatives, are also helping the industry. The main distribution channels are pharmacies, supermarkets, and e-commerce sites; their accessibility is what drives market growth. A problem, though, is the competition from prescription-only remedies for long-term dry eye disorders, such Restasis. Consumer interest and market expansion are sustained by advancements in product compositions and packaging.
Furthermore, it is expected that the rise in eye procedures will support the region's supremacy during the research period. For instance, the Centers for Disease Control and Prevention (CDC) reported that over 4.2 million Americans aged 40 and over suffer from low vision or legal blindness. The two main causes of blindness in the United States are glaucoma and cataracts.
United Kingdom OTC Artificial Tears Market
Due to an increase in dry eye syndrome instances, especially among older persons and those who use digital gadgets regularly, the market for over-the-counter eye drops is expanding in the United Kingdom. The need for over-the-counter eye lubricants is rising as a result of environmental variables including air pollution and dry weather that aggravate eye irritation. The market is expanding as a result of consumers' growing awareness of the advantages of eye ointments and the availability of customized, preservative-free solutions for contact lens wearers. Artificial tears are readily available through major distribution channels, including pharmacies, supermarkets, and internet merchants. In severe circumstances, the market may see a decline in demand for over-the-counter (OTC) medications due to competition from prescription alternatives for chronic disorders. All things considered, the market is expanding due to formulation innovation and rising consumer awareness.
India OTC Eye Gels Market
The market for over-the-counter eye gels in India is growing quickly due to environmental concerns including pollution and climate change, as well as the rising incidence of dry eye and digital eye strain. Eye discomfort has increased, especially among urban populations, as a result of the increased use of computers, smartphones, and air conditioners. The market for artificial tears is rising as a result of consumers' growing awareness of over-the-counter eye care products, particularly those without preservatives and options for contact lens wearers. In India, the primary distribution channels are pharmacies, drugstores, and internet sites. Changing lifestyles and an aging population can have an impact on the market. However, the industry is challenged by restricted access to healthcare in remote areas and competition from prescription therapies for persistent dry eye. The market nevertheless has a high potential for growth in spite of this.
Saudi Arabia OTC Eye Drops Market
The market for over-the-counter eye drops in Saudi Arabia is expanding as a result of a rise in occurrences of dry eye syndrome, which is impacted by regionally prevalent environmental variables such dust, dry weather, and air conditioning. The need for artificial tears is also increased by the aging population and the growing use of digital devices, which both lead to increased eye irritation and pain. Preservative-free and contact lens-friendly formulations are growing increasingly popular as consumers become more aware of over-the-counter (OTC) options. In Saudi Arabia, the main distribution channels are pharmacies, drugstores, and internet retail sites. A problem, though, is the competition from prescription medications for long-term dry eye disorders. Notwithstanding this, the market is expected to expand due to advancements in product formulations and heightened consumer consciousness.
OTC Artificial Tears Market Segmentation
By Product Type
- Solution
- Ointment
- Emulsion
- Gel
- Spray Solution
- Suspensions
Application
- Dry Eye Syndrome
- Allergies
- Infections
- UV and Blue Light Protection
- Contact Lens Moisture Retention
- Others
By Distribution Channel
- Drugstores & Supermarkets
- Online Pharmacies
- Retail Pharmacies
- Others
By Region
North America
- United States
- Canada
Europe
- France
- Germany
- Italy
- Spain
- United Kingdom
- Belgium
- Netherlands
- Turkey
Asia Pacific
- China
- Japan
- India
- South Korea
- Thailand
- Malaysia
- Indonesia
- Australia
- New Zealand
Latin America
- Brazil
- Mexico
- Argentina
Middle East & Africa
- Saudi Arabia
- UAE
- South Africa
All the Key players have been covered
• Overview
• Recent Development
• Revenue Analysis
Competitive Landscape
- AbbVie Inc.
- Akorn Inc.
- Alcon
- Bausch Health Companies Inc.
- Johnson & Johnson
- Nicox S.A.
- Novartis AG
- Santen Pharmaceutical Co. Ltd.
- Sun Pharmaceutical Industries Ltd.
Report Details:
| Report Features | Details |
| Base Year |
2024 |
| Historical Period |
2020 - 2024 |
| Forecast Period |
2025 - 2033 |
| Market |
US$ Billion |
| Segment Covered |
Product Type, Application, Distribution Channel, and Countries |
| Countries Covered |
|
| Companies Covered | 1. AbbVie Inc. 2. Akorn Inc. 3. Alcon 4. Bausch Health Companies Inc. 5. Johnson & Johnson 6. Nicox S.A. 7. Novartis AG 8. Santen Pharmaceutical Co. Ltd. 9. Sun Pharmaceutical Industries Ltd. |
| Customization Scope |
20% Free Customization |
| Post-Sale Analyst Support |
1 Year (52 Weeks) |
| Delivery Format |
PDF and Excel through Email (We can also provide the editable version of the report in PPT/Word format on request) |
Customization Services available
- Analysis of Market Size and Its Segments
- More Company Profiles (Upto 10 without any additional cost):
- Additional Countries (Other than mentioned Countries):
- Region/Country Specific Reports:
- Market Entry Strategy:
- Region-Specific Market Dynamics:
- Regional Market Share Analysis:
- Trade Analysis:
- Production Insights:
- Others Customized Requests:
For more information contact our analysts.
Need More Assistance?
- Talk to our analysts to get more precious information on the current market trends.
- Include more countries and segments and customize the report based on the final requirement.
- Get a competitive advantage in your industry by knowing the report findings and making a positive impact on your revenues and operations.
- Our analysts are always ready to provide more help and pertinent information if you need any additional assistance.