GCC Smart Home Market Size and Share Analysis - Growth Trends and Forecast Report 2025-2033
Buy NowGCC Smart Home Market Trends & Summary
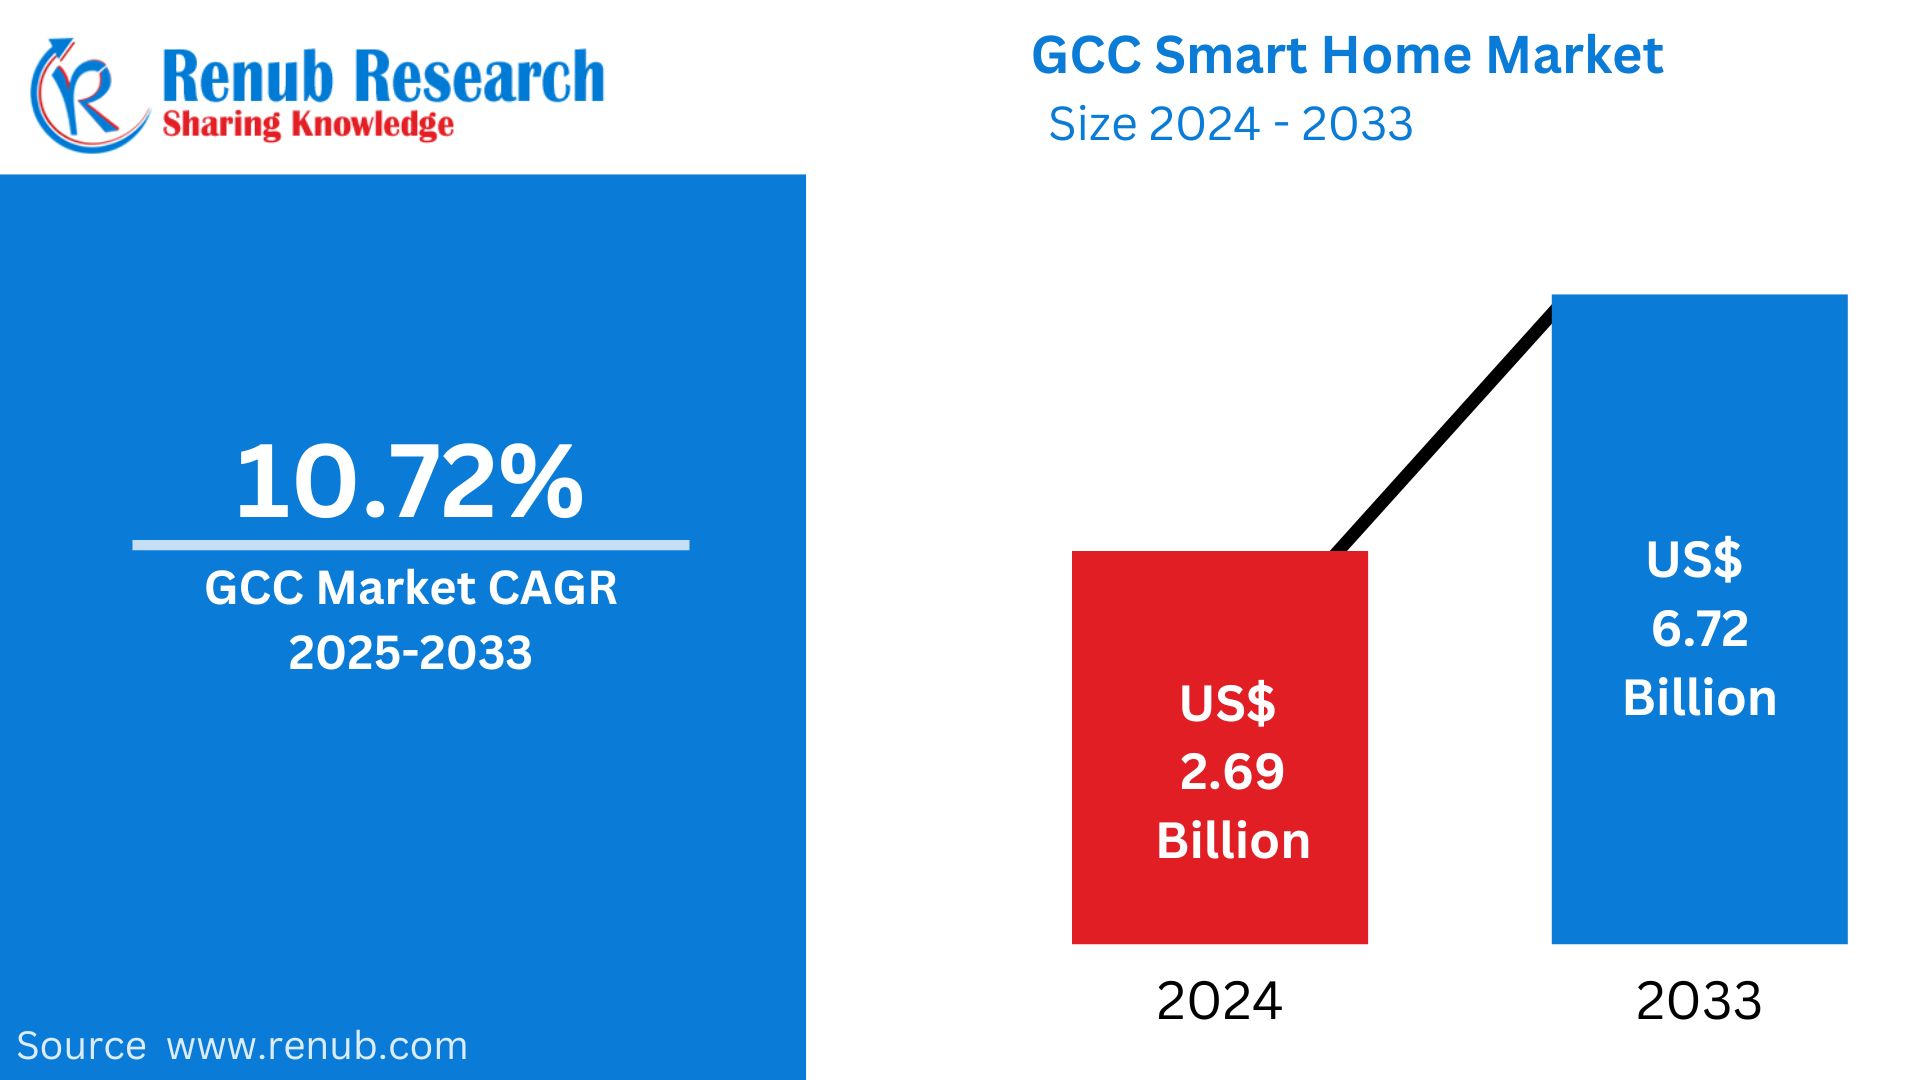
The GCC Smart Home Market is anticipated to reach US$ 6.72 billion in 2033 from US$ 2.69 billion in 2024 at a growth rate of 10.72% from 2025 onwards. The escalating usage of home automation, artificial intelligence-based security solutions, Internet of Things-based devices, and energy-efficient offerings drives the demand. Increased urbanization and efforts of governments in implementing smart city concepts further foster the growth in the market during the forecast period.
The report GCC Smart Home Market Forecast covers by Application (Comfort and Lighting, Control and Connectivity, Energy Management, Home Entertainment, Security, Smart Appliance), Country (UAE, Saudi Arabia, Qatar, Kuwait, Bahrain, Oman), Company Analysis 2025-2033.
GCC Smart Home Market Forecasts
A smart home refers to a dwelling with Internet of Things (IoT) connected devices that support remote management and automation of home operations like lighting, heating, cooling, security, and entertainment. The smart home combines artificial intelligence (AI), voice recognition, and intelligent sensors to maximize convenience, security, and energy savings.
Smart home take-up is on the rise in the GCC area as a result of fast-growing urbanization, high disposable income, and governmental smart city schemes. Home automation systems assist users in monitoring consumption, which leads to cost saving and sustainability with harsh climate conditions. Security services like smart monitoring cameras, fingerprint locks, and motion sensors create security. Automated appliances, AI-based personal assistants, and smart entertainment systems elevate living standards. With growing demand for luxury lifestyle and technology, the GCC smart home market continues to grow, turning homes into smart, efficient, and safe living areas.
Growth Drivers in the GCC Smart Home Market
Increased Smart City Programs and Government Encouragement
The GCC governments encourage innovative city development as part of Vision 2030 programs in Saudi Arabia, the UAE, and other countries. Investments in digital infrastructure, energy-efficient buildings, and IoT adoption are driving the expansion of the smart home market. Policies for sustainable urban development and AI integration also contribute to further adoption of smart security, lighting, and automation systems in residential sectors. The Gulf Cooperation Council (GCC) has witnessed impressive growth and advancement in rearchitecting and digitalizing cities in a wide range of sectors, such as finance, energy, transportation, and government services. Some national programs, like Saudi Arabia's Vision 2030 and Qatar's National Vision 2030, are pushing cities in the region to pursue digital strategies for smarter urban growth. But that makes them more susceptible to cyberattacks. The GCC has some of the highest cyber-incident expenditures in the world, with an average of $6.93 million, higher than the world average of $4.24 million. In turn, GCC nations are increasing their investments in cyber-resilience, with the Saudi government investing $2 billion by 2025.
Growing Consumer Demand for Energy Efficiency
Due to hot weather and high energy usage for air conditioning, smart home solutions to maximize the power usage are being sought by GCC residents. Smart thermostats, automated lighting, and energy-efficient appliances save electricity bills. The growth of solar-powered smart homes is also driving market growth. Artificial intelligence-based home management systems make it easy to track and manage energy usage, promoting sustainability. Sept 2024, ABB India has introduced ABB-free@home®, a home automation solution for comfort, security, and energy efficiency. A wireless solution, ABB-free@home allows users to control a range of devices such as appliances, third-party devices, and electric vehicle chargers with one system.
Increased Use of IoT and AI-Based Devices
The growing penetration of Internet of Things (IoT) devices, artificial intelligence (AI)-based assistants, and 5G connectivity is revolutionizing smart home experiences. Smart home devices such as voice-controlled lighting, security cameras, and automated appliances are gaining popularity. The presence of smart hubs and centralized home management apps facilitates easy integration of home automation, enhancing convenience and security for GCC residents. Sept 2024, Honeywell is creating an AI-powered Multi-Modal Intelligent Agent for its Qualcomm Technologies-powered mobile devices. The agent will allow workers and customers in retail and distribution to communicate with handheld devices through voice, images, and barcodes.
Challenges in the GCC Smart Home Market
High Initial Investment and Installation Costs
Even with increasing demand, the expense of smart home devices and installation is still a challenge. High-end AI-based home automation systems, IoT security systems, and smart appliances are expensive. Moreover, most consumers are reluctant to embrace smart home technology because of long-term return on investment issues and maintenance expenses.
Cybersecurity and Data Privacy Concerns
With greater connectivity, the threat of cyberattacks and data breaches in smart homes is increasing. IoT-connected devices are susceptible to hacking, causing privacy concerns. Consumers are concerned about unauthorized access to home security systems, leaks of personal data, and risks of AI surveillance. Robust cybersecurity practices and data encryption solutions are necessary to build consumer confidence in the market.
GCC Smart Home Comfort and Lighting Market
The comfort and lighting segment also plays a considerable role in the GCC smart home market. Automated lighting systems, motion-sensor LED lights, and AI-powered temperature control solutions are in great demand due to increasing energy prices. Smart thermostats, dimmable lighting, and voice-controlled living spaces are increasingly being used by consumers for improved convenience. The solutions offer luxury and help save energy and fulfill sustainability objectives in the region. Dec 2024, Flashnet, in partnership with Saudi Delta Group, has commissioned a smart street lighting scheme in Jeddah, Saudi Arabia. The scheme encompasses 5,700 inteliLIGHT® controllers based on LoRaWAN technology to achieve greater energy efficiency, reduce maintenance expense, and ensure permanent operation with solar-powered backup.
GCC Smart Home Home Entertainment Market
The GCC smart home entertainment industry is expanding because consumers are increasingly seeking AI-based home theaters, intelligent TVs, and multi-room sound systems. Users are buying voice-controlled streaming players, intelligent speakers, and deep surround sound setups. Access to high-speed broadband and 5G connectivity drives entertainment to higher levels, boosting automated home theaters, AI-recommended content selection, and virtual reality games into mainstream trends.
GCC Smart Home Security Market
Security is a top priority in the GCC smart home sector, propelling demand for AI-based surveillance cameras, biometric door locks, and motion detectors. Smart security systems offer real-time monitoring, facial recognition, and remote control access via mobile apps. Due to growing anxiety about home intrusions and invasion of privacy, integrated smart security networks with cloud storage and emergency response systems are becoming imperative in urban and high-end housing complexes.
Country-Specific Smart Home Markets in the GCC
UAE Smart Home Market
The UAE dominates the GCC smart home market with fast-paced digitalization, high disposable incomes, and robust smart city programs. Dubai's emphasis on AI-based infrastructure, energy-efficient structures, and 5G-integrated smart homes is encouraging residents to embrace automated lighting, smart kitchens, and AI security solutions. The presence of international technology firms and domestic innovations facilitates swift growth.
Saudi Arabia Smart Home Market
Saudi Vision 2030 program is the key driver for the smart home industry with greater investments in automated homes, AI-based security solutions, and green homes. High demand for intelligent surveillance, home entertainment systems, and networked appliances transforms city living. Large-scale projects such as Neom City are embedding cutting-edge IoT-based smart home solutions to deliver sustainable living. December 2023 - Aqara and iot squared have entered into an MoU for the promotion of ICT and IoT in Saudi Arabia for the support of Vision 2030. Aqara, being a company with smart home solutions, will partner with iot squared—a joint venture between stc Group and the Public Investment Fund—to provide IoT products and services to customers. The emphasis is on creating tailored smart home solutions and speeding up IoT adoption to drive innovation and quality of life in the nation.
Qatar Smart Home Market
With future FIFA World Cup legacies and smart city initiatives, Qatar's smart home market is experiencing fast-paced adoption. Luxury smart villas, AI-driven climate control, and advanced security systems are in increasing demand. Government efforts to promote green building policies and IoT-enabled homes drive market growth. Aug 2024, Kahramaa to Roll Out Smart Device to Curb Summer Electricity Consumption. Qatar General Electricity and Water Corporation aims to launch a device to minimize energy consumption, especially from air-conditioners, which consume 70% of residential energy during summer.
Kuwait Smart Home Market
Kuwait's smart home market is growing with increasing investments in smart security, home automation, and voice-controlled products. Customers like intelligent climate control systems, AI-based surveillance cameras, and networked entertainment systems. Growing real estate development and modernization activities are driving the use of IoT-based home solutions. August 2024, Ooredoo Kuwait has introduced its revolutionary "Home Internet" solutions, improving the home internet experience.
Bahrain Smart Home Market
Bahrain is seeing growth in energy-efficient smart home systems, with a focus on home security, automated lighting, and AI-based climate control. Smart speakers, plugs, and IoT-enabled home hubs are being adopted by residents as part of digital transformation efforts. Improved internet infrastructure and consumer awareness of tech are also driving adoption rates. May 2023, Naseej will expand its portfolio, valued at $580.8 million, with three new residential developments: Nasayim Arad, BarBar, and the Investment Lands Project. Over the last 10 years, the company has delivered more than 2,981 homes in Bahrain, spanning social, affordable, and high-end residential units.
Oman Smart Home Market
Oman’s smart home sector is emerging and driven by residential development projects and energy-saving initiatives. Smart thermostats, motion-sensor lighting, and smart home appliances are increasingly being demanded as people look for affordable automation options. AI facial recognition cameras and digital locks are becoming increasingly popular smart security solutions as a means of ensuring security in today's homes. Mar 2024, Al Faiha Development Company's Smart Home project at Al Ghala Heights provides innovative residential flats and offices with assured investment returns. They come with intelligent technology, offering remote control from mobile phones and integration of AI for core services. Some of the services they provide include childcare, private cinema, laundry, taxi services, and coffee making in the mornings, among others.
GCC Smart Home Market Segments
Application
- Comfort and Lighting
- Control and Connectivity
- Energy Management
- Home Entertainment
- Security
- Smart Appliance
Country
- UAE
- Saudi Arabia
- Qatar
- Kuwait
- Bahrain
- Oman
All the Key players have been covered from 4 Viewpoints:
- Overview
- Key Person
- Recent Development
- Revenue
Key Players Analysis
- Johnson Controls
- Schneider Electric
- Emerson Electric Revenue
- LG
- Legrand SA
- Siemens AG
- Honeywell
- Apple
Report Details:
| Report Features | Details |
| Base Year |
2024 |
| Historical Period |
2020 - 2024 |
| Forecast Period |
2025 - 2033 |
| Market |
US$ Billion |
| Segment Covered |
Application and Countries |
| Countries Covered |
|
| Companies Covered |
|
| Customization Scope |
20% Free Customization |
| Post-Sale Analyst Support |
1 Year (52 Weeks) |
| Delivery Format |
PDF and Excel through Email (We can also provide the editable version of the report in PPT/Word format on request) |
Key Questions Answered in This Report:
-
What is the projected market size of the GCC Smart Home Market in 2033?
-
What is the expected growth rate of the GCC Smart Home Market from 2025 to 2033?
-
Which key technologies are driving the growth of smart homes in the GCC region?
-
How are government initiatives like Saudi Vision 2030 influencing the smart home market?
-
What are the major challenges faced by the GCC Smart Home Market?
-
Which country dominates the GCC Smart Home Market and why?
-
How does the adoption of IoT and AI impact the demand for smart home solutions?
-
What role does energy efficiency play in the adoption of smart home technology in the GCC?
-
What are the key segments of the GCC Smart Home Market by application?
-
Which major companies are operating in the GCC Smart Home Market?
Customization Services available
- Analysis of Market Size and Its Segments
- More Company Profiles (Upto 10 without any additional cost):
- Additional Countries (Other than mentioned Countries):
- Region/Country Specific Reports:
- Market Entry Strategy:
- Region-Specific Market Dynamics:
- Regional Market Share Analysis:
- Trade Analysis:
- Production Insights:
- Others Customized Requests:
For more information contact our analysts.
Need More Assistance?
- Talk to our analysts to get more precious information on the current market trends.
- Include more countries and segments and customize the report based on the final requirement.
- Get a competitive advantage in your industry by knowing the report findings and making a positive impact on your revenues and operations.
- Our analysts are always ready to provide more help and pertinent information if you need any additional assistance.