
")
India Travel Market to Nordics, Tourist Numbers by Countries (Denmark, Sweden, Finland, etc), Purpose, Accommodation
Get Free Customization in This Report
India Travel Market to Nordics will reach close to US$ 125 Million by the end of year 2024. With more than 1.25 Billion inhabitants and GDP increasing by more than 7% every year, India is the country that offers enormous potential to the outbound travel & tourism industry. Recognizing the importance of Indian Outbound Tourism market, foreign tourist boards are now leaving no stone turned to meet the growing demand of Indians that is by offering direct flights to Indian cuisines. India has now emerged as the world’s fastest growing outbound market and in absolute numbers it’s only next to China.
Numerous factors have contributed towards the growth of the Indian Outbound Tourism market, the most prevalent being: the increasing GDP, direct flight connectivity with low-cost carriers (LCCs), expanding middle class population and growing women business & senior travelers. Also, some of the industry keys driving factors include people’s ideas after watching movies (Bollywood & Hollywood), travel shows, recommendations from friends & family who visited that place or lived there. Owing to mentioned factors, it is believed that the Indian Travel market to Nordics will certainly hold a remarkable place in travel & tourism industry in the years to come.
Request a free sample copy of the report: https://www.renub.com/contactus.php
Renub Research report titled “India Travel Market to Nordics, Tourist Numbers to Nordic Countries (Denmark, Sweden, Finland, Norway, Iceland, Greenland, Faroe Island, Aland) Purpose (Holiday, Business, VFR, Others), Accommodation (Hotels, Camping Sites, Rented Holiday Cottage, Friends & Relative, Others) Top Five Destination (USA, Thailand, United Kingdom, Singapore, China)” covers issues such as tourists visits, travelers’ behavior and patterns – destination choice, purpose of travel, mode of accommodation and spending. Also, the Report provides complete analysis of Indian Population (Working Size, Number of Middle class in India, Number of credit card in circulation, Indian outbound tourists to Europe).
By Purpose – Holiday/Leisure Accounts for the Maximum Market Share
The report studies travelers’ purposes by Holiday/Leisure, Business, Visiting Friends & Relatives (VFR) and Others. Holiday/Leisure accounts for the maximum market share. Sightseeing, shopping or relaxing are some of the key reasons influencing visitors to visit Nordic countries.
By Accommodations – Most Indians like to stay in Hotels and Similar Establishments
The report studies travelers’ mode of accommodations by Hotels, Camping Sites, Rented Holiday Cottage, Friends & Relative and Others. Hotels and similar establishments hold the top position as Indians prefer to have better comfort in terms of amenities and food while visiting abroad.
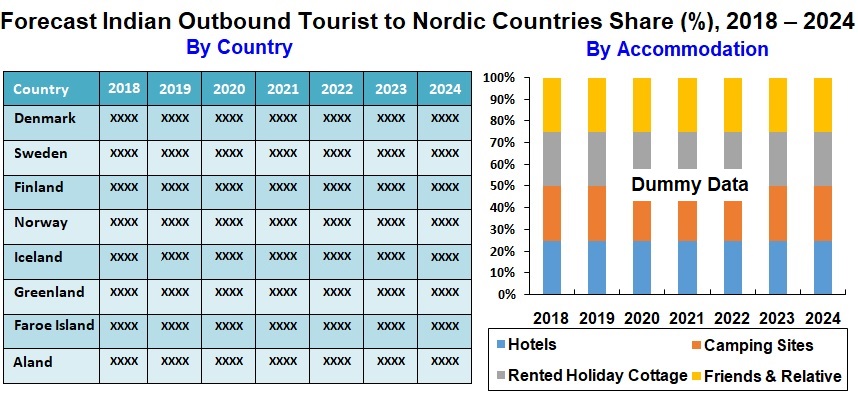
By Region – Talking of India Outbound Tourism to Nordic Countries; Sweden is most preferred
The report studies India Outbound Tourism of Nordic countries (Denmark, Sweden, Finland, Norway, Iceland, Greenland, Faroe Island and Aland). Sweden is the most preferred destination by Indians visiting Nordic countries. Sweden’s rich history and culture as well as the surrounding nature and broad range of entertainments fascinate Indians to visit Sweden more than any other Nordic countries.
By Purpose
• Holiday
• Visit Friends and Relatives (VFR)
• Business
• Other
Client can purchase this report in sections through Purchase by Chapter Tab given above
By Mode of Accommodation
• Hotels
• Camping Sites
• Rented Holiday Cottage
• Friends & Relative
By Region
• Denmark
• Sweden
• Finland
• Norway
• Iceland
• Greenland
• Faroe Island
• Aland
Other Key Segments
• Indian Population
• Size of Working Population
• Size of Middle Class Population
• Number of Credit Card in Circulation
• Indian Top Five Destinations
• Indian Outbound Tourist to Europe
We recommend this report as must-read for Travel and Tour stakeholders, Hotel Industry, Tourism Ministry, Consulting firms, Private Equity firms, Venture Capital firms etc.
1. Executive Summary
2. India Outbound Tourists to Nordic Countries
2.1 Tourism Types: Indian Outbound Tourists
2.1.1 Holiday
2.1.2 Business
2.1.3 Others
3. India Outbound Tourists Market (Spending) in Nordic Countries
3.1 India Outbound Tourists Market
3.2 Tourism Types Market: Indian Outbound Tourists
3.2.1 Holiday
3.2.2 Business
3.2.3 Others
4. India Outbound Tourists Accommodations in Nordic Countries
4.1 Hotel
4.2 Rented Cottage, Camping Sites and Hostels
4.3 Others
5. India Outbound Tourists Share (%) to Nordic Countries
5.1 India Outbound Tourists Share (%)
5.1.1 Country
5.1.2 Tourism Type
5.1.3 Accommodation
5.2 India Outbound Tourists Market (Spending) share (%)
5.2.1 Country
5.2.2 Tourism Type
6. Denmark – India Outbound Tourists Visits, Market (Spending)
6.1 India Outbound Tourists Visits
6.1.1 Holiday
6.1.2 Business
6.2 India Outbound Tourists Market (Spending)
6.2.1 Holiday
6.2.2 Business Purpose
7. Sweden – India Outbound Tourists Visits, Market (Spending)
7.1 India Outbound Tourists Visit
7.1.1 Holiday
7.1.2 Business
7.2 India Outbound Tourists Market (Spending)
7.2.1 Holiday
7.2.2 Business Purpose
8. Finland – India Outbound Tourists Visits, Market (Spending)
8.1 India Outbound Tourists Visit
8.1.1 Business Purpose
8.1.2 Leisure
8.1.3 VFR
8.1.4 Others
8.2 India Outbound Tourists Market (Spending)
8.2.1 Business Purpose
8.2.2 Leisure
8.2.3 VFR
8.2.4 Others
9. Norway – India Outbound Tourists Visits, Market (Spending)
9.1 India Outbound Tourists Visit
9.1.1 Holiday
9.1.2 Business
9.2 India Outbound Tourists Market (Spending)
9.2.1 Holiday
9.2.2 Business Purpose
10. Iceland – India Outbound Tourists Visits, Market (Spending)
10.1 India Outbound Tourists Visit
10.1.1 Holiday
10.1.2 Business
10.1.3 Others
10.2 India Outbound Tourists Market (Spending)
10.2.1 Holiday
10.2.2 Business Purpose
10.2.3 Others
11. Greenland – India Outbound Tourists Visits, Market (Spending)
11.1 India Outbound Tourists Visit
11.1.1 Holiday/ Business
11.1.2 Others
11.2 India Outbound Tourists Market (Spending)
11.2.1 Holiday/ Business
11.2.2 Others
12. Faroe Island – India Outbound Tourists Visits, Market (Spending)
12.1 India Outbound Tourists Visit
12.1.1 Holiday/ Leisure
12.1.2 Business
12.2 India Outbound Tourists Market (Spending)
12.2.1 Holiday/ Leisure
12.2.2 Business Purpose
13. Aland – India Outbound Tourists Visits, Market (Spending)
13.1 India Outbound Tourists Visit
13.1.1 Holiday/ Leisure
13.1.2 Others
13.2 India Outbound Tourists Market (Spending)
13.2.1 Holiday/ Leisure
13.2.2 Others
14. India Outbound Tourists Accommodation in Nordic Countries
14.1 Denmark
14.1.1 Hotel
14.1.2 Camping Sites
14.1.3 Rented Holiday Cottage
14.2 Sweden
14.2.1 Hotel
14.2.2 Hostels
14.3 Finland
14.3.1 Hotel or Motel
14.3.2 Friends or Relative
14.3.3 Rental Flat (incl. Airbnb)
14.3.4 Camping Area, Hostel or Rented Cottage
14.3.5 Others
14.4 Norway
14.4.1 Hotel
14.4.2 Hostel, Camping Sites, Holiday Villages
14.4.3 Others - India Outbound Tourists Accommodation in Norway
14.5 Iceland
14.5.1 Hotels and Guesthouses
14.5.2 Others - India Outbound Tourists Accommodation in Iceland
14.6 Greenland
14.6.1 Hotels and Guesthouses
14.6.2 Others
14.7 Faroe Island
14.7.1 Hotel
14.7.2 Camping Sites
14.8 Aland
14.8.1 Hotel
14.8.2 Campsite/ Rented Cottage/ Others
15. Average Length of Stay & Expense
15.1 Average Length of Stay (Per Trip)
15.2 Average Expense (Per Trip)
16. Europe
16.1 Number of Visitors to Europe
16.2 Potential Visitors to Nordic Countries
17. India Statistics
17.1 Population
17.2 India Outbound Tourist to All Destinations
17.3 Growing Middle Class
17.4 Size of Working Population
17.5 Number of Personal Credit Cards in Circulation
18. Indian Top Five Destinations
18.1 USA
18.2 Singapore
18.3 Thailand
18.4 China
18.5 United Kingdom
19. Countries Marketing Activities in India
20. NTOs & their Offices in India
21. Tourist Visa for Indian Nationals
22. Tour Operating Companies in India
23. Indian Digital Travel Landscape
23.1 Inspiration
23.2 Information
23.3 Booking
23.4 Review
23.5 International Travel Trends for Indian Travelers
24. Methodology
List of Figures:
Figure 2‑1: Indian Outbound Tourist to Nordic Countries (Thousand), 2013 – 2017
Figure 2‑2: Forecast for Indian Outbound Tourist to Nordic (Thousand), 2018 – 2024
Figure 2‑3: Holiday - Indian Outbound Tourist to Nordic Countries (Thousand), 2013 – 2017
Figure 2‑4: Forecast for Holiday - Indian Outbound Tourist to Nordic Countries (Thousand), 2018 – 2024
Figure 2‑5: Business - Indian Outbound Tourist to Nordic Countries (Thousand), 2013 - 2017
Figure 2‑6: Forecast for Business - Indian Outbound Tourist to Nordic Countries (Thousand), 2018 – 2024
Figure 2‑7: Others - Indian Outbound Tourist to Nordic Countries (Thousand), 2013 - 2017
Figure 2‑8: Forecast for Others - Indian Outbound Tourist to Nordic Countries (Thousand), 2018 - 2024
Figure 3‑1: Indian Outbound Tourist to Nordic Countries Market (Million US$), 2013 – 2017
Figure 3‑2: Forecast for Indian Outbound Tourist to Nordic Countries Market (Million US$), 2018 – 2024
Figure 3‑3: Holiday - Indian Outbound Tourist to Nordic Countries Market (Million US$), 2013 – 2017
Figure 3‑4: Forecast for Holiday - Indian Outbound Tourist to Nordic Countries Market (Million US$), 2018 – 2024
Figure 3‑5: Business - Indian Outbound Tourist to Nordic Countries Market (Million US$), 2013 – 2017
Figure 3‑6: Forecast for Business - Indian Outbound Tourist to Nordic Countries Market (Million US$), 2018 – 2024
Figure 3‑7: Others - Indian Outbound Tourist to Nordic Countries Market (Million US$), 2013 – 2017
Figure 3‑8: Forecast for Others - Indian Outbound Tourist to Nordic Countries Market (Million US$), 2018 – 2024
Figure 4‑1: Hotel - Indian Outbound Tourist to Nordic Countries (Thousand), 2013 - 2017
Figure 4‑2: Forecast for Hotel - Indian Outbound Tourist to Nordic Countries (Thousand), 2018 – 2024
Figure 4‑3: Rented Cottage, Camping Sites & Hostels - Indian Outbound Tourist to Nordic Countries (Thousand), 2013 – 2017
Figure 4‑4: Forecast for Rented Cottage, Camping Sites & Hostels - Indian Outbound Tourist to Nordic Countries (Thousand), 2018 – 2024
Figure 4‑5: Others - Indian Outbound Tourist to Nordic Countries (Thousand), 2013 – 2017
Figure 4‑6: Forecast for Others - Indian Outbound Tourist to Nordic Countries (Thousand), 2018 – 2024
Figure 5‑1: Tourism Type - Indian Outbound Tourist to Nordic Countries Share (%), 2013 – 2017
Figure 5‑2: Forecast for Tourism Type - Indian Outbound Tourist to Nordic Countries Share (%), 2018 – 2024
Figure 5‑3: By Accommodation - Indian Outbound Tourist to Nordic Countries Share (%), 2013 – 2017
Figure 5‑4: Forecast for by Accommodation - Indian Outbound Tourist to Nordic Countries Share (%), 2018 – 2024
Figure 5‑5: Tourism Type - Indian Outbound Tourist to Nordic Countries Market Share (%), 2013 – 2017
Figure 5‑6: Forecast for Tourism Type - Indian Outbound Tourist to Nordic Countries Market Share (%), 2018 – 2024
Figure 6‑1: Indian Outbound Tourist to Denmark (Number), 2013 – 2017
Figure 6‑2: Forecast for Indian Outbound Tourist to Denmark (Number), 2018 – 2024
Figure 6‑3: Holiday - Indian Outbound Tourist to Denmark (Number), 2013 – 2017
Figure 6‑4: Holiday - Forecast for Indian Outbound Tourist to Denmark (Number), 2018 – 2024
Figure 6‑5: Business Purpose - Indian outbound tourist to Denmark (Number), 2013 – 2017
Figure 6‑6: Business Purpose - Forecast for Indian outbound tourist to Denmark (Number), 2018 – 2024
Figure 6‑7: Indian Outbound Tourist to Denmark Market (Million US$), 2013 – 2017
Figure 6‑8: Forecast for Indian Outbound Tourist to Denmark Market (Million US$), 2018 – 2024
Figure 6‑9: Holiday - Indian Outbound Tourist to Denmark Market (Million US$), 2013 – 2017
Figure 6‑10: Forecast for Holiday - Indian Outbound Tourist to Denmark Market (Million US$), 2018 – 2024
Figure 6‑11: Business Purpose - Indian Outbound Tourist to Denmark Market (Million US$), 2013 – 2017
Figure 6‑12: Forecast for Business Purpose - Indian Outbound Tourist to Denmark Market (Million US$), 2018 – 2024
Figure 7‑1: Indian Outbound Tourist to Sweden (Number), 2013 – 2017
Figure 7‑2: Forecast for Indian Outbound Tourist to Sweden (Number), 2018 – 2024
Figure 7‑3: Holiday - Indian Outbound Tourist to Sweden (Number), 2013 – 2017
Figure 7‑4: Forecast for Holiday - Indian Outbound Tourist to Sweden (Number), 2018 – 2024
Figure 7‑5: Business Purpose - Indian Outbound Tourist to Sweden (Number), 2013 – 2017
Figure 7‑6: Forecast for Business Purpose - Indian Outbound Tourist to Sweden (Number), 2018 – 2024
Figure 7‑7: Indian Outbound Tourist to Sweden Market (Million US$), 2013 – 2017
Figure 7‑8: Forecast for Indian outbound tourist to Sweden Market (Million US$), 2018 – 2024
Figure 7‑9: Holiday - Indian Outbound Tourist to Sweden Market (Million US$), 2013 – 2017
Figure 7‑10: Forecast for Holiday - Indian Outbound Tourist to Sweden Market (Million US$), 2018 – 2024
Figure 7‑11: Business Purpose - Indian Outbound Tourist to Sweden Market (Million US$), 2013 – 2017
Figure 7‑12: Forecast for Business Purpose - Indian Outbound Tourist to Sweden Market (Million US$), 2018 – 2024
Figure 8‑1: Indian Outbound Tourist to Finland (Number), 2013 – 2017
Figure 8‑2: Forecast for Indian Outbound Tourist to Finland (Number), 2018 - 2024
Figure 8‑3: Business purpose - Indian Outbound Tourist to Finland (Number), 2013 - 2017
Figure 8‑4: Forecast for Business purpose - Indian Outbound Tourist to Finland (Number), 2018 - 2024
Figure 8‑5: Leisure - Indian Outbound Tourist to Finland (Number), 2013 - 2017
Figure 8‑6: Forecast for Leisure - Indian Outbound Tourist to Finland (Number), 2018 - 2024
Figure 8‑7: VFR - Indian Outbound Tourist to Finland (Number), 2013 - 2017
Figure 8‑8: Forecast for VFR - Indian Outbound Tourist to Finland (Number), 2018 - 2024
Figure 8‑9: Others - Indian Outbound Tourist to Finland (Number), 2013 - 2017
Figure 8‑10: Forecast for Others - Indian Outbound Tourist to Finland (Number), 2018 – 2024
Figure 8‑11: Indian Outbound Tourist to Finland Market (Million US$), 2013 – 2017
Figure 8‑12: Forecast for Indian Outbound Tourist to Finland Market (Million US$), 2018 – 2024
Figure 8‑13: Business Purpose - Indian Outbound Tourist to Finland Market (Million US$), 2013 – 2017
Figure 8‑14: Forecast for Business Purpose - Indian Outbound Tourist to Finland Market (Million US$), 2018 – 2024
Figure 8‑15: Leisure - Indian Outbound Tourist to Finland Market (Million US$), 2013 – 2017
Figure 8‑16: Forecast for Leisure - Indian Outbound Tourist to Finland Market (Million US$), 2018 – 2024
Figure 8‑17: VFR - Indian Outbound Tourist to Finland Market (Million US$), 2013 – 2017
Figure 8‑18: Forecast for VFR - Indian Outbound Tourist to Finland Market (Million US$), 2018 – 2024
Figure 8‑19: Others - Indian Outbound Tourist to Finland Market (Million US$), 2013 – 2017
Figure 8‑20: Forecast for Others - Indian Outbound Tourist to Finland Market (Million US$), 2018 – 2024
Figure 9‑1: Indian Outbound Tourist to Norway (Number), 2013 – 2017
Figure 9‑2: Forecast for Indian Outbound Tourist to Norway (Number), 2018 – 2024
Figure 9‑3: Holiday - Indian Outbound Tourist to Norway (Number), 2013 – 2017
Figure 9‑4: Forecast for Holiday - Indian Outbound Tourist to Norway (Number), 2018 – 2024
Figure 9‑5: Business purpose - Indian Outbound Tourist to Norway (Number), 2013 – 2017
Figure 9‑6: Forecast for Business purpose - Indian Outbound Tourist to Norway (Number), 2018 – 2024
Figure 9‑7: Indian Outbound Tourist to Norway Market (Million US$), 2013 – 2017
Figure 9‑8: Forecast for Indian Outbound Tourist to Norway Market (Million US$), 2018 – 2024
Figure 9‑9: Holiday - Indian Outbound Tourist to Norway Market (Million US$), 2013 – 2017
Figure 9‑10: Forecast for Holiday - Indian Outbound Tourist to Norway Market (Million US$), 2018 – 2024
Figure 9‑11: Business purpose - Indian Outbound Tourist to Norway Market (Million US$), 2013 – 2017
Figure 9‑12: Forecast for Business purpose - Indian Outbound Tourist to Norway Market (Million US$), 2018 – 2024
Figure 10‑1: Indian Outbound Tourist to Iceland (Number), 2013 – 2017
Figure 10‑2: Forecast for Indian Outbound Tourist to Iceland (Number), 2018 – 2024
Figure 10‑3: Holiday - Indian Outbound Tourist to Iceland (Number), 2013 – 2017
Figure 10‑4: Forecast for Holiday - Indian Outbound Tourist to Iceland (Number), 2018 – 2024
Figure 10‑5: Business Purpose - Indian Outbound Tourist to Iceland (Number), 2013 – 2017
Figure 10‑6: Forecast for Business Purpose - Indian Outbound Tourist to Iceland (Number), 2018 – 2024
Figure 10‑7: Others - Indian Outbound Tourist to Iceland (Number), 2013 – 2017
Figure 10‑8: Forecast for Others - Indian Outbound Tourist to Iceland (Number), 2018 – 2024
Figure 10‑9: Indian Outbound Tourist to Iceland Market (Thousand US$), 2013 – 2017
Figure 10‑10: Forecast for Indian Outbound Tourist to Iceland Market (Thousand US$), 2018 – 2024
Figure 10‑11: Holiday - Indian Outbound Tourist to Iceland Market (Thousand US$), 2013 – 2017
Figure 10‑12: Forecast for Holiday - Indian Outbound Tourist to Iceland Market (Thousand US$), 2018 – 2024
Figure 10‑13: Business Purpose - Indian Outbound Tourist to Iceland Market (Thousand US$), 2013 – 2017
Figure 10‑14: Forecast for Business Purpose - Indian Outbound Tourist to Iceland Market (Thousand US$), 2018 – 2024
Figure 10‑15: Others - Indian Outbound Tourist to Iceland Market (Thousand US$), 2013 – 2017
Figure 10‑16: Forecast for Others - Indian Outbound Tourist to Iceland Market (Thousand US$), 2018 – 2024
Figure 11‑1: Indian Outbound Tourist to Greenland (Number), 2013 – 2017
Figure 11‑2: Forecast for Indian Outbound Tourist to Greenland (Number), 2018 – 2024
Figure 11‑3: Holiday/Business - Indian Outbound Tourist to Greenland (Number), 2013 – 2017
Figure 11‑4: Forecast for Holiday/Business - Indian Outbound Tourist to Greenland (Number), 2018 – 2024
Figure 11‑5: Others - Indian Outbound Tourist to Greenland (Number), 2013 – 2017
Figure 11‑6: Forecast for Others - Indian Outbound Tourist to Greenland (Number), 2018 – 2024
Figure 11‑7: Indian Outbound Tourist to Greenland Market (Thousand US$), 2013 – 2017
Figure 11‑8: Forecast for Indian Outbound Tourist to Greenland Market (Thousand US$), 2018 – 2024
Figure 11‑9: Holiday/Business - Indian Outbound Tourist to Greenland Market (Thousand US$), 2013 – 2017
Figure 11‑10: Forecast for Holiday/Business - Indian Outbound Tourist to Greenland Market (Thousand US$), 2018 – 2024
Figure 11‑11: Others - Indian Outbound Tourist to Greenland Market (Thousand US$), 2013 – 2017
Figure 11‑12: Forecast for Others - Indian Outbound Tourist to Greenland Market (Thousand US$), 2018 – 2024
Figure 12‑1: Indian Outbound Tourist to Faroe Island (Number), 2013 – 2017
Figure 12‑2: Forecast for Indian outbound tourist to Faroe Island (Number), 2018 – 2024
Figure 12‑3: Holiday/Leisure - Indian Outbound Tourist to Faroe Island (Number), 2013 – 2017
Figure 12‑4: Forecast for Holiday/Leisure - Indian Outbound Tourist to Faroe Island (Number), 2018 – 2024
Figure 12‑5: Business - Indian Outbound Tourist to Faroe Island (Number), 2013 – 2017
Figure 12‑6: Forecast for Business - Indian Outbound Tourist to Faroe Island (Number), 2018 – 2024
Figure 12‑7: Indian Outbound Tourist to Faroe Island Market (Thousand US$), 2013 – 2017
Figure 12‑8: Forecast for Indian Outbound Tourist to Faroe Island Market (Thousand US$), 2018 – 2024
Figure 12‑9: Holiday/Leisure - Indian Outbound Tourist to Faroe Island Market (Thousand US$), 2013 – 2017
Figure 12‑10: Forecast for Holiday/Leisure - Indian Outbound Tourist to Faroe Island Market (Thousand US$), 2018 – 2024
Figure 12‑11: Business Purpose - Indian Outbound Tourist to Faroe Island Market (Thousand US$), 2013 – 2017
Figure 12‑12: Forecast for Business Purpose - Indian Outbound Tourist to Faroe Island Market (Thousand US$), 2018 – 2024
Figure 13‑1: Indian Outbound Tourist to Aland (Number), 2013 – 2017
Figure 13‑2: Forecast for - Indian Outbound Tourist to Aland (Number), 2018 – 2024
Figure 13‑3: Holiday/Leisure - Indian Outbound Tourist to Aland (Number), 2013 – 2017
Figure 13‑4: Forecast for Holiday/Leisure - Indian Outbound Tourist to Aland (Number), 2018 – 2024
Figure 13‑5: Others - Indian Outbound Tourist to Aland (Number), 2013 – 2017
Figure 13‑6: Forecast for Others - Indian Outbound Tourist to Aland (Number), 2018 – 2024
Figure 13‑7: Indian outbound tourist to Aland Market (Thousand US$), 2013 – 2017
Figure 13‑8: Forecast for Indian outbound tourist to Aland Market (Thousand US$), 2018 – 2024
Figure 13‑9: Holiday/Leisure - Indian Outbound Tourist to Aland Market (Thousand US$), 2013 – 2017
Figure 13‑10: Forecast for Holiday/Leisure - Indian Outbound Tourist to Aland Market (Thousand US$), 2018 – 2024
Figure 13‑11: Others - Indian Outbound Tourist to Aland Market (Thousand US$), 2013 – 2017
Figure 13‑12: Forecast for Others - Indian Outbound Tourist to Aland Market (Thousand US$), 2018 – 2024
Figure 14‑1: Hotel - Indian Outbound Tourist Accommodation in Denmark (Number), 2013 – 2017
Figure 14‑2: Forecast for Hotel - Indian Outbound Tourist Accommodation in Denmark (Number), 2018 – 2024
Figure 14‑3: Camping Sites - Indian Outbound Tourist Accommodation in Denmark (Number), 2013 – 2017
Figure 14‑4: Forecast for Camping Sites - Indian Outbound Tourist Accommodation in Denmark (Number), 2017 – 2024
Figure 14‑5: Rented Holiday Cottage - Indian Outbound Tourist Accommodation in Denmark (Number), 2013 – 2017
Figure 14‑6: Forecast for Rented Holiday Cottage - Indian Outbound Tourist Accommodation in Denmark (Number), 2018 – 2024
Figure 14‑7: Hotel - Indian Outbound Tourist Accommodation in Sweden (Number), 2013 – 2017
Figure 14‑8: Forecast for Hotel - Indian Outbound Tourist Accommodation in Sweden (Number), 2018 – 2024
Figure 14‑9: Hostels - Indian Outbound Tourist Accommodation in Sweden (Number), 2013 – 2017
Figure 14‑10: Forecast for Hostels - Indian Outbound Tourist Accommodation in Sweden (Number), 2018 – 2024
Figure 14‑11: Hotel or Motel - Indian Outbound Tourist Accommodation in Finland (Number), 2013 – 2017
Figure 14‑12: Forecast for Hotel or Motel - Indian Outbound Tourist Accommodation in Finland (Number), 2018 – 2024
Figure 14‑13: Friends or Relative - Indian Outbound Tourist Accommodation in Finland (Number), 2013 – 2017
Figure 14‑14: Forecast for Friends or Relative - Indian Outbound Tourist Accommodation in Finland (Number), 2018 – 2024
Figure 14‑15: Rental Flat - Indian Outbound Tourist Accommodation in Finland (Number), 2013 – 2017
Figure 14‑16: Forecast for Rental Flat - Indian Outbound Tourist Accommodation in Finland (Number), 2018 – 2024
Figure 14‑17: Camping Area, Hostel or Rented Cottage - Indian Outbound Tourist Accommodation in Finland (Number), 2013 – 2017
Figure 14‑18: Forecast for Camping Area, Hostel or Rented Cottage - Indian Outbound Tourist Accommodation in Finland (Number), 2018 – 2024
Figure 14‑19: Others - Indian Outbound Tourist Accommodation in Finland (Number), 2013 – 2017
Figure 14‑20: Forecast for Others - Indian Outbound Tourist Accommodation in Finland (Number), 2018 – 2024
Figure 14‑21: Hotel - Indian Outbound Tourist Accommodation in Norway (Number), 2013 – 2017
Figure 14‑22: Forecast for Hotel - Indian Outbound Tourist Accommodation in Norway (Number), 2018 – 2024
Figure 14‑23: Hostel, Camping Sites, Holiday Villages - Indian Outbound Tourist Accommodation in Norway (Number), 2013 – 2017
Figure 14‑24: Forecast for Hostel, Camping Sites, Holiday Villages - Indian Outbound Tourist Accommodation in Norway (Number), 2018 – 2024
Figure 14‑25: Others - Indian Outbound Tourist Accommodation in Norway (Number), 2013 – 2017
Figure 14‑26: Forecast for Others - Indian Outbound Tourist Accommodation in Norway (Number), 2018 – 2024
Figure 14‑27: Hotels and Guesthouses - Indian Outbound Tourist Accommodation in Iceland (Number), 2013 – 2017
Figure 14‑28: Forecast for Hotels and Guesthouses - Indian Outbound Tourist Accommodation in Iceland (Number), 2018 – 2024
Figure 14‑29: Others - Indian Outbound Tourist Accommodation in Iceland (Number), 2013 – 2017
Figure 14‑30: Forecast for Others - Indian Outbound Tourist Accommodation in Iceland (Number), 2018 – 2024
Figure 14‑31: Hotels and Guesthouses - Indian outbound tourist Accommodation in Greenland (Number), 2013 – 2017
Figure 14‑32: Forecast for Hotels and Guesthouses - Indian Outbound Tourist Accommodation in Greenland (Number), 2018 – 2024
Figure 14‑33: Others - Indian Outbound Tourist Accommodation in Greenland (Number), 2013 – 2017
Figure 14‑34: Forecast for Others - Indian Outbound Tourist Accommodation in Greenland (Number), 2018 – 2024
Figure 14‑35: Hotel - Indian Outbound Tourist Accommodation in Faroe Island (Number), 2013 – 2017
Figure 14‑36: Forecast for Hotel - Indian Outbound Tourist Accommodation in Faroe Island (Number), 2018 – 2024
Figure 14‑37: Camping Sites - Indian Outbound Tourist Accommodation in Faroe Island (Number), 2013 – 2017
Figure 14‑38: Forecast for Camping Sites - Indian Outbound Tourist Accommodation in Faroe Island (Number), 2018 – 2024
Figure 14‑39: Hotel - Indian Outbound Tourist Accommodation in Aland (Number), 2013 – 2017
Figure 14‑40: Forecast for Hotel - Indian Outbound Tourist Accommodation in Aland (Number), 2018 – 2024
Figure 14‑41: Campsite/Rented Cottage/Others - Indian Outbound Tourist Accommodation in Aland (Number), 2013 – 2017
Figure 14‑42: Forecast for Campsite/Rented Cottage/Others - Indian Outbound Tourist Accommodation in Aland (Number), 2018 – 2024
Figure 15‑1: Indian Outbound Tourist Average Length of Stay in Nordic Countries (Day - Night), 2013 to 2017
Figure 15‑2: Indian Outbound Tourist Average Expense in Nordic Countries (US$), 2013 to 2017
Figure 16‑1: Indian Outbound Tourist to Europe (Thousand), 2013 – 2017
Figure 16‑2: Forecast for Indian Outbound Tourist to Europe (Thousand), 2018 – 2024
Figure 16‑3: Indian Outbound Potential visitors to Nordic Countries (Thousand) 2013 - 2017
Figure 16‑4: Forecast for Indian Outbound Potential visitors to Nordic Countries (Thousand) 2018 - 2024
Figure 17‑1: India Population (Billion), 2013 – 2017
Figure 17‑2: Forecast for India Population (Billion), 2018 – 2024
Figure 17‑3: India Outbound Tourist to all Destinations (Million), 2013 – 2017
Figure 17‑4: Forecast for India Outbound tourist to all destinations (Million), 2018 – 2024
Figure 17‑5: India – Middle Class Population (Million), 2013 – 2017
Figure 17‑6: India – Forecast for Middle Class Population (Million), 2018 – 2025
Figure 17‑7: India – Size of Working Population (Million), 2013 - 2017
Figure 17‑8: India – Forecast for Size of Working Population (Million), 2018 - 2025
Figure 17‑9: Credit Card in Circulation (Million), 2012 – 2017
Figure 17‑10: Forecast for Credit Card in Circulation (Million), 2018 – 2025
Figure 18‑1: Indian Outbound Tourist to USA (Thousand), 2013 – 2017
Figure 18‑2: Forecast for Indian Outbound tourist to USA (Thousand), 2018 – 2024
Figure 18‑7: Indian Outbound tourist to Singapore (Thousand), 2013 – 2017
Figure 18‑8: Forecast for Indian Outbound tourist to Singapore (Thousand), 2018 – 2024
Figure 18‑3: Indian Outbound Tourist to Thailand (Thousand), 2013 – 2017
Figure 18‑4: Forecast for Indian Outbound Tourist to Thailand (Thousand), 2018 – 2024
Figure 18‑5: Indian Outbound Tourist to United Kingdom (Thousand), 2013 – 2017
Figure 18‑6: Forecast for Indian Outbound Tourist to United Kingdom (Thousand), 2018 – 2024
List of Tables:
Table 5‑1: Indian Outbound Tourist to Nordic Countries Share (%), 2013 – 2017
Table 5‑2: Forecast for Indian Outbound Tourist to Nordic Countries Share (%), 2018 – 2024
Table 5‑3: Indian Outbound Tourist to Nordic Countries Market Share (%), 2013 – 2017
Table 5‑4: Forecast for Indian Outbound Tourist to Nordic Countries Market Share (%), 2018 – 2024
Table 6‑1: Denmark, the Quick Facts
Table 7‑1: Sweden, the Quick Facts
Table 8‑1: Finland, the Quick Facts
Table 8‑2: Bilateral Trade between Indian and Finland
Table 9‑1: Norway, the Quick Facts
Table 10‑1: Iceland, the Quick Facts
Table 11‑1: Greenland, the Quick Facts
Table 12‑1: Faroe Island, the Quick Facts
Table 13‑1: Aland, the Quick Facts
Table 20‑1: List of Embassies and Consulates of Nordic Countries in India
Table 20‑2: Countries NTO & Embassy Websites Links
Table 21‑1: Schengen Visa Fees for Indian Passport holders
Table 22‑1: Scandinavia Tour Package by Companies
Table 22‑2: Companies tour package Link
Table 22‑3: Europe Tour Package by Companies
Table 22‑4: USA Tour Package by Companies
Table 23‑1: Nordic Countries Official Website & Tourism Portal
Reach out to us
Call us on
USA: +1-678-302-0700
INDIA: +91-120-421-9822
Drop us an email at
info@renub.com