1. Executive Summary
2. USA Outbound Tourists to Nordic Countries
2.1 Tourism Type: USA Outbound Tourists
2.1.1 Holiday
2.1.2 Business
2.1.3 Others
3. USA Outbound Tourists Market (Spending) in Nordic
3.1 USA Outbound Tourists Market
3.2 Tourism Type Market: USA Outbound Tourists
3.2.1 Holiday / Leisure
3.2.2 Business
3.2.3 Others
4. USA Outbound Tourists Accommodation in Nordic Countries
4.1 Hotel / Guesthouse
4.2 Rented Cottage, Camping Sites and Hostels
4.3 Others
5. Tourists Share (%) – Numbers & Market (Spending)
5.1 USA Outbound Tourists to Nordic Countries
5.1.1 By Country
5.1.2 By Tourism Type
5.1.3 By Accommodation
5.2 USA Outbound Tourism Market (Spending) Share (%)
5.2.1 By Country
5.2.2 By Tourism Type
6. Norway
6.1 USA Outbound Tourists Numbers
6.1.1 Holiday / Leisure
6.1.2 Business
6.1.3 Courses and Conferences
6.2 USA Outbound Tourism Market (Spending)
6.2.1 Holiday / Leisure
6.2.2 Business
6.2.3 Courses and Conferences
7. Denmark
7.1 USA Outbound Tourists Numbers
7.1.1 Holiday
7.1.2 Business
7.2 USA Outbound Tourism Market (Spending)
7.2.1 Holiday
7.2.2 Business
8. Sweden
8.1 USA Outbound Tourists Numbers
8.1.1 Holiday
8.1.2 Business
8.2 USA Outbound Tourism Market (Spending)
8.2.1 Holiday
8.2.2 Business
9. Finland
9.1 USA Outbound Tourists Numbers
9.1.1 Holiday / Leisure
9.1.2 Business
9.1.3 Visiting Friends & Relatives (VFR)
9.1.4 Others
9.2 USA Outbound Tourism Market (Spending)
9.2.1 Holiday / Leisure
9.2.2 Business
9.2.3 Visiting Friends & Relatives
9.2.4 Others
10. Iceland
10.1 USA Outbound Tourists Numbers
10.1.1 Holiday
10.1.2 Business
10.1.3 Others
10.2 USA Outbound Tourism Market (Spending)
10.2.1 Holiday
10.2.2 Business
10.2.3 Others
11. Greenland
11.1 USA Outbound Tourists Numbers
11.1.1 Holiday
11.1.2 Others
11.2 USA Outbound Tourism Market (Spending)
11.2.1 Holiday
11.2.2 Others
12. Accommodation – China Outbound Tourists Numbers
12.1 Norway
12.1.1 Hotels and Similar Establishments
12.1.2 Camping Sites
12.1.3 Holiday Dwellings
12.1.4 Hostelling International
12.2 Denmark
12.2.1 Hotels Holiday Centres, etc
12.2.2 Youth Hostels
12.2.3 Camping Sites & Marinas
12.3 Sweden
12.3.1 Hotels
12.3.2 Hostels
12.3.3 Others
12.4 Finland
12.4.1 Hotel or Motel
12.4.2 Friends or Relatives
12.4.3 Rental Flat (incl. Airbnb)
12.4.4 Camping Area, Hostel or Rented Cottage
12.4.5 Others (Flat or Cottage)
12.5 Iceland
12.5.1 Hotels & Guesthouses
12.5.2 Others
12.6 Greenland
12.6.1 Hotels & Guesthouses
12.6.2 Others
13. Average Length of Stay & Expense
13.1 Average Length of Stay (Per Trip)
13.2 Average Expense (Per Trip)
14. USA Outbound Tourists to All Destinations
15. USA Outbound Tourists Visit to Europe
List of Figures:
Figure 2‑1: USA Outbound Tourists to Nordic Countries (Number), 2013 - 2017
Figure 2‑2: Forecast for USA Outbound Tourists to Nordic Countries (Number), 2018 - 2024
Figure 2‑3: Holiday - USA Outbound Tourists to Nordic Countries (Number), 2013 - 2017
Figure 2‑4: Forecast for Holiday - USA Outbound Tourists to Nordic Countries (Number), 2018 – 2024
Figure 2‑5: Business - USA Outbound Tourists to Nordic Countries (Number), 2013 – 2017
Figure 2‑6: Forecast for Business - USA Outbound Tourists to Nordic Countries (Number), 2018 – 2024
Figure 2‑7: Others - USA Outbound Tourists to Nordic Countries (Number), 2013 – 2017
Figure 2‑8: Forecast for Others - USA Outbound Tourists to Nordic Countries (Number), 2018 – 2024
Figure 3‑1: USA outbound tourist to Nordic Countries Market (Million US$), 2013 – 2017
Figure 3‑2: Forecast for USA outbound tourist to Nordic Countries Market (Million US$), 2018 – 2024
Figure 3‑3: Holiday/Leisure - USA outbound tourist to Nordic Countries Market (Million US$), 2013 – 2017
Figure 3‑4: Forecast for Holiday/Leisure - USA outbound tourist to Nordic Countries Market (Million US$), 2018 – 2024
Figure 3‑5: Business - USA outbound tourist to Nordic Countries Market (Million US$), 2013 – 2017
Figure 3‑6: Forecast for Business - USA outbound tourist to Nordic Countries Market (Million US$), 2018 – 2024
Figure 3‑7: Others - USA outbound tourist to Nordic Countries Market (Million US$), 2013 – 2017
Figure 3‑8: Forecast for Others - USA outbound tourist to Nordic Countries Market (Million US$), 2018 – 2024
Figure 4‑1: Hotel - USA outbound tourist to Nordic Countries (Number), 2013 – 2017
Figure 4‑2: Forecast for Hotel - USA outbound tourist to Nordic Countries (Number), 2018 – 2024
Figure 4‑3: Rented Cottage, Camping Sites & Hostels - USA outbound tourist to Nordic Countries (Number), 2013 – 2017
Figure 4‑4: Forecast for Rented Cottage, Camping Sites & Hostels - USA outbound tourist to Nordic Countries (Number), 2018 – 2024
Figure 4‑5: Others - USA Outbound Tourist to Nordic Countries (Number), 2013 – 2017
Figure 4‑6: Forecast for Others - USA Outbound Tourist to Nordic Countries (Number), 2018 – 2024
Figure 5‑1: USA Outbound Tourist to Nordic Countries Share (%), 2013 – 2017
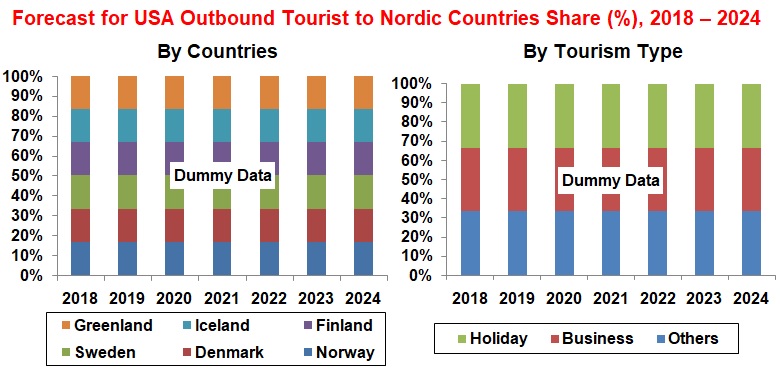
Figure 5‑2: Forecast for USA Outbound Tourist to Nordic Countries Share (%), 2018 – 2024
Figure 5‑3: Tourism Type - USA Outbound Tourist to Nordic Countries Share (%), 2013 – 2017
Figure 5‑4: Forecast for Tourism Type - USA outbound tourist to Nordic Countries Share (%), 2018 – 2024
Figure 5‑5: Accommodation Type - USA Outbound Tourist to Nordic Countries Share (%), 2013 – 2017
Figure 5‑6: Forecast for Accommodation Type - USA Outbound Tourist to Nordic Countries Share (%), 2018 – 2024
Figure 5‑7: USA Outbound Tourist to Nordic Countries Market Share (%), 2013 – 2017
Figure 5‑8: Forecast for USA Outbound Tourist to Nordic Countries Market Share (%), 2018 – 2024
Figure 5‑9: Tourism Type - USA outbound tourist to Nordic Countries Market Share (%), 2013 – 2017
Figure 5‑10: Forecast for Tourism Type - USA outbound tourist to Nordic Countries Market Share (%), 2018 – 2024
Figure 6‑1: USA Outbound Tourist to Norway (Number), 2013 – 2017
Figure 6‑2: Forecast for USA Outbound Tourist to Norway (Number), 2018 – 2024
Figure 6‑3: Holiday/Leisure - USA Outbound Tourist to Norway (Number), 2013 – 2017
Figure 6‑4: Forecast for Holiday/Leisure - USA Outbound Tourist to Norway (Number), 2018 – 2024
Figure 6‑5: Business - USA Outbound Tourist to Norway (Number), 2013 – 2017
Figure 6‑6: Forecast for Business - USA Outbound Tourist to Norway (Number), 2018 – 2024
Figure 6‑7: Courses and Conferences - USA Outbound Tourist to Norway (Number), 2013 – 2017
Figure 6‑8: Forecast for Courses and Conferences - USA Outbound Tourist to Norway (Number), 2018 – 2024
Figure 6‑9: USA Outbound Tourist to Norway Market (Million US$), 2013 – 2017
Figure 6‑10: Forecast for USA Outbound Tourist to Norway Market (Million US$), 2018 – 2024
Figure 6‑11: Holiday/Leisure - USA Outbound Tourist to Norway Market (Million US$), 2013 – 2017
Figure 6‑12: Forecast for Holiday/Leisure - USA Outbound Tourist to Norway Market (Million US$), 2018 – 2024
Figure 6‑13: Business - USA Outbound Tourist to Norway Market (Million US$), 2013 – 2017
Figure 6‑14: Forecast for Business - USA Outbound Tourist to Norway Market (Million US$), 2018 – 2024
Figure 6‑15: Courses and Conferences - USA Outbound Tourist to Norway Market (Million US$), 2013 – 2017
Figure 6‑16: Forecast for Courses and Conferences - USA Outbound Tourist to Norway Market (Million US$), 2018 - 2024
Figure 7‑1: USA Outbound Tourist to Denmark (Number), 2013 - 2017
Figure 7‑2: Forecast for USA Outbound Tourist to Denmark (Number), 2018 - 2024
Figure 7‑3: Holiday - USA Outbound Tourist to Denmark (Number), 2013 - 2017
Figure 7‑4: Forecast for Holiday - USA Outbound Tourist to Denmark (Number), 2018 - 2024
Figure 7‑5: Business - USA Outbound Tourist to Denmark (Number), 2013 - 2017
Figure 7‑6: Forecast for Business - USA Outbound Tourist to Denmark (Number), 2018 - 2024
Figure 7‑7: USA Outbound Tourist to Denmark Market (Million US$), 2013 - 2017
Figure 7‑8: Forecast for USA Outbound Tourist to Denmark Market (Million US$), 2018 - 2024
Figure 7‑9: Holiday - USA Outbound Tourist to Denmark Market (Million US$), 2013 - 2017
Figure 7‑10: Forecast for Holiday - USA Outbound Tourist to Denmark Market (Million US$), 2018 - 2024
Figure 7‑11: Business - USA Outbound Tourist to Denmark Market (Million US$), 2013 - 2017
Figure 7‑12: Forecast for Business - USA Outbound Tourist to Denmark Market (Million US$), 2018 - 2024
Figure 8‑1: USA Outbound Tourist to Sweden (Number), 2013 - 2017
Figure 8‑2: Forecast for USA Outbound Tourist to Sweden (Number), 2018 - 2024
Figure 8‑3: Holiday - USA Outbound Tourist to Sweden (Number), 2013 - 2017
Figure 8‑4: Forecast for Holiday - USA Outbound Tourist to Sweden (Number), 2018 - 2024
Figure 8‑5: Business - USA Outbound Tourist to Sweden (Number), 2013 - 2017
Figure 8‑6: Forecast for Business - USA Outbound Tourist to Sweden (Number), 2018 - 2024
Figure 8‑7: USA Outbound Tourist to Sweden Market (Million US$), 2013 - 2017
Figure 8‑8: Forecast for USA Outbound Tourist to Sweden Market (Million US$), 2018 - 2024
Figure 8‑9: Holiday - USA Outbound Tourist to Sweden Market (Million US$), 2013 - 2017
Figure 8‑10: Forecast for Holiday - USA Outbound Tourist to Sweden Market (Million US$), 2018 - 2024
Figure 8‑11: Business - USA Outbound Tourist to Sweden Market (Million US$), 2013 – 2017
Figure 8‑12: Forecast for Business - USA Outbound Tourist to Sweden Market (Million US$), 2018 – 2024
Figure 9‑1: USA Outbound Tourist to Finland (Number), 2013 - 2017
Figure 9‑2: Forecast for USA Outbound Tourist to Finland (Number), 2018 - 2024
Figure 9‑3: Holiday/Leisure - USA Outbound Tourist to Finland (Number), 2013 - 2017
Figure 9‑4: Forecast for Holiday/Leisure - USA Outbound Tourist to Finland (Number), 2018 - 2024
Figure 9‑5: Business - USA Outbound Tourist to Finland (Number), 2013 - 2017
Figure 9‑6: Forecast for Business - USA Outbound Tourist to Finland (Number), 2018 - 2024
Figure 9‑7: VFR - USA Outbound Tourist to Finland (Number), 2013 - 2017
Figure 9‑8: Forecast for VFR - USA Outbound Tourist to Finland (Number), 2018 - 2024
Figure 9‑9: Others - USA Outbound Tourist to Finland (Number), 2013 - 2017
Figure 9‑10: Forecast for Others - USA Outbound Tourist to Finland (Number), 2018 - 2024
Figure 9‑11: USA Outbound Tourist to Finland Market (Million US$), 2013 - 2017
Figure 9‑12: Forecast for USA Outbound Tourist to Finland Market (Million US$), 2018 - 2024
Figure 9‑13: Holiday/Leisure - USA Outbound Tourist to Finland market (Million US$), 2013 – 2017
Figure 9‑14: Forecast for Holiday/Leisure - USA Outbound Tourist to Finland market (Million US$), 2018 – 2024
Figure 9‑15: Business - USA Outbound Tourist to Finland market (Million US$), 2013 – 2017
Figure 9‑16: Forecast for Business - USA Outbound Tourist to Finland market (Million US$), 2018 – 2024
Figure 9‑17: VFR - USA Outbound Tourist to Finland market (Million US$), 2013 – 2017
Figure 9‑18: Forecast for VFR - USA Outbound Tourist to Finland market (Million US$), 2018 – 2024
Figure 9‑19: Others - USA Outbound Tourist to Finland market (Million US$), 2013 – 2017
Figure 9‑20: Forecast for Others - USA Outbound Tourist to Finland market (Million US$), 2018 – 2024
Figure 10‑1: USA Outbound Tourist to Iceland (Number), 2013 – 2017
Figure 10‑2: Forecast for USA Outbound Tourist to Iceland (Number), 2018 – 2024
Figure 10‑3: Holiday – USA Outbound Tourist to Iceland (Number), 2013 – 2017
Figure 10‑4: Forecast for Holiday – USA Outbound Tourist to Iceland (Number), 2018 – 2024
Figure 10‑5: Business – USA Outbound Tourist to Iceland (Number), 2013 – 2017
Figure 10‑6: Forecast for Business – USA Outbound Tourist to Iceland (Number), 2018 – 2024
Figure 10‑7: Others – USA Outbound Tourist to Iceland (Number), 2013 – 2017
Figure 10‑8: Forecast for Others – USA Outbound Tourist to Iceland (Number), 2018 – 2024
Figure 10‑9: USA Outbound Tourist to Iceland Market (Million US$), 2013 – 2017
Figure 10‑10: Forecast for USA Outbound Tourist to Iceland Market (Million US$), 2018 – 2024
Figure 10‑11: Holiday - USA Outbound Tourist to Iceland Market (Million US$), 2013 – 2017
Figure 10‑12: Forecast for Holiday - USA Outbound Tourist to Iceland Market (Million US$), 2018 – 2024
Figure 10‑13: Business - USA Outbound Tourist to Iceland Market (Million US$), 2013 – 2017
Figure 10‑14: Forecast for Business - USA Outbound Tourist to Iceland Market (Million US$), 2018 – 2024
Figure 10‑15: Others - USA Outbound Tourist to Iceland Market (Million US$), 2013 – 2017
Figure 10‑16: Forecast for Others - USA Outbound Tourist to Iceland Market (Million US$), 2018 – 2024
Figure 11‑1: USA Outbound Tourist to Greenland (Number), 2013 – 2017
Figure 11‑2: Forecast for USA Outbound Tourist to Greenland (Number), 2018 – 2024
Figure 11‑3: Holiday - USA Outbound Tourist to Greenland (Number), 2013 – 2017
Figure 11‑4: Forecast for Holiday - USA Outbound Tourist to Greenland (Number), 2018 – 2024
Figure 11‑5: Others - USA Outbound Tourist to Greenland (Number), 2013 – 2017
Figure 11‑6: Forecast for Others - USA Outbound Tourist to Greenland (Number), 2018 – 2024
Figure 11‑7: USA Outbound Tourist to Greenland Market (Million US$), 2013 – 2017
Figure 11‑8: Forecast for USA Outbound Tourist to Greenland Market (Million US$), 2018 – 2024
Figure 11‑9: Holiday - USA Outbound Tourist to Greenland Market (Million US$), 2013 – 2017
Figure 11‑10: Forecast for Holiday - USA Outbound Tourist to Greenland Market (Million US$), 2018 – 2024
Figure 11‑11: Others - USA Outbound Tourist to Greenland Market (Thousand US$), 2013 – 2017
Figure 11‑12: Forecast for Others - USA Outbound Tourist to Greenland Market (Thousand US$), 2018 – 2024
Figure 12‑1: Hotels and similar establishments - USA Outbound Tourists Accommodation in Norway (Number), 2013 - 2017
Figure 12‑2: Forecast for Hotels and similar establishments - USA Outbound Tourists Accommodation in Norway (Number), 2018 - 2024
Figure 12‑3: Camping Sites - USA Outbound Tourists Accommodation in Norway (Number), 2013 - 2017
Figure 12‑4: Forecast for Camping Sites - USA Outbound Tourists Accommodation in Norway (Number), 2018 - 2024
Figure 12‑5: Holiday Dwellings - USA Outbound Tourists Accommodation in Norway (Number), 2013 – 2017
Figure 12‑6: Forecast for Holiday Dwellings - USA Outbound Tourists Accommodation in Norway (Number), 2018 – 2024
Figure 12‑7: Hostelling International - USA Outbound Tourists Accommodation in Norway (Number), 2013 – 2017
Figure 12‑8: Forecast for Hostelling International - USA Outbound Tourists Accommodation in Norway (Number), 2018 – 2024
Figure 12‑9: Hotels Holiday Centres, etc - USA Outbound Tourists Accommodation in Denmark (Number), 2013 - 2017
Figure 12‑10: Forecast for Hotels Holiday Centres, etc - USA Outbound Tourists Accommodation in Denmark (Number), 2018 - 2024
Figure 12‑11: Youth Hotels - USA Outbound Tourists Accommodation in Denmark (Number), 2013 - 2017
Figure 12‑12: Forecast for Youth Hotels - USA Outbound Tourists Accommodation in Denmark (Number), 2018 – 2024
Figure 12‑13: Camping Sites & Marinas - USA Outbound Tourists Accommodation in Denmark (Number), 2013 – 2017
Figure 12‑14: Forecast for Camping Sites & Marinas - USA Outbound Tourists Accommodation in Denmark (Number), 2018 – 2024
Figure 12‑15: Hotels - USA Outbound Tourists Accommodation in Sweden (Number), 2013 – 2017
Figure 12‑16: Forecast for Hotels - USA Outbound Tourists Accommodation in Sweden (Number), 2018 – 2024
Figure 12‑17: Hostels - USA Outbound Tourists Accommodation in Sweden (Number), 2013 – 2017
Figure 12‑18: Forecast for Hostels - USA Outbound Tourists Accommodation in Sweden (Number), 2018 – 2024
Figure 12‑19: Others - USA Outbound Tourists Accommodation in Sweden (Number), 2013 – 2017
Figure 12‑20: Forecast for Hostels - USA Outbound Tourists Accommodation in Sweden (Number), 2018 – 2024
Figure 12‑21: Hotel or Motel - USA Outbound Tourists Accommodation in Finland (Number), 2013 – 2017
Figure 12‑22: Forecast for Hotel or Motel - USA Outbound Tourists Accommodation in Finland (Number), 2018 – 2024
Figure 12‑23: Friends or Relatives - USA Outbound Tourists Accommodation in Finland (Number), 2013 – 2017
Figure 12‑24: Forecast for Friends or Relatives - USA Outbound Tourists Accommodation in Finland (Number), 2018 – 2024
Figure 12‑25: Rental Flat - USA Outbound Tourists Accommodation in Finland (Number), 2013 – 2017
Figure 12‑26 : Forecast for Rental Flat - USA Outbound Tourists Accommodation in Finland (Number), 2018 – 2024
Figure 12‑27: Camping area, hostel or rented cottage - USA Outbound Tourists Accommodation in Finland (Number), 2013 – 2017
Figure 12‑28: Forecast for Camping area, hostel or rented cottage - USA Outbound Tourists Accommodation in Finland (Number), 2018 – 2024
Figure 12‑29: Others - USA Outbound Tourists Accommodation in Finland (Number), 2013 – 2017
Figure 12‑30: Forecast for Others - USA Outbound Tourists Accommodation in Finland (Number), 2018 – 2024
Figure 12‑31: Hotels & Guesthouses - USA Outbound Tourists Accommodation in Iceland (Number), 2013 – 2017
Figure 12‑32: Forecast for Hotels & Guesthouses - USA Outbound Tourists Accommodation in Iceland (Number), 2018 – 2024
Figure 12‑33: Others - USA Outbound Tourists Accommodation in Iceland (Number), 2013 – 2017
Figure 12‑34: Forecast for Others - USA Outbound Tourists Accommodation in Iceland (Number), 2018 – 2024
Figure 12‑35: Hotels & Guesthouses - USA Outbound Tourists Accommodation in Greenland (Number), 2013 – 2017
Figure 12‑36: Forecast for Hotels & Guesthouses - USA Outbound Tourists Accommodation in Greenland (Number), 2018 – 2024
Figure 12‑37: Others - USA Outbound Tourists Accommodation in Greenland (Number), 2013 – 2017
Figure 12‑38: Others - USA Outbound Tourists Accommodation in Greenland (Number), 2018 – 2024
Figure 13‑1: USA outbound tourist Average Length of Stay in Nordic Countries, 2013 - 2017
Figure 13‑2: USA outbound tourist Average Expense in Nordic Countries (US$), 2017
Figure 14‑1: USA Outbound Tourists to All Destinations (Million), 2013 – 2017
Figure 14‑2: Forecast for USA Outbound Tourists to All Destinations (Million), 2018 – 2024
Figure 15‑1: Top 10 most visited cities in Europe by international tourist arrivals, visitors in – 2017
Figure 15‑2: USA Outbound Tourists to Europe (Thousand), 2013 – 2017
Figure 15‑3: Forecast for USA Outbound Tourists to Europe (Thousand), 2018 - 2024
List of Tables:
Table 6‑1: Norway, the Quick Facts
Table 7‑1: Denmark, the Quick Facts
Table 8‑1: Sweden, the Quick Facts
Table 9‑1: Finland, the Quick Facts
Table 10‑1: Iceland, the Quick Facts
Table 11‑1: Greenland, the Quick Facts
Table 14‑1: The documents U.S. traveler needs to visit Canada and to return home hassle-free
Table 15‑1: Europe Top Cities with popular attraction place