China Outbound Tourism Market, Purpose of Visit (Holiday, Visit Friends & Relatives, Business, Others) Tourists Visits, Spending & Forecast
Buy NowGet Free Customization in This Report
China Outbound Tourism Market is expected to surpass the milestone of US$ 500 Billion mark by the end of year 2024. The major driving factors for china outbound tourism market are; rising disposable income of middle class population, liberal tourism policy like Approved Destination Status (ADS) policy, government support and rising number of Chinese passport holder will foster the China outbound tourism market during forecast period. China has evolved as a major source of outbound tourist in the world and has become one of the biggest tourism markets across the world with high per capita tourist expenditure.
How Countries are attracting Chinese Travelers
In order to attract more and more Chinese tourists every country is tweaking its visa policy. Such as United States begin a 10 year mutual visa validity policy with China in November 2014. As per this new policy Chinese tourist gets a valid visa to travel to USA, and this visa can remain valid for a period of up to ten years. This new visa policy proved to be a game changer and it accounted for nearly 53% increase in Chinese visa application in the first year of the program compared to last year. In addition to this opening of new air routes from China to USA by both Chinese and United States airline companies further expanded traveler number to the United States.
Request a free sample copy of the report: https://www.renub.com/contactus.php
Tourism Types: Holiday, Visit Friends and Relatives (VFR), Business (MICE) & Others (Education, Medical Treatment)
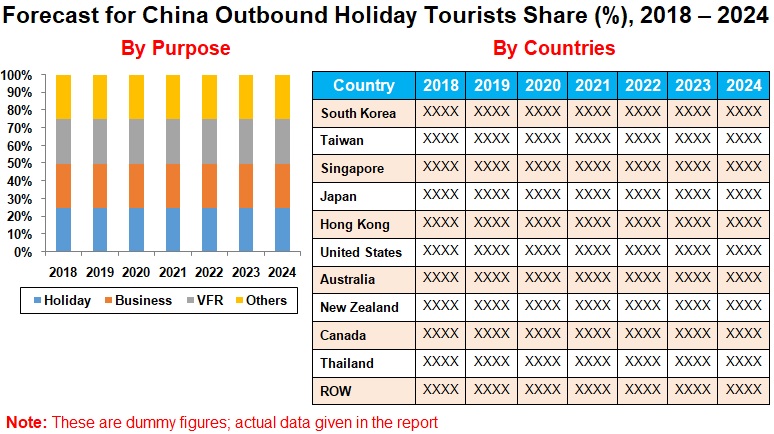
Holiday segment is one of the most popular tourism segments among other segments of China Outbound Tourism. The other 3 segments covered in the report are Visit Friends and Relatives (VFR), Business (MICE) & Others (Education, Medical Treatment). This report provides you in-depth analysis of tourism type from various perspectives like market, visitor numbers, market share, visitor share etc by country wise.
Country Analysis: China Outbound Tourists Visits
In this reports, we have covered top 10 destinations for China outbound tourism. Hong Kong, Taiwan and South Korea is most preferred by Chinese tourist because of cultural similarity, affordability and accessibility. In this report, we have done comprehensive analysis of each country in terms of number of Chinese tourist visit, market & forecast and number of associated factors that impacted China Outbound Tourism. The ten countries studied in the report are as follow: Australia, Canada, Japan, South Korea, New Zealand, Singapore, Taiwan, Thailand, United States and Hong Kong
Country Analysis: China Outbound Tourists Market (Spending)
United States has one of the largest Tourism Receipt from China. This report covers various share analysis of China outbound tourism like china outbound visitor market share & forecast by country, China outbound tourist market share by tourism type (Holiday, VFR, MICE & Others).
China Outbound Tourism Market, Purpose of Visit (Holiday, Visit Friends & Relatives, Business, Others) Tourists Visits, Spending & Forecast published by Renub Research on China Outbound Tourism.
Client can purchase this report in sections through Purchase by Chapter Tab given above
China Outbound Tourists Numbers and Market (Spending) - Top 10 Countries covered in this report
1. Australia
2. Canada
3. Japan
4. South Korea
5. New Zealand
6. Singapore
7. Taiwan
8. Thailand
9. United States
10. Hong Kong
Tourism Types Covered in this report
All countries have been analyzed with consideration of following key travel segments
• Holiday Tourists Arrivals & Market (Spending)
• Visit Friends and Relatives (VFR) Arrivals & Market (Spending)
• Business (MICE) Arrivals & Market (Spending)
• Others Arrivals & Market (Spending)
We recommend this report as must-read for Travel and Tour stake holders, Hotel Industry, Tourism Ministry, Consulting firms, Private Equity firms, Venture Capital firms etc.
If the information you seek is not included in the current scope of the study kindly share your specific requirements with our custom research team at info@renub.com
1. Market Definition
2. Research Methodology
3. Executive Summary
4. China Outbound Tourism
4.1 Tourists Numbers
4.2 Tourists Market
5. Tourists Share – China Outbound Tourism
5.1 Countries
5.2 Tourism Types – Holiday, VFR, Business & Others
5.3 By Countries – Tourism Type Share
5.3.1 Holiday
5.3.2 Visit Friends & Relatives (VFR)
5.3.3 Business – MICE (Meetings, Incentives, Conferences & Exhibitions)
5.3.4 Others (Education, Medical Tourism)
6. Market (Spending) Share – China Outbound Tourism
6.1 Countries
6.2 Tourism Types – Holiday, VFR, Business & Others
6.3 By Countries – Tourism Types Market Share
6.3.1 Holiday
6.3.2 Visit Friends & Relative (VFR)
6.3.3 Business – MICE (Meetings, Incentive, Conferences & Exhibitions)
6.3.4 Others (Education, Medical Tourism)
7. Tourism Types – China Outbound Tourists Numbers
7.1 Holiday
7.2 Visit Friends & Relatives (VFR)
7.3 Business (MICE)
7.4 Others
8. Tourism Types – China Outbound Tourist Market (Spending)
8.1 Holiday
8.2 Visit Friends & Relatives (VFR)
8.3 Business (MICE)
8.4 Others
9. Australia
9.1 China Outbound Tourists Visit
9.2 Tourism Types – China Outbound Tourists Visit to Australia
9.2.1 Holiday
9.2.2 Visit Friend & Relatives (VFR)
9.2.3 Business (MICE)
9.2.4 Others
9.3 China Outbound Tourists Market (Spending)
9.4 Tourism Types – China Outbound Tourists Market (Spending) in Australia
9.4.1 Holiday
9.4.2 Visit Friend & Relatives (VFR)
9.4.3 Business
9.4.4 Others
10. Canada
10.1 China Outbound Tourists Visit
10.2 Tourism Types – China Outbound Tourists Visit to Canada
10.2.1 Holiday
10.2.2 Visit Friend & Relatives (VFR)
10.2.3 Business (MICE)
10.2.4 Others
10.3 China Outbound Tourists Market (Spending)
10.4 Tourism Types – China Outbound Tourists Market (Spending) in Canada
10.4.1 Holiday
10.4.2 Visit Friend & Relatives (VFR)
10.4.3 Business
10.4.4 Others
11. Japan
11.1 China Outbound Tourists Visit
11.2 Tourism Types – China Outbound Tourists Visit to Japan
11.2.1 Holiday
11.2.2 Business (MICE)
11.2.3 Others
11.3 China Outbound Tourists Market (Spending) in Japan
11.4 Tourism Types – China Outbound Tourists Market (Spending) in Japan
11.4.1 Holiday
11.4.2 Business (MICE)
11.4.3 Others
12. South Korea
12.1 China Outbound Tourists Visit
12.2 Tourism Types – China Outbound Tourists Visit to South Korea
12.2.1 Holiday
12.2.2 Business (MICE)
12.2.3 Official Purpose
12.2.4 Others
12.3 China Outbound Tourists Market (Spending)
12.4 Tourism Types – China Outbound Tourists Market (Spending) in South Korea
12.4.1 Holiday
12.4.2 Business (MICE)
12.4.3 Official Purpose
12.4.4 Others
13. New Zealand
13.1 China Outbound Tourists Visit
13.2 Tourism Type – China Outbound Tourists Visit to New Zealand
13.2.1 Holiday
13.2.2 Visit Friends & Relatives (VFR)
13.2.3 Business (MICE)
13.2.4 Conferences & Conventions
13.2.5 Education
13.2.6 Others
13.3 China Outbound Tourists Market (Spending)
13.4 Tourism Type – China Outbound Tourists Market (Spending) to New Zealand
13.4.1 Holiday
13.4.2 Visiting Friends & Relatives (VFR)
13.4.3 Business (MICE)
13.4.4 Conferences & Conventions
13.4.5 Education
13.4.6 Others
14. Singapore
14.1 China Outbound Tourists Visit
14.2 Tourism Types – China Outbound Tourists Visit to Singapore
14.2.1 Holiday
14.2.2 Visiting Friends & Relatives (VFR)
14.2.3 Business
14.2.4 Conferences
14.2.5 Unstated
14.2.6 Other Purpose
14.3 China Outbound Tourists Market (Spending)
14.4 Tourism Types – China Outbound Tourists Market (Spending) in Singapore
14.4.1 Holiday
14.4.2 Visiting Friends & Relatives (VFR)
14.4.3 Business
14.4.4 Conferences
14.4.5 Unstated Purpose
14.4.6 Others
15. Taiwan
15.1 China Outbound Tourists Visit
15.2 Tourism Types – China Outbound Tourists Visit to Taiwan
15.2.1 Holiday
15.2.2 Visit Friends & Relativities (VFR)
15.2.3 Business
15.2.4 Conference
15.2.5 Education
15.2.6 Others
15.3 China Outbound Tourists Market (Spending)
15.4 Tourism Types – China Outbound Tourists Market (Spending) in Taiwan
15.4.1 Holiday
15.4.2 Visit Friends & Relatives (VFR
15.4.3 Business
15.4.4 Conference
15.4.5 Education (Study) Purpose
15.4.6 Others
16. Thailand
16.1 China Outbound Tourists Visit
16.2 Tourism Types – China Outbound Tourists Visit to Thailand
16.2.1 Holiday
16.2.2 VFR
16.2.3 Business
16.2.4 Others
16.3 China Outbound Tourists Market (Spending)
16.4 Tourism Types – China Outbound Tourists Market (Spending) in Thailand
16.4.1 Holiday
16.4.2 VFR
16.4.3 Business
16.4.4 Others
17. United States
17.1 China Outbound Tourists Visit
17.2 Tourism Types – China Outbound Tourists Visit to United States
17.2.1 Holiday
17.2.2 Visit Friends & Relatives (VFR)
17.2.3 Business/Conference
17.2.4 Education
17.2.5 Others
17.3 China Outbound Tourists Market (Spending)
17.4 Tourism Types – China Outbound Tourists Market (Spending) in United States
17.4.1 Holiday
17.4.2 Visit Friends & Relatives (VFR)
17.4.3 Business
17.4.4 Education
17.4.5 Others
18. Hong Kong
18.1 China Outbound Tourists Visit
18.2 Tourism Types – China Outbound Tourists Visit to Hong Kong
18.2.1 Holiday
18.2.2 Visiting Friends & Relatives (VFR)
18.2.3 Business/Meeting
18.2.4 En Route
18.2.5 Others
18.3 China Outbound Tourists Market (Spending)
18.4 Tourism Types – China Outbound Tourists Market (Spending) in Hong Kong
18.4.1 Holiday
18.4.2 Visiting Friends & Relatives (VFR)
18.4.3 Business
18.4.4 En Route
18.4.5 Others
19. China Outbound Tourism: Growth Drivers
19.1 China’s Approved Destination Status (ADS) Policy Stimulate Chinese Travel Abroad
19.1.1 ADS Approved Countries
19.1.2 Impact of ADS on Chinese Outbound Travel
19.2 GDP Growth Rate Development
19.3 Growing Middle Class and Rich Class Population in China
19.4 Strong Government Support
19.5 New National Tourism Strategy of China will Augment Outbound Tourism
19.6 Opening of China’s Outbound Travel Sector to Foreign Capitalized Tour Companies
20. Challenges in China Outbound Tourism
20.1 Challenges Chinese Travelers Face (NEW)
20.2 Restrictions and Changes
20.3 Negative Influence:
20.4 Chinese Outbound Tourists Concerns Before Departure
List of Figures:
Figure 4‑1: China Outbound Tourists (Thousand), 2011 – 2017
Figure 4‑2: Forecast for China Outbound Tourists (Thousand), 2018 – 2024
Figure 4‑3: China Outbound Tourists Market (Spending) (Billion US$), 2011 – 2017
Figure 4‑4: Forecast for China Outbound Tourists Market (Spending) (Billion US$), 2018 – 2024
Figure 5‑1: Chinese Outbound Tourists Share by Purpose (Percent %), 2011 – 2017
Figure 5‑2: Forecast for Chinese Outbound Tourists Share by Purpose (Percent %), 2018– 2024
Figure 6‑1: Chinese Outbound Tourists Market (Spending) Share by Purpose (Percent %), 2011 – 2017
Figure 6‑2: Forecast for Chinese Outbound Tourists Market (Spending) Share by Purpose (Percent %), 2018 – 2024
Figure 7‑1: China Outbound Holiday Tourists (Thousand), 2011 – 2017
Figure 7‑2: Forecast for China Outbound Holiday Tourists (Thousand), 2018 – 2024
Figure 7‑3: China Outbound VFR Tourists (Thousand), 2011 – 2017
Figure 7‑4: Forecast for China Outbound VFR Tourists (Thousand), 2018 – 2024
Figure 7‑5: China Outbound Business Tourists (Thousand), 2011 – 2017
Figure 7‑6: Forecast for China Outbound Business Tourists (Thousand), 2018 – 2024
Figure 7‑7: China Outbound Other Tourists (Thousand), 2011 – 2017
Figure 7‑8: Forecast for China Outbound Other Tourists (Thousand), 2018 – 2024
Figure 8‑1: China Outbound Holiday Tourists Market (Spending) (Million US$), 2011 – 2017
Figure 8‑2: Forecast for China Outbound Holiday Tourists Market (Spending) (Million US$), 2018 – 2024
Figure 8‑3: China Outbound VFR Tourists Market (Spending) (Million US$), 2011 – 2017
Figure 8‑4: Forecast for China Outbound VFR Tourists Market (Spending) (Million US$), 2018 – 2024
Figure 8‑5: China Outbound Business Tourists Market (Spending) (Million US$), 2011 – 2017
Figure 8‑6: Forecast for China Outbound Business Tourists Market (Spending) (Million US$), 2018 – 2024
Figure 8‑7: China Outbound Other Tourists Market (Spending) (Million US$), 2011 – 2017
Figure 8‑8: Forecast for China Outbound Other Tourists Market (Spending) (Million US$), 2018 – 2024
Figure 9‑1: Australia – China Outbound Tourists Visit to Australia (Thousand), 2011 – 2017
Figure 9‑2: Australia – Forecast for China Outbound Tourists Visit to Australia (Thousand), 2018 – 2024
Figure 9‑3: Australia – China Outbound Tourists Visit to Australia for Holiday (Thousand), 2011 – 2017
Figure 9‑4: Australia – Forecast for China Outbound Tourists Visit to Australia for Holiday (Thousand), 2018 – 2024
Figure 9‑5: Australia – China Outbound VFR Tourists Visit to Australia (Thousand), 2011 – 2017
Figure 9‑6: Australia – Forecast for China Outbound VFR Tourists Visit to Australia (Thousand), 2018 – 2024
Figure 9‑7: Australia – China Outbound Business Tourists Visit to Australia (Thousand), 2011 – 2017
Figure 9‑8: Australia – Forecast for China Outbound Business Tourists Visit to Australia (Thousand), 2018 – 2024
Figure 9‑9: Australia – China Outbound Others Tourists Visit to Australia (Thousand), 2011 – 2017
Figure 9‑10: Australia – Forecast for China Outbound Others Tourists Visit to Australia (Thousand), 2018 – 2024
Figure 9‑11: Australia – China Outbound Tourists Market (Spending) (Million US$), 2011 – 2017
Figure 9‑12: Australia – Forecast for China Outbound Tourists Market (Spending) (Million US$), 2018 – 2024
Figure 9‑13: Australia – China Outbound Holiday Tourists Market (Spending) (Million US$), 2011 – 2017
Figure 9‑14: Australia – Forecast for China Outbound Holiday Tourists Market (Spending) (Million US$), 2018 – 2024
Figure 9‑15: Australia – China Outbound VFR Tourists Market (Spending) (Million US$), 2011 – 2016
Figure 9‑16: Australia – Forecast for China Outbound VFR Tourists Market (Spending) (Million US$), 2017 – 2022
Figure 9‑17: Australia – China Outbound Business Tourists Market (Spending) (Million US$), 2011 – 2016
Figure 9‑18: Australia – Forecast for China Outbound Business Tourists Market (Spending) (Million US$), 2017 – 2022
Figure 9‑19: Australia – China Outbound Other Tourists Market (Spending) (Million US$), 2011 – 2017
Figure 9‑20: Australia – Forecast for China Outbound Other Tourists Market (Spending) (Million US$), 2018 – 2024
Figure 10‑1: Canada – China Outbound Tourists Visit to Canada (Thousand), 2011 – 2017
Figure 10‑2: Canada – Forecast for China Outbound Tourists Visit to Canada (Thousand), 2018 – 2024
Figure 10‑3: Canada – China Outbound Holiday Tourists Visit to Canada (Thousand), 2011 – 2017
Figure 10‑4: Canada – Forecast for China Outbound Holiday Tourists Visit to Canada (Thousand), 2018 – 2024
Figure 10‑5: Canada – China Outbound VFR Tourists Visit to Canada (Thousand), 2011 – 2017
Figure 10‑6: Canada – Forecast for China Outbound VFR Tourists Visit to Canada (Thousand), 2018 – 2024
Figure 10‑7: Canada – China Outbound Business Tourists Visit to Canada (Thousand), 2011 – 2017
Figure 10‑8: Canada – Forecast for China Outbound Business Tourists Visit to Canada (Thousand), 2018- 2024
Figure 10‑9: Canada – China Outbound Other Tourists Visit to Canada (Thousand), 2011 – 2017
Figure 10‑10: Canada – Forecast for China Outbound Other Tourists Visit to Canada (Thousand), 2018 – 2024
Figure 10‑11: Canada – China Outbound Tourists Market (Spending) (Million US$), 2011 – 2017
Figure 10‑12: Canada – Forecast for China Outbound Tourists Market (Spending) (Million US$), 2018 – 2024
Figure 10‑13: Canada – China Outbound Holiday Tourists Market (Spending) (Million US$), 2011 – 2017
Figure 10‑14: Canada – Forecast for China Outbound Holiday Tourists Market (Spending) (Million US$), 2018 – 2024
Figure 10‑15: Canada – China Outbound VFR Tourists Market (Spending) (Million US$), 2011 – 2017
Figure 10‑16: Canada – Forecast for China Outbound VFR Tourists Market (Spending) (Million US$), 2018 – 2024
Figure 10‑17: Canada – China Outbound Business Tourists Market (Spending) (Million US$), 2011 – 2017
Figure 10‑18: Canada – Forecast for China Outbound Business Tourists Market (Spending) (Million US$), 2018 – 2024
Figure 10‑19: Canada – China Outbound Other Tourists Market (Spending) (Million US$), 2011 – 2017
Figure 10‑20: Canada – Forecast for China Outbound Other Tourists Market (Spending) (Million US$), 2018 – 2024
Figure 11‑1: Japan – China Outbound Tourists Visit to Japan (Thousand), 2011 – 2017
Figure 11‑2: Japan – Forecast for China Outbound Tourists Visit to Japan (Thousand), 2018 – 2024
Figure 11‑3: Japan – China Outbound Holiday Tourists Visit to Japan (Thousand), 2011– 2017
Figure 11‑4: Japan – Forecast for China Outbound Holiday Tourists Visit to Japan (Thousand), 2018– 2024
Figure 11‑5: Japan – China Outbound Business Tourists Visit to Japan (Thousand), 2011 – 2017
Figure 11‑6: Japan – Forecast for China Outbound Business Tourists Visit to Japan (Thousand), 2018– 2024
Figure 11‑7: Japan – China Outbound Other Tourists Visit to Japan (Thousand), 2011 – 2017
Figure 11‑8: Japan – Forecast for China Outbound Other Tourists Visit to Japan (Thousand), 2018 – 2024
Figure 11‑9: Japan – China Outbound Tourists Market (Spending) (Million US$), 2011 – 2017
Figure 11‑10: Japan – Forecast for China Outbound Tourists Market (Spending) (Million US$), 2018 – 2024
Figure 11‑11: Japan – China Outbound Holiday Tourists Market (Spending) (Million US$), 2011 – 2017
Figure 11‑12: Japan – Forecast for China Outbound Holiday Tourists Market (Spending) (Million US$), 2018 – 2024
Figure 11‑13: Japan – China Outbound Business Tourists Market (Spending) (Million US$), 2011 – 2017
Figure 11‑14: Japan – Forecast for China Outbound Business Tourists Market (Spending) (Million US$), 2018 – 2024
Figure 11‑15: Japan – China Outbound Other Tourists Market (Spending) (Million US$), 2011 – 2017
Figure 11‑16: Japan – Forecast for China Outbound Other Tourists Market (Spending) (Million US$), 2018 – 2024
Figure 12‑1: South Korea – China Outbound Tourists Visit to South Korea (Thousand), 2011 – 2017
Figure 12‑2: South Korea – Forecast for China Outbound Tourists Visit to South Korea (Thousand), 2018 – 2024
Figure 12‑3: South Korea – China Outbound Holiday Tourists Visit to South Korea (Thousand), 2011 – 2017
Figure 12‑4: South Korea – Forecast for China Outbound Holiday Tourists Visit to South Korea (Thousand), 2018 – 2024
Figure 12‑5: South Korea – China Outbound Business Tourists Visit to South Korea (Thousand), 2011 – 2017
Figure 12‑6: South Korea – Forecast for China Outbound Business Tourists Visit to South Korea (Thousand), 2018 – 2024
Figure 12‑7: South Korea – China Outbound Official Tourists Visit to South Korea (Thousand), 2011 – 2017
Figure 12‑8: South Korea – Forecast for China Outbound Official Tourists Visit to Korea (Thousand), 2018 – 2024
Figure 12‑9: South Korea – China Outbound Other Tourists Visit to South Korea (Thousand), 2011 – 2017
Figure 12‑10: South Korea – Forecast for China Outbound Other Tourists Visit to South Korea (Thousand), 2018 – 2024
Figure 12‑11: South Korea – China Outbound Tourists Market (Spending) (Million US$), 2011 – 2017
Figure 12‑12: South Korea – Forecast for China Outbound Tourists Market (Spending) (Million US$), 2018 – 2024
Figure 12‑13: South Korea – China Outbound Holiday Tourists Market (Spending) (Million US$), 2011 – 2017
Figure 12‑14: South Korea – Forecast for China Outbound Holiday Tourists Market (Spending) (Million US$), 2018 – 2024
Figure 12‑15: South Korea – China Outbound Business Tourists Market (Spending) (Million US$), 2011 – 2017
Figure 12‑16: South Korea – Forecast for China Outbound Business Tourists Market (Spending) (Million US$), 2018 – 2024
Figure 12‑17: South Korea – China Outbound Official Tourists Market (Spending) (Million US$), 2011 – 2017
Figure 12‑18: South Korea – Forecast for China Outbound Official Tourists Market (Spending) (Million US$), 2018 – 2024
Figure 12‑19: South Korea – China Outbound Other Tourists Market (Spending) (Million US$), 2011 – 2017
Figure 12‑20: South Korea – Forecast for China Outbound Other Tourists Market (Spending) (Million US$), 2018 – 2024
Figure 13‑1: New Zealand – China Outbound Tourists Visit to New Zealand (Thousand), 2011 – 2017
Figure 13‑2: New Zealand – Forecast for China Outbound Tourists Visit to New Zealand (Thousand), 2018 – 2024
Figure 13‑3: New Zealand – China Outbound Holiday Tourists Visit to New Zealand (Thousand), 2011 – 2017
Figure 13‑4: New Zealand – Forecast for China Outbound Holiday Tourists Visit to New Zealand (Thousand), 2018 – 2024
Figure 13‑5: New Zealand – China Outbound VFR Tourists Visit to New Zealand (Thousand), 2011 – 2017
Figure 13‑6: New Zealand – Forecast for China Outbound VFR Tourists Visit to New Zealand (Thousand), 2018 – 2024
Figure 13‑7: New Zealand – China Outbound Business Tourists Visit to New Zealand (Thousand), 2011 – 2017
Figure 13‑8: New Zealand – Forecast for China Outbound Business Tourists Visit to New Zealand (Thousand), 2018 – 2024
Figure 13‑9: New Zealand – China Outbound Conferences & Conventions Tourists Visit to New Zealand (Thousand), 2011 – 2017
Figure 13‑10: New Zealand – Forecast for China Outbound Conferences & Conventions Tourists Visit to New Zealand (Thousand), 2018 – 2024
Figure 13‑11: New Zealand – China Outbound Education Tourists Visit to New Zealand (Thousand), 2011 – 2017
Figure 13‑12: New Zealand – Forecast for China Outbound Education Tourists Visit to New Zealand (Thousand), 2018 – 2024
Figure 13‑13: New Zealand – China Outbound Other Tourists Visit to New Zealand (Thousand), 2011 – 2017
Figure 13‑14: New Zealand – Forecast for China Outbound Other Tourists Visit to New Zealand (Thousand), 2018 – 2024
Figure 13‑15: New Zealand – China Outbound Tourists Market (Spending) (Million US$), 2011 – 2017
Figure 13‑16: New Zealand – Forecast for China Outbound Tourists Market (Spending) (Million US$), 2018 – 2024
Figure 13‑17: New Zealand – China Outbound Holiday Tourists Market (Spending) (Million US$), 2011 – 2017
Figure 13‑18: New Zealand – Forecast for China Outbound Holiday Tourists Market (Spending) (Million US$), 2018 – 2024
Figure 13‑19: New Zealand – China Outbound VFR Tourists Market (Spending) (Million US$), 2011 – 2017
Figure 13‑20: New Zealand – Forecast for China Outbound VFR Tourists Market (Spending) (Million US$), 2018 – 2024
Figure 13‑21: New Zealand – China Outbound Business Tourists Market (Spending) (Million US$), 2011 – 2017
Figure 13‑22: New Zealand – Forecast for China Outbound Business Tourists Market (Spending) (Million US$), 2018 – 2024
Figure 13‑23: New Zealand – China Outbound Conferences & Conventions Tourists Market (Spending) (Million US$), 2011 – 2017
Figure 13‑24: New Zealand – Forecast for China Outbound Conferences & Conventions Tourists Market (Spending) (Million US$), 2018 – 2024
Figure 13‑25: New Zealand – China Outbound Education Tourists Market (Spending) (Million US$), 2011 – 2017
Figure 13‑26: New Zealand – Forecast for China Outbound Education Tourists Market (Spending)Zealand (Million US$), 2018 – 2024
Figure 13‑27: New Zealand – China Outbound Other Tourists Market (Spending) (Million US$), 2011 – 2017
Figure 13‑28: New Zealand – Forecast for China Outbound Other Tourists Market (Spending) (Million US$), 2018 – 2024
Figure 14‑1: Singapore – China Outbound Tourists Visit to Singapore (Thousand), 2011 – 2017
Figure 14‑2: Singapore – Forecast for China Outbound Tourists Visit to Singapore (Thousand), 2018 – 2024
Figure 14‑3: Singapore – China Outbound Holiday Tourists Visit to Singapore (Thousand), 2011 – 2017
Figure 14‑4: Singapore – Forecast for China Outbound Holiday Tourists Visit to Singapore (Thousand), 2018 – 2024
Figure 14‑5: Singapore – China Outbound VFR Tourists Visit to Singapore (Thousand), 2011 – 2017
Figure 14‑6: Singapore – Forecast for China Outbound VFR Tourists Visit to Singapore (Thousand), 2018 – 2024
Figure 14‑7: Singapore – China Outbound Business Tourists Visit to Singapore (Thousand), 2011 – 2017
Figure 14‑8: Singapore – Forecast for China Outbound Business Tourists Visit to Singapore (Thousand), 2018 – 2024
Figure 14‑9: Singapore – China Outbound Conferences Tourists Visit to Singapore (Thousand), 2011 – 2017
Figure 14‑10: Singapore – Forecast for China Outbound Conferences Tourists Visit to Singapore (Thousand), 2018 – 2024
Figure 14‑11: Singapore – China Outbound Unstated Tourists Visit to Singapore (Thousand), 2011 – 2017
Figure 14‑12: Singapore – Forecast for China Outbound Unstated Tourists Visit to Singapore (Thousand), 2018 – 2024
Figure 14‑13: Singapore – China Outbound Other Tourists Visit to Singapore (Thousand), 2011 – 2017
Figure 14‑14: Singapore – Forecast for China Outbound Other Tourists Visit to Singapore (Thousand), 2018 – 2024
Figure 14‑15: Singapore – China Outbound Tourists Market (Spending) (Million US$), 2011 – 2017
Figure 14‑16: Singapore – Forecast for China Outbound Tourists Market (Spending) (Million US$), 2018 – 2024
Figure 14‑17: Singapore – China Outbound Holiday Tourists Market (Spending) (Million US$), 2011 – 2017
Figure 14‑18: Singapore – Forecast for China Outbound Holiday Tourists Market (Spending) (Million US$), 2018 – 2024
Figure 14‑19: Singapore – China Outbound VFR Tourists Market (Spending) (Million US$), 2011 – 2017
Figure 14‑20: Singapore – Forecast for China Outbound VFR Tourists Market (Spending) (Million US$), 2018 – 2024
Figure 14‑21: Singapore – China Outbound Business Tourists Market (Spending) (Million US$), 2011 – 2017
Figure 14‑22: Singapore – Forecast for China Outbound Business Tourists Market (Spending) (Million US$), 2018 – 2024
Figure 14‑23: Singapore – China Outbound Conferences Tourists Market (Spending) (Million US$), 2011 – 2017
Figure 14‑24: Singapore – Forecast for China Outbound Conferences Tourists Market (Spending) (Million US$), 2018 – 2024
Figure 14‑25: Singapore – China Outbound Unstated Tourists Market (Spending) (Million US$), 2011– 2017
Figure 14‑26: Singapore – Forecast for China Outbound Unstated Tourists Market (Spending) (Million US$), 2018 – 2024
Figure 14‑27: Singapore – China Outbound Other Tourists Market (Spending) (Million US$), 2011 – 2017
Figure 14‑28: Singapore – Forecast for China Outbound Other Tourists Market (Spending) (Million US$), 2018 – 2024
Figure 15‑1: Taiwan – China Outbound Tourists Visit to Taiwan (Thousand), 2011 – 2017
Figure 15‑2: Taiwan – Forecast for China Outbound Tourists Visit to Taiwan (Thousand), 2018 – 2024
Figure 15‑3: Taiwan – China Outbound Holiday Tourists Visit to Taiwan (Thousand), 2011 – 2017
Figure 15‑4: Taiwan – Forecast for China Outbound Holiday Tourists Visit to Taiwan (Thousand), 2018 – 2024
Figure 15‑5: Taiwan – China Outbound VFR Tourists Visit to Taiwan (Thousand), 2011 – 2017
Figure 15‑6: Taiwan – Forecast for China Outbound VFR Tourists Visit to Taiwan (Thousand), 2018 – 2024
Figure 15‑7: Taiwan – China Outbound Business Tourists Visit to Taiwan (Thousand), 2011 – 2017
Figure 15‑8: Taiwan – Forecast for China Outbound Business Tourists Visit to Taiwan (Thousand), 2018 – 2024
Figure 15‑9: Taiwan – China Outbound Conference Tourists Visit to Taiwan (Thousand), 2011 – 2017
Figure 15‑10: Taiwan – Forecast for China Outbound Conference Tourists Visit to Taiwan (Thousand), 2018 – 2024
Figure 15‑11: Taiwan – China Outbound Education Tourists Visit to Taiwan (Thousand), 2011 – 2017
Figure 15‑12: Taiwan – Forecast for China Outbound Education Tourists Visit to Taiwan (Thousand), 2018 – 2024
Figure 15‑13: Taiwan – China Outbound Other Tourists Visit to Taiwan (Thousand), 2011 – 2017
Figure 15‑14: Taiwan – Forecast for China Outbound Other Tourists Visit to Taiwan (Thousand), 2018 – 2024
Figure 15‑15: Taiwan – China Outbound Tourists Market (Spending) (Million US$), 2011 – 2017
Figure 15‑16: Taiwan – Forecast for China Outbound Tourists Market (Spending) (Million US$), 2018 – 2024
Figure 15‑17: Taiwan – China Outbound Holiday Tourists Market (Spending) (Million US$), 2011 – 2017
Figure 15‑18: Taiwan – Forecast for China Outbound Holiday Tourists Market (Spending) (Million US$), 2018 – 2024
Figure 15‑19: Taiwan – China Outbound VFR Tourists Market (Spending) (Million US$), 2011 – 2017
Figure 15‑20: Taiwan – Forecast for China Outbound VFR Tourists Market (Spending) (Million US$), 2018 – 2024
Figure 15‑21: Taiwan – China Outbound Business Tourists Market (Spending) (Million US$), 2011 – 2017
Figure 15‑22: Taiwan – Forecast for China Outbound Business Tourists Market (Spending) (Million US$), 2018 – 2024
Figure 15‑23: Taiwan – China Outbound Conference Tourists Market (Spending) (Million US$), 2011 – 2017
Figure 15‑24: Taiwan – Forecast for China Outbound Conference Tourists Market (Spending) (Million US$), 2018 – 2024
Figure 15‑25: Taiwan – China Outbound Education Tourists Market (Spending) (Million US$), 2011 – 2017
Figure 15‑26: Taiwan – Forecast for China Outbound Education Tourists Market (Spending) (Million US$), 2018 – 2024
Figure 15‑27: Taiwan – China Outbound Other Tourists Market (Spending) (Million US$), 2011 – 2017
Figure 15‑28: Taiwan – Forecast for China Outbound Other Tourists Market (Spending) (Million US$), 2018 – 2024
Figure 16‑1: Thailand – China Outbound Tourists Visit to Thailand (Thousand), 2011 – 2017
Figure 16‑2: Thailand – Forecast for China Outbound Tourists Visit to Thailand (Thousand), 2018 – 2024
Figure 16‑3: Thailand – China Outbound Holiday Tourists Visit to Thailand (Thousand), 2011 – 2017
Figure 16‑4: Thailand – Forecast for China Outbound Holiday Tourists Visit to Thailand (Thousand), 2018 – 2024
Figure 16‑5: Thailand – China Outbound VFR Tourists Visit to Thailand (Thousand), 2011 – 2017
Figure 16‑6: Thailand – Forecast for China Outbound VFR Tourists Visit to Thailand (Thousand), 2018 – 2024
Figure 16‑7: Thailand – China Outbound Business Tourists Visit to Thailand (Thousand), 2011 – 2017
Figure 16‑8: Thailand – Forecast for China Outbound Business Tourists Visit to Thailand (Thousand), 2018 – 2024
Figure 16‑9: Thailand – China Outbound Other Tourists Visit to Thailand (Thousand), 2011 – 2017
Figure 16‑10: Thailand – Forecast for China Outbound Other Tourists Visit to Thailand (Thousand), 2018 – 2024
Figure 16‑11: Thailand – China Outbound Tourists Market (Spending) (Million US$), 2011 – 2017
Figure 16‑12: Thailand – Forecast for China Outbound Tourists Market (Spending) (Million US$), 2018 – 2024
Figure 16‑13: Thailand – China Outbound Holiday Tourists Market (Spending) (Million US$), 2011– 2016
Figure 16‑14: Thailand – Forecast China Outbound Holiday Tourists Market (Spending) (Million US$), 2017 – 2022
Figure 16‑15: Thailand – China Outbound VFR Tourists Market (Spending) (Million US$), 2011 – 2017
Figure 16‑16: Thailand – Forecast China Outbound VFR Tourists Market (Spending) (Million US$), 2018 – 2024
Figure 16‑17: Thailand – China Outbound Business Tourists Market (Spending) (Million US$), 2011 – 2018
Figure 16‑18: Thailand – Forecast China Outbound Business Tourists Market (Spending) (Million US$), 2018 – 2024
Figure 16‑19: Thailand – China Outbound Other Tourists Market (Spending) (Million US$), 2011 – 2017
Figure 16‑20: Thailand – Forecast China Outbound Other Tourists Market (Spending) (Million US$), 2018 – 2024
Figure 17‑1: United States – China Outbound Tourists Visit to United States (Thousand), 2011 – 2017
Figure 17‑2: United States – Forecast for China Outbound Tourists Visit to United States (Thousand), 2018 – 2024
Figure 17‑3: United States – China Outbound Holiday Tourists Visit to United States (Thousand), 2011 – 2017
Figure 17‑4: United States – Forecast for China Outbound Holiday Tourists Visit to United States (Thousand), 2017 – 2022
Figure 17‑5: United States – China Outbound VFR Tourists Visit to United States (Thousand), 2011 – 2017
Figure 17‑6: United States – Forecast for China Outbound VFR Tourists Visit to United States (Thousand), 2018 – 2024
Figure 17‑7: United States – China Outbound Business Tourists Visit to United States (Thousand), 2011 – 2017
Figure 17‑8: United States – Forecast for China Outbound Business Tourists Visit to United States (Thousand), 2018 – 2024
Figure 17‑9: United States – China Outbound Education Tourists Visit to United States (Thousand), 2011 – 2017
Figure 17‑10: United States – Forecast for China Outbound Education Tourists Visit to United States (Thousand), 2018 – 2024
Figure 17‑11: United States – China Outbound Other Tourists Visit to United States (Thousand), 2011 – 2017
Figure 17‑12: United States – Forecast for China Outbound Other Tourists Visit to United States (Thousand), 2018 – 2024
Figure 17‑13: United States – China Outbound Tourists Market (Spending) (Million US$), 2011- 2017
Figure 17‑14: United States – Forecast for China Outbound Tourists Market (Spending) (Million US$), 2018 – 2024
Figure 17‑15: United States – China Outbound Holiday Tourists Market (Spending) (Million US$), 2011 – 2017
Figure 17‑16: United States – Forecast for China Outbound Holiday Tourists Market (Spending) (Million US$), 2018 – 2024
Figure 17‑17: United States – China Outbound VFR Tourists Market (Spending) (Million US$), 2011 – 2017
Figure 17‑18: United States – Forecast for China Outbound VFR Tourists Market (Spending) (Million US$), 2018 – 2024
Figure 17‑19: United States – China Outbound Business Tourists Market (Spending) (Million US$), 2011 – 2017
Figure 17‑20: United States – Forecast for China Outbound Business Tourists Market (Spending) (Million US$), 2018 – 2024
Figure 17‑21: United States – China Outbound Education Tourists Market (Spending) (Million US$), 2011 – 2017
Figure 17‑22: United States – Forecast for China Outbound Education Tourists Market (Spending) (Million US$), 2018 – 2024
Figure 17‑23: United States – China Outbound Other Tourists Market (Spending) (Million US$), 2011 – 2017
Figure 17‑24: United States – Forecast for China Outbound Other Tourists Market (Spending) (Million US$), 2018 – 2024
Figure 18‑1: Hong Kong – China Outbound Tourists Visit to Hong Kong (Thousand), 2011 – 2017
Figure 18‑2: Hong Kong – Forecast for China Outbound Tourists Visit to Hong Kong (Thousand), 2018 – 2024
Figure 18‑3: Hong Kong – China Outbound Holiday Tourists Visit to Hong Kong (Thousand), 2011 – 2017
Figure 18‑4: Hong Kong – Forecast for China Outbound Holiday Tourists Visit to Hong Kong (Thousand), 2018 – 2024
Figure 18‑5: Hong Kong – China Outbound VFR Tourists Visit to Hong Kong (Thousand), 2011 – 2017
Figure 18‑6: Hong Kong – Forecast for China Outbound VFR Tourists Visit to Hong Kong (Thousand), 2018 – 2024
Figure 18‑7: Hong Kong – China Outbound Business Tourists Visit to Hong Kong (Thousand), 2011 – 2017
Figure 18‑8: Hong Kong – Forecast for China Outbound Business Tourists Visit to Hong Kong (Thousand), 2018 – 2024
Figure 18‑9: Hong Kong – China Outbound En Route Tourists Visit to Hong Kong (Thousand), 2011 – 2017
Figure 18‑10: Hong Kong – Forecast for China Outbound En Route Tourists Visit to Hong Kong (Thousand), 2018 – 2024
Figure 18‑11: Hong Kong – China Outbound Other Tourists Visit to Hong Kong (Thousand), 2011 – 2017
Figure 18‑12: Hong Kong – Forecast for China Outbound Other Tourists Visit to Hong Kong (Thousand), 2018 – 2024
Figure 18‑13: Hong Kong – China Outbound Tourists Market (Spending) (Million US$), 2011 – 2017
Figure 18‑14: Hong Kong – Forecast China Outbound Tourists Market (Spending) (Million US$), 2018 – 2024
Figure 18‑15: Hong Kong – China Outbound Holiday Tourists Market (Spending) (Million US$), 2011 – 2017
Figure 18‑16: Hong Kong – Forecast for China Outbound Holiday Tourists Market (Spending) (Million US$), 2018 – 2024
Figure 18‑17: Hong Kong – China Outbound VFR Tourists Market (Spending) (Million US$), 2011 – 2017
Figure 18‑18: Hong Kong – Forecast for China Outbound VFR Tourists Market (Spending) (Million US$), 2018 – 2024
Figure 18‑19: Hong Kong – China Outbound Business Tourists Market (Spending) (Million US$), 2011 – 2017
Figure 18‑20: Hong Kong – Forecast for China Outbound Business Tourists Market (Spending) (Million US$), 2018 – 2024
Figure 18‑21: Hong Kong – China Outbound En Route Tourists Market (Spending) (Million US$), 2011 – 2017
Figure 18‑22: Hong Kong – Forecast for China Outbound En Route Tourists Market (Spending) (Million US$), 2018 – 2024
Figure 18‑23: Hong Kong – China Outbound Other Tourists Market (Spending) (Million US$), 2011 – 2017
Figure 18‑24: Hong Kong – Forecast for China Outbound Other Tourists Market (Spending) (Million US$), 2018 – 2024
Figure 19‑1: China – Number of Millionaires (By Province), 2013
Figure 19‑2: The Distribution of China’s Wealthy Population by City
Figure 20‑1: Factors Affecting Destination Choice
Figure 20‑2: Tourist Visa Fees to Major Travel Destinations
Figure 20‑3: Concerns of Tourists
Figure 20‑4: Specific worries of tourists before leaving
List of Tables:
Table 5‑1: China Outbound Tourists Share (Percent), 2011 – 2017
Table 5‑2: Forecast for China Outbound Tourists Share (Percent), 2018 – 2024
Table 5‑3: China Outbound Holiday Tourists Share (Percent %), 2011 – 2017
Table 5‑4: Forecast for China Outbound Holiday Tourists Share (Percent %), 2018 – 2024
Table 5‑5: China Outbound VFR Tourists Share (Percent %), 2011 – 2017
Table 5‑6: Forecast for China Outbound VFR Tourists Share (Percent %), 2018 – 2024
Table 5‑7: China Outbound Business Tourists Share (Percent %), 2011– 2017
Table 5‑8: Forecast for China Outbound Business Tourists Share (Percent %), 2018 – 2024
Table 5‑9: China Outbound Other Tourist Share (Percent %), 2011 – 2017
Table 5‑10: Forecast for China Outbound Other Tourists Share (Percent %), 2018 – 2024
Table 6‑1: Chinese Outbound Tourists Market (Spending) Share (Percent %), 2011 – 2017
Table 6‑2: Forecast for Chinese Outbound Tourists Market (Spending) Share (Percent %), 2018 – 2024
Table 6‑3: China Outbound Holiday Tourists Market (Spending) Share (Percent %), 2011 – 2017
Table 6‑4: Forecast for China Outbound Holiday Tourists Market (Spending) Share (Percent %), 2018 – 2024
Table 6‑5: China Outbound VFR Tourists Market (Spending) Share (Percent %), 2011 – 2017
Table 6‑6: Forecast for China Outbound VFR Tourists Market (Spending) Share (Percent %), 2018 – 2024
Table 6‑7: China Outbound Business Tourists Market (Spending) Share (Percent %), 2011 – 2017
Table 6‑8: Forecast for China Outbound Business Tourists Market (Spending) Share (Percent %), 2018 – 2024
Table 6‑9: China Outbound Other Tourists Market (Spending) Share (Percent %), 2011 – 2017
Table 6‑10: Forecast for China Outbound Other Tourists Market (Spending) Share (Percent %), 2018 – 2024
Table 19‑1: China – ADS Approved Countries (Year, Countries Name, Total), 1983 – 2012
Reach out to us
Call us on
USA: +1-478-202-3244
INDIA: +91-120-421-9822
Drop us an email at
info@renub.com