
")
India Outbound Tourism Market, Tourists Purpose of Visit (Holiday, VFR, Business, Others) Tourists Spending, Top 11 Countries Forecast
Get Free Customization in This Report
Indian Outbound Tourism Market is expected to surpass US$ 42 Billion by the end of year 2024. India is second largest most populous country in the world with the tag of fastest growing major economy globally. Due to this economic growth, its people are earning more year on year and their disposable income is also growing. Air connectivity from India to foreign locations has also improved significantly over period of time. First time Indian visitors generally prefer to visit Asian countries due to their proximity to India and being less expensive compared to western destinations. In the case of long-haul travel Indians prefer going to United States (US), Australia, Europe, New Zealand etc.
Thailand, Singapore and United States are the most favorite Tourist Destination for Indians
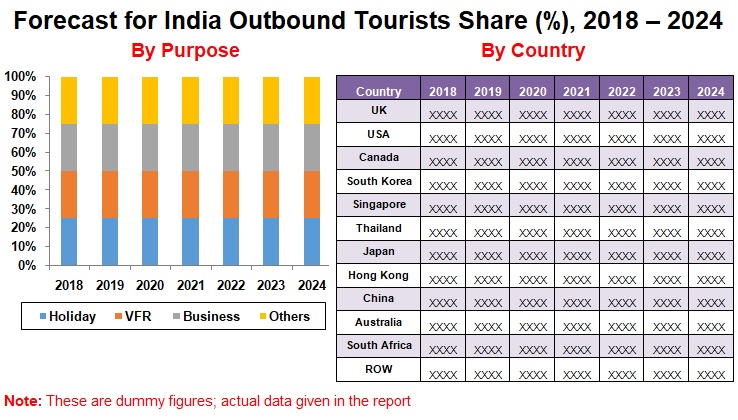
In this report, we have done comprehensive analysis of top 11 destinations for India outbound tourist. We have also studied the number of separate factors that affects Indian outbound tourist to each of 11 destinations. In addition, we have done detailed analysis of growth drivers.
Request a free sample copy of the report: https://www.renub.com/contactus.php
Number of Indian Business Tourists visited Japan is bigger than Holiday Tourists Number
According to Renub Research analysis, the number of business tourist from India visited Japan is larger than the number of holiday tourist. Indian outbound business tourist to China is also showing positive trend and will be continue in forecast period of time. Indian tourists visit to Thailand in huge numbers because of its affordability and proximity. Thailand currency (Thai Baht) gaining the benefit of tourism arrival due to strong position against Dollar and Euro.
United States is Prime Destination for Higher Spending
United States is prime destination for Indian outbound travelers in the world. Around more than 1/3rd the total worldwide expenditure by Indian tourist is spent in United States alone. United States is popular destination for the entire segment like holiday, VFR, Business and Others.
Renub Research report entitled “India Outbound Tourism Market, Tourists Purpose of Visit (Holiday, VFR (Visit Friends & Relatives), Business, Others) Tourists Spending, Countries (Hong Kong, Japan, Singapore, United States, United Kingdom, Thailand, Australia, Canada, South Africa, China, South Korea) & Forecast” is the 4th edition report on the fast-evolving, high-growth India Outbound Travel Industry.
This market research report provides a complete analysis of top 11 countries of India outbound tourism market. All the country in the report has been studied from 5 view points
1) India Outbound Tourists Numbers
2) India Outbound Tourists Market (Spending)
3) India Outbound Tourists Tourism Types (Business, Holiday/Leisure, VFR & Others)
4) India Outbound Tourism Types Market (Business, Holiday/Leisure, VFR & Others)
5) Growth Drivers and Challenges Analysis
Top 11 Countries Analysed
1. Singapore
2. Thailand
3. United States
4. Hong Kong
5. United Kingdom
6. Australia
7. China
8. Canada
9. Japan
10. South Africa
11. South Korea
Client can purchase this report in sections through Purchase by Chapter Tab given above
Tourism Types (Purpose of Visit) – Tourists Numbers & Market for Each Country
• Holiday
• VFR (Visit Friends & Relatives)
• Business
• Others
Who should buy this Report?
• This report is useful for those who want to know Tourism Market of India
• Which is most favourable destination for India outbound Tourist?
• Which is most favourable destination for India outbound spending?
• Which Country is most attractive for holiday/Business/VFR/Others purpose outbound tourist?
• Which country is most spending destination for holiday/Business/VFR/Others purpose travellers?
We recommend this report as must-read for Travel and Tour stake holders, Hotel Industry, Tourism Ministry, Consulting firms, Private Equity firms, Venture Capital firms etc.
If the information you seek is not included in the current scope of the study kindly share your specific requirements with our custom research team at info@renub.com
1. Research Findings
2. India Outbound Tourists Numbers & Forecast
3. Tourists Share – India Outbound Tourism (2012 – 2024)
3.1 By Country
3.2 By Tourism Types (Holiday, Business, VFR, Others)
4. India Outbound Tourism Market & Forecast
5. Market Share – India Outbound Tourism (2012 – 2024)
5.1 By Country
5.2 By Tourism Types – (Holiday, Business, VFR, Others)
6. Countries Tourists Share – Tourism Types (2012 – 2024)
6.1 Holiday
6.2 VFR (Visiting Friends & Relatives)
6.3 Business
6.4 Others
7. Countries Market (Spending) Share – Tourism Types
7.1 Holiday
7.2 VFR (Visiting Friends & Relatives)
7.3 Business
7.4 Others
8. Tourism Types – India Outbound Tourists Numbers (2012 – 2024)
8.1 Holiday
8.2 VFR (Visit Friends & Relatives)
8.3 Business
8.4 Other
9. Tourism Types – India Outbound Tourists Market (Spending) (2012 – 2024)
9.1 Holiday
9.2 VFR (Visit Friends & Relatives)
9.3 Business (Meetings Incentive Conferences Exhibitions)
9.4 Other
10. Australia – India Outbound Tourists Visits, Market (Spending) (2010 – 2024)
10.1 Tourists Numbers
10.2 Tourism Types – By Numbers
10.2.1 Holiday – Tourists Numbers
10.2.2 VFR (Visit Friend & Relatives) – Tourists Numbers
10.2.3 Business (MICE) – Tourists Numbers
10.2.4 Others – Tourists Numbers
10.3 Tourists Market (Spending)
10.4 Tourism Types – By Market
10.4.1 Holiday – Tourism Market (Spending)
10.4.2 Visit Friend & Relatives (VFR) – Tourism Market (Spending)
10.4.3 Business – Tourism Market (Spending)
10.4.4 Others – Tourists Market (Spending)
11. Canada – India Outbound Tourists Visits, Market (Spending) (2011 – 2022)
11.1 Tourists Numbers
11.2 Tourism Types – Tourists Numbers
11.2.1 Holiday – Tourists Numbers
11.2.2 Visit Friend & Relatives (VFR) – Tourists Numbers
11.2.3 Business (MICE) – Tourists Numbers
11.2.4 Others – Tourists Numbers
11.3 Tourism Market (Spending)
11.4 Tourism Types – By Market (Spending)
11.4.1 Holiday – Tourism Market (Spending)
11.4.2 Visit Friend & Relatives (VFR) – Tourists Market (Spending)
11.4.3 Business (MICE) – Tourists Market (Spending)
11.4.4 Others – Tourists Market (Spending)
12. Japan – India Outbound Tourists Visits, Market (Spending) (2010 – 2024)
12.1 Tourists Numbers
12.2 Tourism Types – Tourists
12.2.1 Holiday – Tourists Numbers
12.2.2 Business (MICE) – Tourists Numbers
12.2.3 Others – Tourists Numbers
12.3 Tourism Market (Spending)
12.4 Tourism Types – Tourists Market (Spending)
12.4.1 Holiday – Tourism Market
12.4.2 Business (MICE) – Tourism Market
12.4.3 Others – Tourism Market
13. South Korea – India Outbound Tourists Visits, Market (Spending) (2010 – 2024)
13.1 Tourists Numbers
13.2 Tourism Types – Tourists Numbers
13.2.1 Holiday – Tourists Numbers
13.2.2 Business (MICE) – Tourists Numbers
13.2.3 Others – Tourists Numbers
13.3 Tourists Market (Spending)
13.4 Tourism Types – Tourists Market (Spending)
13.4.1 Holiday – Tourism Market
13.4.2 Business (MICE) – Tourism
13.4.3 Others – Tourism Market
14. China – India Outbound Tourists Visits, Market (Spending) (2010 – 2024)
14.1 Tourists Numbers
14.2 Tourism Type – Tourists Numbers
14.2.1 Holiday – Tourists Numbers
14.2.2 Visit Friends & Relatives (VFR) – Tourists Numbers
14.2.3 Business (MICE) – Tourists Numbers
14.2.4 Others – Tourists Numbers
14.3 Tourism Market
14.4 Tourism Type – Tourism Market (Spending)
14.4.1 Holiday – Tourism Market
14.4.2 Visiting Friends & Relatives (VFR) - Tourism Market
14.4.3 Business (MICE) – Tourism Market
14.4.4 Others – Tourism Market
15. Singapore – India Outbound Tourists Visits, Market (Spending) (2010 – 2024)
15.1 Tourists Numbers
15.2 Tourism Types – Tourists Numbers
15.2.1 Holiday – Tourists Numbers
15.2.2 Visiting Friends & Relatives (VFR) – Tourists Numbers
15.2.3 Business – Tourists Numbers
15.2.4 Other Purpose – Tourists Numbers
15.3 Tourists Market (Spending)
15.4 Tourism Types – Tourism Market (Spending)
15.4.1 Holiday – Tourists Market
15.4.2 Visiting Friends & Relatives (VFR) – Tourism Market
15.4.3 Business – Tourism Market
15.4.4 Others – Tourism Market
16. Thailand – India Outbound Tourists Visits, Market (Spending) (2012 – 2024)
16.1 Tourists Numbers
16.2 Tourism Types – Tourists Numbers
16.2.1 Holiday - Tourists Numbers
16.2.2 Business – Tourists Numbers
16.2.3 Others – Tourists Numbers
16.3 Tourists Market (Spending)
16.4 Tourism Types – Tourism Market (Spending)
16.4.1 Holiday – Tourism Market
16.4.2 Business – Tourists Market
16.4.3 Others – Tourists Market
17. United States – India Outbound Tourists Visits, Market (Spending) (2011 – 2024)
17.1 Tourists Numbers
17.2 Tourism Types – Tourists Numbers
17.2.1 Holiday – Tourists Numbers
17.2.2 Visit Friends & Relatives (VFR) – Tourists Numbers
17.2.3 Business/Conference – Tourists Numbers
17.2.4 Others – Tourists Numbers
17.3 Tourists Market (Spending)
17.4 Tourism Types – Tourism Market (Spending)
17.4.1 Holiday – Tourism Market
17.4.2 Visit Friends & Relatives (VFR) – Tourism Market
17.4.3 Business - Tourism Market
17.4.4 Others – Tourism Market
18. Hong Kong – India Outbound Tourists Visits, Market (Spending) (2011 – 2024)
18.1 Tourists Numbers & Forecast
18.2 Tourism Types – Tourists Numbers
18.2.1 Holiday (Vacation) – Tourists Numbers
18.2.2 Visiting Friends & Relatives (VFR) – Tourists Numbers
18.2.3 Business/Meeting – Tourists Numbers
18.2.4 En Route – Tourists Numbers
18.2.5 Others – Tourists Numbers
18.3 Tourism Market (Spending)
18.4 Tourism Types – Tourism Market (Spending)
18.4.1 Holiday – Tourism Market
18.4.2 Visiting Friends & Relatives (VFR) – Tourism Market
18.4.3 Business – Tourism Market
18.4.4 En Route – Tourism Market
18.4.5 Others – Tourism Market
19. United Kingdom – India Outbound Tourists Visits, Market (Spending) (2010 – 2024)
19.1 Tourists Numbers
19.2 Tourism Types – Tourists Numbers
19.2.1 Holiday – Tourists Numbers
19.2.2 Visit Friend & Relatives (VFR) – Tourists Numbers
19.2.3 Business (MICE) – Tourists Numbers
19.2.4 Others – Tourists Numbers
19.3 Tourism Market (Spending)
19.4 Tourism Types – Tourism Market (Spending)
19.4.1 Holiday – Tourism Market
19.4.2 Visit Friend & Relatives (VFR) – Tourism Market
19.4.3 Business Purpose – Tourism Market
19.4.4 Others – Tourism Market
20. South Africa – India Outbound Tourists Visits, Market (Spending) (2010 – 2024)
20.1 Tourists Numbers
20.2 Tourism Types – Tourists Numbers
20.2.1 Holiday – Tourists Numbers
20.2.2 Business (MICE) – Tourists V Numbers
20.2.3 Others – Tourists Numbers
20.3 Tourism Market (Spending)
20.4 Tourism Types – Tourism Market (Spending)
20.4.1 Holiday – Tourism Market
20.4.2 Business (MICE) – Tourism Market
20.4.3 Others – Tourism Market
21. Growth Drivers
21.1 Foreign Tourism Boards Encourage Indian Outbound Travelers with Incentives
21.2 Countries Tourism Board Opening Tourism Offices in India
21.3 Growing Middle-Class Population with Higher Disposable Income in India
21.4 Outbound Tour Operators Association of India (OTOAI) & Proliferation of the Internet Promoting Quality Tourism
22. Challenges
22.1 Indian Travel Agencies Facing Issues
22.2 Rupee Depreciation Hits Outbound Tourism Sector
22.3 Visas & Cuisine
22.4 Destination Brand Awareness
List of Figures:
Figure 2‑1: India Outbound Tourists (Thousand), 2012 – 2017
Figure 2‑2: Forecast for India Outbound Tourists (Thousand), 2018 – 2024
Figure 3‑1: India Outbound Tourists Share by Purpose (Percent %), 2012 – 2017
Figure 3‑2: Forecast for India Outbound Tourists Share by Purpose (Percent %), 2018– 2024
Figure 4‑1: India Outbound Tourists Market (Spending) (Billion US$), 2012 – 2017
Figure 4‑2: Forecast for India Outbound Tourists Market (Spending) (Billion US$), 2018 – 2024
Figure 5‑1: India Outbound Tourists Market (Spending) Share by Purpose (Percent %), 2012 – 2017
Figure 5‑2: Forecast for India Outbound Tourists Market (Spending) Share by Purpose (Percent %), 2018 – 2024
Figure 8‑1: India Outbound Holiday Tourists (Thousand), 2012 – 2017
Figure 8‑2: Forecast for India Outbound Holiday Tourists (Thousand), 2018 – 2024
Figure 8‑3: India Outbound VFR Tourists (Thousand), 2012 – 2017
Figure 8‑4: Forecast for India Outbound VFR Tourists (Thousand), 2018 – 2024
Figure 8‑5: India Outbound Business Tourists (Thousand), 2012 – 2017
Figure 8‑6: Forecast for India Outbound Business Tourists (Thousand), 2018 – 2024
Figure 8‑7: India Outbound Other Tourists (Thousand), 2012 – 2017
Figure 8‑8: Forecast for India Outbound Other Tourists (Thousand), 2018 – 2024
Figure 9‑1: India Outbound Holiday Tourists Market (Spending) (Million US$), 2012 – 2017
Figure 9‑2: Forecast for India Outbound Holiday Tourists Market (Spending) (Million US$), 2018 –2024
Figure 9‑3: India Outbound VFR Tourists Market (Spending) (Million US$), 2012 – 2017
Figure 9‑4: Forecast for India Outbound VFR Tourists Market (Spending) (Million US$), 2018 – 2024
Figure 9‑5: India Outbound Business Tourists Market (Spending) (Million US$), 2012 – 2017
Figure 9‑6: Forecast for India Outbound Business Tourists Market (Spending) (Million US$), 2018 – 2024
Figure 9‑7: India Outbound Other Tourists Market (Spending) (Million US$), 2012 – 2017
Figure 9‑8: Forecast for India Outbound Other Tourists Market (Spending) (Million US$), 2018 – 2024
Figure 10‑1: Australia – India Outbound Tourists Numbers to Australia (Thousand), 2010 – 2017
Figure 10‑2: Australia – Forecast for India Outbound Tourists Numbers to Australia (Thousand), 2018 – 2024
Figure 10‑3: Australia – India Outbound Tourists Numbers to Australia for Holiday (Thousand), 2010 – 2017
Figure 10‑4: Australia – Forecast for India Outbound Tourists Numbers to Australia for Holiday (Thousand), 2018 – 2024
Figure 10‑5: Australia – India Outbound VFR Tourists Numbers to Australia (Thousand), 2010 – 2017
Figure 10‑6: Australia – Forecast for India Outbound VFR Tourists Numbers to Australia (Thousand), 2018 – 2024
Figure 10‑7: Australia – India Outbound Business Tourists Numbers to Australia (Thousand), 2010 – 2017
Figure 10‑8: Australia – Forecast for India Outbound Business Tourists Numbers to Australia (Thousand), 2018 – 2024
Figure 10‑9: Australia – India Outbound Others Tourists Numbers to Australia (Thousand), 2010 – 2017
Figure 10‑10: Australia – Forecast for India Outbound Others Tourists Numbers to Australia (Thousand), 2018 – 2024
Figure 10‑11: Australia – India Outbound Tourists Market (Spending) (Million US$), 2010 – 2017
Figure 10‑12: Australia – Forecast for India Outbound Tourists Market (Spending) (Million US$), 2018 – 2024
Figure 10‑13: Australia – India Outbound Holiday Tourists Market (Spending) (Million US$), 2010 – 2017
Figure 10‑14: Australia – Forecast for India Outbound Holiday Tourists Market (Spending) (Million US$), 2018 – 2024
Figure 10‑15: Australia – India Outbound VFR Tourists Market (Spending) (Million US$), 2010 – 2017
Figure 10‑16: Australia – Forecast for India Outbound VFR Tourists Market (Spending) (Million US$), 2018 – 2024
Figure 10‑17: Australia – India Outbound Business Tourists Market (Spending) (Million US$), 2010 – 2017
Figure 10‑18: Australia – Forecast for India Outbound Business Tourists Market (Spending) (Million US$), 2018 – 2024
Figure 10‑19: Australia – India Outbound Other Tourists Market (Spending) (Million US$), 2010 – 2017
Figure 10‑20: Australia – Forecast for India Outbound Other Tourists Market (Spending) (Million US$), 2018 – 2024
Figure 11‑1: Canada – India Outbound Tourists Numbers to Canada (Thousand), 2010 – 2017
Figure 11‑2: Canada – Forecast for India Outbound Tourists Numbers to Canada (Thousand), 2018 – 2024
Figure 11‑3: Canada – India Outbound Holiday Tourists Numbers to Canada (Thousand), 2010 – 2017
Figure 11‑4: Canada – Forecast for India Outbound Holiday Tourists Numbers to Canada (Thousand), 2018 – 2024
Figure 11‑5: Canada – India Outbound VFR Tourists Numbers to Canada (Thousand), 2010 – 2017
Figure 11‑6: Canada – Forecast for India Outbound VFR Tourists Numbers to Canada (Thousand), 2018 – 2024
Figure 11‑7: Canada – India Outbound Business Tourists Visit to Canada (Thousand), 2010 – 2017
Figure 11‑8: Canada – Forecast for India Outbound Business Tourists Visit to Canada (Thousand), 2018- 2024
Figure 11‑9: Canada – India Outbound Other Tourists Visit to Canada (Thousand), 2010 – 2017
Figure 11‑10: Canada – Forecast for India Outbound Other Tourists Visit to Canada (Thousand), 2018 – 2024
Figure 11‑11: Canada – India Outbound Tourists Market (Spending) (Million US$), 2010 – 2017
Figure 11‑12: Canada – Forecast for India Outbound Tourists Market (Spending) (Million US$), 2018 – 2024
Figure 11‑13: Canada – India Outbound Holiday Tourists Market (Spending) (Million US$), 2010 – 2017
Figure 11‑14: Canada – Forecast for India Outbound Holiday Tourists Market (Spending) (Million US$), 2018 – 2024
Figure 11‑15: Canada – India Outbound VFR Tourists Market (Spending) (Million US$), 2010 – 2017
Figure 11‑16: Canada – Forecast for India Outbound VFR Tourists Market (Spending) (Million US$), 2018 – 2024
Figure 11‑17: Canada – India Outbound Business Tourists Market (Spending) (Million US$), 2010 – 2017
Figure 11‑18: Canada – Forecast for India Outbound Business Tourists Market (Spending) (Million US$), 2018 – 2024
Figure 11‑19: Canada – India Outbound Other Tourists Market (Spending) (Million US$), 2010 – 2017
Figure 11‑20: Canada – Forecast for India Outbound Other Tourists Market (Spending) (Million US$), 2018 – 2024
Figure 12‑1: Japan – India Outbound Tourists Numbers to Japan (Thousand), 2010 – 2017
Figure 12‑2: Japan – Forecast for India Outbound Tourists Numbers to Japan (Thousand), 2018 – 2024
Figure 12‑3: Japan – India Outbound Holiday Tourists Numbers to Japan (Thousand), 2010– 2017
Figure 12‑4: Japan – Forecast for India Outbound Holiday Tourists Numbers to Japan (Thousand), 2018– 2024
Figure 12‑5: Japan – China Outbound Business Tourists Numbers to Japan (Thousand), 2010 – 2017
Figure 12‑6: Japan – Forecast for India Outbound Business Tourists Numbers to Japan (Thousand), 2018– 2024
Figure 12‑7: Japan – India Outbound Other Tourists Numbers to Japan (Thousand), 2010 – 2017
Figure 12‑8: Japan – Forecast for India Outbound Other Tourists Numbers to Japan (Thousand), 2018 – 2024
Figure 12‑9: Japan – India Outbound Tourists Market (Spending) (Million US$), 2010 – 2017
Figure 12‑10: Japan – Forecast for India Outbound Tourists Market (Spending) (Million US$), 2018 – 2024
Figure 12‑11: Japan – India Outbound Holiday Tourists Market (Spending) (Million US$), 2010 – 2017
Figure 12‑12: Japan – Forecast for India Outbound Holiday Tourists Market (Spending) (Million US$), 2018 – 2024
Figure 12‑13: Japan – India Outbound Business Tourists Market (Spending) (Million US$), 2010 – 2017
Figure 12‑14: Japan – Forecast for India Outbound Business Tourists Market (Spending) (Million US$), 2018 – 2024
Figure 12‑15: Japan – India Outbound Other Tourists Market (Spending) (Million US$), 2010 – 2017
Figure 12‑16: Japan – Forecast for India Outbound Other Tourists Market (Spending) (Million US$), 2018 – 2024
Figure 13‑1: South Korea – India Outbound Tourists Numbers to South Korea (Thousand), 2010 – 2017
Figure 13‑2: South Korea – Forecast for India Outbound Tourists Numbers to South Korea (Thousand), 2018 – 2024
Figure 13‑3: South Korea – India Outbound Holiday Tourists Numbers to South Korea (Thousand), 2010 – 2017
Figure 13‑4: South Korea – Forecast for India Outbound Holiday Tourists Numbers to South Korea (Thousand), 2018 – 2024
Figure 13‑5: South Korea – India Outbound Business Tourists Numbers to South Korea (Thousand), 2010 – 2017
Figure 13‑6: South Korea – Forecast for India Outbound Business Tourists Numbers to South Korea (Thousand), 2018 – 2024
Figure 13‑7: South Korea – India Outbound Other Tourists Numbers to South Korea (Thousand), 2010 – 2017
Figure 13‑8: South Korea – Forecast for India Outbound Other Tourists Numbers to South Korea (Thousand), 2018 – 2024
Figure 13‑9: South Korea – India Outbound Tourists Market (Spending) (Million US$), 2010 – 2017
Figure 13‑10: South Korea – Forecast for India Outbound Tourists Market (Spending) (Million US$), 2018 – 2024
Figure 13‑11: South Korea – India Outbound Holiday Tourists Market (Spending) (Million US$), 2010 – 2017
Figure 13‑12: South Korea – Forecast for India Outbound Holiday Tourists Market (Spending) (Million US$), 2018 – 2024
Figure 13‑13: South Korea – India Outbound Business Tourists Market (Spending) (Million US$), 2010 – 2017
Figure 13‑14: South Korea – Forecast for India Outbound Business Tourists Market (Spending) (Million US$), 2018 – 2024
Figure 13‑15: South Korea – India Outbound Other Tourists Market (Spending) (Million US$), 2010 – 2017
Figure 13‑16: South Korea – Forecast for India Outbound Other Tourists Market (Spending) (Million US$), 2018 – 2024
Figure 14‑1: China – India Outbound Tourists Numbers to China (Thousand), 2010 – 2017
Figure 14‑2: China – Forecast for India Outbound Tourists Numbers to China (Thousand), 2017 – 2022
Figure 14‑3: China – India Outbound Holiday Tourists Numbers to China (Thousand), 2010 – 2017
Figure 14‑4: China – Forecast for India Outbound Holiday Tourists Numbers to China (Thousand), 2018 – 2024
Figure 14‑5: China – India Outbound VFR Tourists Numbers to China (Thousand), 2010 – 2017
Figure 14‑6: China – Forecast for India Outbound VFR Tourists Numbers to China (Thousand), 2018 – 2024
Figure 14‑7: China – India Outbound Business Tourists Numbers to China (Thousand), 2010 – 2017
Figure 14‑8: China – Forecast for India Outbound Business Tourists Numbers to China (Thousand), 2018 – 2024
Figure 14‑9: China – India Outbound Other Tourists Numbers to China (Thousand), 2010 – 2017
Figure 14‑10: China – Forecast for India Outbound Other Tourists Numbers to China (Thousand), 2018 – 2024
Figure 14‑11: China – India Outbound Tourists Market (Spending) (Million US$), 2010 – 2017
Figure 14‑12: China – Forecast for India Outbound Tourists Market (Spending) (Million US$), 2018 – 2024
Figure 14‑13: China – India Outbound Holiday Tourists Market (Spending) (Million US$), 2010 – 2016
Figure 14‑14: China – Forecast for India Outbound Holiday Tourists Market (Spending) (Million US$), 2018 – 2024
Figure 14‑15: China – India Outbound VFR Tourists Market (Spending) (Million US$), 2010 – 2017
Figure 14‑16: China – Forecast for India Outbound VFR Tourists Market (Spending) (Million US$), 2018 – 2024
Figure 14‑17: China – India Outbound Business Tourists Market (Spending) (Million US$), 2010 – 2017
Figure 14‑18: China – Forecast for India Outbound Business Tourists Market (Spending) (Million US$), 2018 – 2024
Figure 14‑19: China – India Outbound Other Tourists Market (Spending) (Million US$), 2010 – 2017
Figure 14‑20: China – Forecast for India Outbound Other Tourists Market (Spending) (Million US$), 2018 – 2024
Figure 15‑1: Singapore – India Outbound Tourists Numbers to Singapore (Thousand), 2010 – 2017
Figure 15‑2: Singapore – Forecast for India Outbound Tourists Visit to Singapore (Thousand), 2018 – 2024
Figure 15‑3: Singapore – India Outbound Holiday Tourists Numbers to Singapore (Thousand), 2010 – 2017
Figure 15‑4: Singapore – Forecast for India Outbound Holiday Tourists Numbers to Singapore (Thousand), 2018 – 2024
Figure 15‑5: Singapore – India Outbound VFR Tourists Numbers to Singapore (Thousand), 2010 – 2017
Figure 15‑6: Singapore – Forecast for India Outbound VFR Tourists Numbers to Singapore (Thousand), 2018 – 2024
Figure 15‑7: Singapore – India Outbound Business Tourists Numbers to Singapore (Thousand), 2010 – 2018
Figure 15‑8: Singapore – Forecast for India Outbound Business Tourists Numbers to Singapore (Thousand), 2018 – 2024
Figure 15‑9: Singapore – India Outbound Other Tourists Numbers to Singapore (Thousand), 2010 – 2017
Figure 15‑10: Singapore – Forecast for India Outbound Other Tourists Numbers to Singapore (Thousand), 2018 – 2024
Figure 15‑11: Singapore – India Outbound Tourists Market (Spending) (Million US$), 2010 – 2017
Figure 15‑12: Singapore – Forecast for India Outbound Tourists Market (Spending) (Million US$), 2018– 2024
Figure 15‑13: Singapore – India Outbound Holiday Tourists Market (Spending) (Million US$), 2010 – 2017
Figure 15‑14: Singapore – Forecast for India Outbound Holiday Tourists Market (Spending) (Million US$), 2018 – 2024
Figure 15‑15: Singapore – India Outbound VFR Tourists Market (Spending) (Million US$), 2010 – 2017
Figure 15‑16: Singapore – Forecast for India Outbound VFR Tourists Market (Spending) (Million US$), 2018 – 2024
Figure 15‑17: Singapore – India Outbound Business Tourists Market (Spending) (Million US$), 2010 – 2017
Figure 15‑18: Singapore – Forecast for India Outbound Business Tourists Market (Spending) (Million US$), 2018 – 2024
Figure 15‑19: Singapore – India Outbound Other Tourists Market (Spending) (Million US$), 2010 – 2017
Figure 15‑20: Singapore – Forecast for India Outbound Other Tourists Market (Spending) (Million US$), 2018 – 2024
Figure 16‑1: Thailand – India Outbound Tourists Numbers to Thailand (Thousand), 2011 – 2017
Figure 16‑2: Thailand – Forecast for India Outbound Tourists Numbers to Thailand (Thousand), 2018 – 2024
Figure 16‑3: Thailand – India Outbound Holiday Tourists Numbers to Thailand (Thousand), 2012 – 2017
Figure 16‑4: Thailand – Forecast for India Outbound Holiday Tourists Numbers to Thailand (Thousand), 2018 – 2024
Figure 16‑5: Thailand – India Outbound Business Tourists Numbers to Thailand (Thousand), 2012 – 2017
Figure 16‑6: Thailand – Forecast for India Outbound Business Tourists Numbers to Thailand (Thousand), 2018 – 2024
Figure 16‑7: Thailand – China Outbound Other Tourists Numbers to Thailand (Thousand), 2012 – 2017
Figure 16‑8: Thailand – Forecast for India Outbound Other Tourists Numbers to Thailand (Thousand), 2018 – 2024
Figure 16‑9: Thailand – India Outbound Tourists Market (Spending) (Million US$), 2012 – 2017
Figure 16‑10: Thailand – Forecast for India Outbound Tourists Market (Spending) (Million US$), 2018 – 2024
Figure 16‑11: Thailand – India Outbound Holiday Tourists Market (Spending) (Million US$), 2012– 2017
Figure 16‑12: Thailand – Forecast India Outbound Holiday Tourists Market (Spending) (Million US$), 2018 – 2024
Figure 16‑13: Thailand – India Outbound Business Tourists Market (Spending) (Million US$), 2012 – 2017
Figure 16‑14: Thailand – Forecast India Outbound Business Tourists Market (Spending) (Million US$), 2018 – 2024
Figure 16‑15: Thailand – India Outbound Other Tourists Market (Spending) (Million US$), 2012 – 2017
Figure 16‑16: Thailand – Forecast India Outbound Other Tourists Market (Spending) (Million US$), 2018 – 2024
Figure 17‑1: United States – India Outbound Tourists Numbers to United States (Thousand), 2011 – 2017
Figure 17‑2: United States – Forecast for India Outbound Tourists Numbers to United States (Thousand), 2018 – 2024
Figure 17‑3: United States – India Outbound Holiday Tourists Numbers to United States (Thousand), 2011 – 2017
Figure 17‑4: United States – Forecast for India Outbound Holiday Tourists Numbers to United States (Thousand), 2018 – 2024
Figure 17‑5: United States – India Outbound VFR Tourists Numbers to United States (Thousand), 2011 – 2017
Figure 17‑6: United States – Forecast for India Outbound VFR Tourists Numbers to United States (Thousand), 2018 – 2024
Figure 17‑7: United States – India Outbound Business Tourists Numbers to United States (Thousand), 2011 – 2017
Figure 17‑8: United States – Forecast for India Outbound Business Tourists Numbers to United States (Thousand), 2018 – 2024
Figure 17‑9: United States – India Outbound Other Tourists Numbers to United States (Thousand), 2011 – 2017
Figure 17‑10: United States – Forecast for India Outbound Other Tourists Numbers to United States (Thousand), 2018 – 2024
Figure 17‑11: United States – India Outbound Tourists Market (Spending) (Million US$), 2011 – 2017
Figure 17‑12: United States – Forecast for India Outbound Tourists Market (Spending) (Million US$), 2018 – 2024
Figure 17‑13: United States – India Outbound Holiday Tourists Market (Spending) (Million US$), 2011 – 2017
Figure 17‑14: United States – Forecast for India Outbound Holiday Tourists Market (Spending) (Million US$), 2018 – 2024
Figure 17‑15: United States – India Outbound VFR Tourists Market (Spending) (Million US$), 2011 – 2017
Figure 17‑16: United States – Forecast for India Outbound VFR Tourists Market (Spending) (Million US$), 2018 – 2024
Figure 17‑17: United States – India Outbound Business Tourists Market (Spending) (Million US$), 2011 – 2017
Figure 17‑18: United States – Forecast for India Outbound Business Tourists Market (Spending) (Million US$), 2018 – 2024
Figure 17‑19: United States – India Outbound Other Tourists Market (Spending) (Million US$), 2011 – 2017
Figure 17‑20: United States – Forecast for India Outbound Other Tourists Market (Spending) (Million US$), 2018 – 2024
Figure 18‑1: Hong Kong – India Outbound Tourists Numbers to Hong Kong (Thousand), 2011 – 2017
Figure 18‑2: Hong Kong – Forecast for India Outbound Tourists Numbers to Hong Kong (Thousand), 2018 – 2024
Figure 18‑3: Hong Kong – India Outbound Holiday Tourists Numbers to Hong Kong (Thousand), 2011 – 2017
Figure 18‑4: Hong Kong – Forecast for India Outbound Holiday Tourists Numbers to Hong Kong (Thousand), 2018 – 2024
Figure 18‑5: Hong Kong – India Outbound VFR Tourists Numbers to Hong Kong (Thousand), 2011 – 2017
Figure 18‑6: Hong Kong – Forecast for India Outbound VFR Tourists Numbers to Hong Kong (Thousand), 2018 – 2024
Figure 18‑7: Hong Kong – India Outbound Business Tourists Numbers to Hong Kong (Thousand), 2011 – 2017
Figure 18‑8: Hong Kong – Forecast for India Outbound Business Tourists Numbers to Hong Kong (Thousand), 2018 – 2024
Figure 18‑9: Hong Kong – India Outbound En Route Tourists Numbers to Hong Kong (Thousand), 2011 – 2017
Figure 18‑10: Hong Kong – Forecast for India Outbound En Route Tourists Numbers to Hong Kong (Thousand), 2018 – 2024
Figure 18‑11: Hong Kong – India Outbound Other Tourists Numbers to Hong Kong (Thousand), 2011 – 2017
Figure 18‑12: Hong Kong – Forecast for India Outbound Other Tourists Numbers to Hong Kong (Thousand), 2018 – 2024
Figure 18‑13: Hong Kong – India Outbound Tourists Market (Spending) (Million US$), 2011 – 2017
Figure 18‑14: Hong Kong – Forecast India Outbound Tourists Market (Spending) (Million US$), 2018 – 2024
Figure 18‑15: Hong Kong – India Outbound Holiday Tourists Market (Spending) (Million US$), 2011 – 2017
Figure 18‑16: Hong Kong – Forecast for India Outbound Holiday Tourists Market (Spending) (Million US$), 2018 – 2024
Figure 18‑17: Hong Kong – India Outbound VFR Tourists Market (Spending) (Million US$), 2011 – 2017
Figure 18‑18: Hong Kong – Forecast for India Outbound VFR Tourists Market (Spending) (Million US$), 2018 – 2024
Figure 18‑19: Hong Kong – India Outbound Business Tourists Market (Spending) (Million US$), 2011 – 2017
Figure 18‑20: Hong Kong – Forecast for India Outbound Business Tourists Market (Spending) (Million US$), 2018 – 2024
Figure 18‑21: Hong Kong – India Outbound En Route Tourists Market (Spending) (Million US$), 2011 – 2017
Figure 18‑22: Hong Kong – Forecast for India Outbound En Route Tourists Market (Spending) (Million US$), 2018 – 2024
Figure 18‑23: Hong Kong – India Outbound Other Tourists Market (Spending) (Million US$), 2011 – 2017
Figure 18‑24: Hong Kong – Forecast for India Outbound Other Tourists Market (Spending) (Million US$), 2018 – 2024
Figure 19‑1: United Kingdom – India Outbound Tourists Numbers to United Kingdom (Thousand), 2010 – 2017
Figure 19‑2: United Kingdom – Forecast for India Outbound Tourists Numbers to United Kingdom (Thousand), 2018 – 2024
Figure 19‑3: United Kingdom – India Outbound Tourists Numbers to United Kingdom for Holiday (Thousand), 2010 – 2017
Figure 19‑4: United Kingdom – Forecast for India Outbound Tourists Numbers to United Kingdom for Holiday (Thousand), 2018 – 2024
Figure 19‑5: United Kingdom – India Outbound VFR Tourists Numbers to United Kingdom (Thousand), 2010 – 2017
Figure 19‑6: United Kingdom – Forecast for India Outbound VFR Tourists Numbers to United Kingdom (Thousand), 2018 – 2024
Figure 19‑7: United Kingdom – India Outbound Business Tourists Numbers to United Kingdom (Thousand), 2010 – 2017
Figure 19‑8: United Kingdom – Forecast for India Outbound Business Tourists Numbers to United Kingdom (Thousand), 2018 – 2024
Figure 19‑9: United Kingdom – India Outbound Others Tourists Numbers to United Kingdom (Thousand), 2010 – 2017
Figure 19‑10: United Kingdom – Forecast for India Outbound Others Tourists Numbers to United Kingdom (Thousand), 2018 – 2024
Figure 19‑11: United Kingdom – India Outbound Tourists Market (Spending) (Million US$), 2010 – 2017
Figure 19‑12: United Kingdom – Forecast for India Outbound Tourists Market (Spending) (Million US$), 2018 – 2024
Figure 19‑13: United Kingdom – India Outbound Holiday Tourists Market (Spending) (Million US$), 2010 – 2017
Figure 19‑14: United Kingdom – Forecast for India Outbound Holiday Tourists Market (Spending) (Million US$), 2018 – 2024
Figure 19‑15: United Kingdom – India Outbound VFR Tourists Market (Spending) (Million US$), 2010 – 2017
Figure 19‑16: United Kingdom – Forecast for India Outbound VFR Tourists Market (Spending) (Million US$), 2018 – 2024
Figure 19‑17: United Kingdom – India Outbound Business Tourists Market (Spending) (Million US$), 2010 – 2016
Figure 19‑18: United Kingdom – Forecast for India Outbound Business Tourists Market (Spending) (Million US$), 2018 – 2024
Figure 19‑19: United Kingdom – India Outbound Other Tourists Market (Spending) (Million US$), 2010 – 2017
Figure 19‑20: United Kingdom – Forecast for India Outbound Other Tourists Market (Spending) (Million US$), 2018 – 2024
Figure 20‑1: South Africa – India Outbound Tourists Numbers to South Africa (Thousand), 2010 – 2017
Figure 20‑2: South Africa – Forecast for India Outbound Tourists Numbers to South Africa (Thousand), 2018 – 2024
Figure 20‑3: South Africa – India Outbound Holiday Tourists Numbers to South Africa (Thousand), 2010– 2017
Figure 20‑4: South Africa – Forecast for India Outbound Holiday Tourists Numbers to South Africa (Thousand), 2018– 2024
Figure 20‑5: South Africa – China Outbound Business Tourists Numbers to South Africa (Thousand), 2010 – 2017
Figure 20‑6: South Africa – Forecast for India Outbound Business Tourists Numbers to South Africa (Thousand), 2018– 2024
Figure 20‑7: South Africa – India Outbound Other Tourists Visit to South Africa (Thousand), 2010 – 2017
Figure 20‑8: South Africa – Forecast for India Outbound Other Tourists Visit to South Africa (Thousand), 2018 – 2024
Figure 20‑9: South Africa – India Outbound Tourists Market (Spending) (Million US$), 2010 – 2017
Figure 20‑10: South Africa – Forecast for India Outbound Tourists Market (Spending) (Million US$), 2018 – 2024
Figure 20‑11: South Africa – India Outbound Holiday Tourists Market (Spending) (Million US$), 2010 – 2017
Figure 20‑12: South Africa – Forecast for India Outbound Holiday Tourists Market (Spending) (Million US$), 2018 – 2024
Figure 20‑13: South Africa – India Outbound Business Tourists Market (Spending) (Million US$), 2010 – 2017
Figure 20‑14: South Africa – Forecast for India Outbound Business Tourists Market (Spending) (Million US$), 2018 – 2024
Figure 20‑15: South Africa – India Outbound Other Tourists Market (Spending) (Million US$), 2010 – 2017
Figure 20‑16: South Africa – Forecast for India Outbound Other Tourists Market (Spending) (Million US$), 2018 – 2024
List of Tables:
Table 3‑1: India Outbound Tourists Share (Percent), 2012 – 2017
Table 3‑2: Forecast for India Outbound Tourists Share (Percent), 2018 – 2024
Table 5‑1: India Outbound Tourists Market (Spending) Share (Percent %), 2012– 2017
Table 5‑2: Forecast for India Outbound Tourists Market (Spending) Share (Percent %), 2018 – 2024
Table 6‑1: India Outbound Holiday Tourists Share (Percent %), 2012 – 2017
Table 6‑2: Forecast for India Outbound Holiday Tourists Share (Percent %), 2018 – 2024
Table 6‑3: India Outbound VFR Tourists Share (Percent %), 2012 – 2017
Table 6‑4: Forecast for India Outbound VFR Tourists Share (Percent %), 2018 – 2024
Table 6‑5: India Outbound Business Tourists Share (Percent %), 2012– 2017
Table 6‑6: Forecast for India Outbound Business Tourists Share (Percent %), 2018 – 2024
Table 6‑7: India Outbound Other Tourist Share (Percent %), 2012 – 2017
Table 6‑8: Forecast for India Outbound Other Tourists Share (Percent %), 2018 – 2024
Table 7‑1: India Outbound Holiday Tourists Market (Spending) Share (Percent %), 2012 – 2017
Table 7‑2: Forecast for India Outbound Holiday Tourists Market (Spending) Share (Percent %), 2018 – 2024
Table 7‑3: India Outbound VFR Tourists Market (Spending) Share (Percent %), 2012 – 2017
Table 7‑4: Forecast for India Outbound VFR Tourists Market (Spending) Share (Percent %), 2018 – 2024
Table 7‑5: India Outbound Business Tourists Market (Spending) Share (Percent %), 2012 – 2017
Table 7‑6: Forecast for India Outbound Business Tourists Market (Spending) Share (Percent %), 2018 – 2024
Table 7‑7: India Outbound Other Tourists Market (Spending) Share (Percent %), 2012 – 2017
Table 7‑8: Forecast for India Outbound Other Tourists Market (Spending) Share (Percent %), 2018 – 2024
Reach out to us
Call us on
USA: +1-678-302-0700
INDIA: +91-120-421-9822
Drop us an email at
info@renub.com