
")
Global Crab Market and Volume by Type, Export, Import, Production, Countries, Value Chain Analysis & Forecast
Get Free Customization in This Report
The crab price is very volatile in the global supply chain, but due to rising consumer demand the future of crab industry is bright. The foodservice industry is the major end-user of crabs; the rise of the foodservice industry would directly surge the inclination of the global crab market. In contrast to that, as per Renub research analysis, The Global Crab Market will reach 3.7 Million Metric Tonnes by the end of year 2026. Worldwide, the foodservice industry is multiplying because of the new technology and innovations as well as customizations in menus, apart from that, inclination towards healthy and nutritious foods and increasing demand for the gluten-free diet.

The major driving force of global crab market is rising per capita seafood consumption, rising incomes, increased urbanization to underpin seafood consumption is growing. Across the globe, the United States is one of the largest importers of crab; other importing countries are China, Canada, Thailand, and Indonesia. Moreover, China is the largest exporter of crab in the world.
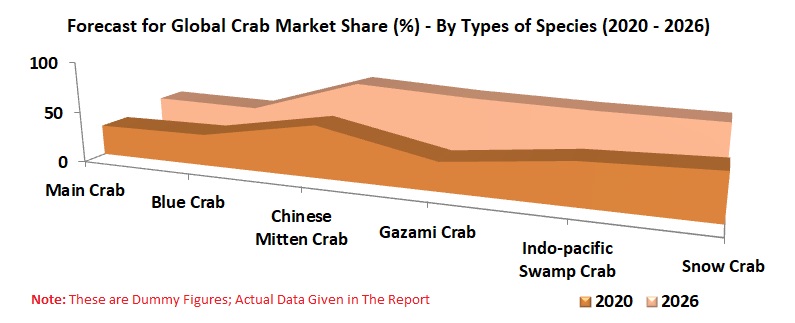
In this report, we have covered the types of crab species like Blue crab, Chinese Mitten, Gazami, Indo-pacific swamp crab, and Snow crab. In addition to this, Gazami production share will flourish in the global crab market during the forecast period.
Renub Research report titled “Global Crab Market and Volume by Type (Blue, Chinese Mitten, Gazami, Indo-Pacific Swamp & Snow), Export, Import, Production, Countries (China, Canada, Russian, Indonesia, United States, Japan, Mexico, Venezuela, Taiwan, South Korea, Vietnam, Indonesia, Philippines), Value Chain Analysis & Forecast” provides a complete study of global crab market.
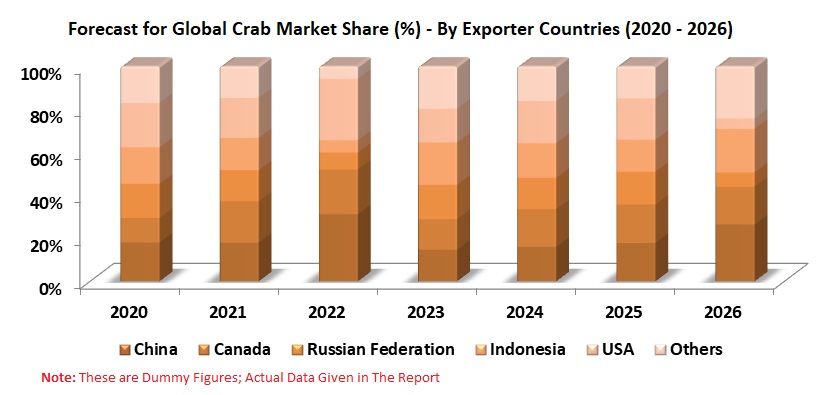
Largest Crab Exporter is China in Global Supply Chain
We have done a comprehensive assessment of the global export framework of the crab industry, portrayed the five top exporters of crab industry in the global supply chain. This report provides the critical historical market & volume of all five countries along with forecast till 2026. The covered countries are China, Canada, the Russian Federation, Indonesia, and the United States of America and Others.
The United States is the Largest Crab Importer in Global Supply Chain
We have assessed the import model of the crab industry, covered the top four importers of crab industry in the global supply chain. It provides historical, current, and forecast volume & market of all four countries. The covered countries are the United States, China, the Republic of Korea, and Japan and others.
By Regions & Species, China is on Top Position
This report provides complete analysis of production, region wise and species wise and also categorized the crab by their species: Indo-Pacific Swamp Crab (Giant mud crab, Scylla serrata), Gazami Crab, Blue Crab, Chinese Mitten Crab and Snow Crab.
Market Dynamic Insight
We have explained the major factor that will grow the market as well as factors that are associated with hurdles and key challenges. Besides, it explains the opportunities for crab industry along with supply chain and value chain proposition.
Blue Crab Producing Countries are:
• United States
• Mexico
• Venezuela
• Others
Chinese Mitten Crab Producing Countries are:
• China
• Taiwan
Gazami Crab Producing Countries are:
• China
• South Korea
• Japan
• Others
Indo-Pacific Swamp Crab Producing Countries are:
• China
• Vietnam
• Indonesia
• Philippines
• Others
Snow Crab Producing Countries are:
• Canada
• United States
• Others
If the information you seek is not included in the current scope of the study kindly share your specific requirements with our custom research team at info@renub.com
1. Introduction
2. Research & Methodology
3. Executive Summary
4. Global Crab Exports
4.1 Market
4.2 Volume
5. Global Crab Imports
5.1 Market
5.2 Volume
6. Global Crab Share Analysis
6.1 By Country – Crab Export Market Share
6.2 By Country – Crab Import Market Share
6.3 By Type – Crab Production Share
7. Main Crab Exporter Countries
7.1 China
7.1.1 Market
7.1.2 Volume
7.2 Canada
7.2.1 Market
7.2.2 Volume
7.3 Russian Federation
7.3.1 Market
7.3.2 Volume
7.4 Indonesia
7.4.1 Market
7.4.2 Volume
7.5 USA
7.5.1 Market
7.5.2 Volume
7.6 Others
7.6.1 Market
7.6.2 Volume
8. Main Crab Importer Countries
8.1 United States of America
8.1.1 Market
8.1.2 Volume
8.2 China
8.2.1 Market
8.2.2 Volume
8.3 Republic of Korea
8.3.1 Market
8.3.2 Volume
8.4 Japan
8.4.1 Market
8.4.2 Volume
8.5 Other countries
8.5.1 Market
8.5.2 Volume
9. Blue Crab Producing Countries
9.1 Global
9.2 By Regions
9.2.1 United States
9.2.2 Mexico
9.2.3 Venezuela
9.2.4 Others
10. Chinese Mitten Crab Producing Countries
10.1 Global
10.2 By Regions
10.2.1 China
10.2.2 Taiwan
11. Gazami Crab Producing Countries
11.1 Global
11.2 By Regions
11.2.1 China
11.2.2 South Korea
11.2.3 Japan
12. Indo-pacific Swamp Crab Producing Countries
12.1 Global
12.2 By Regions
12.2.1 China
12.2.2 Vietnam
12.2.3 Indonesia
12.2.4 Philippines
12.2.5 Others
13. Snow Crab Producing Countries
13.1 Global
13.2 By Regions
13.2.1 Canada
13.2.2 United States
13.2.3 Others
14. Growth Drivers
15. Challenges
16. Supply Chain of Sea Food Industry
List of Figures:
Figure-01: United States is the Largest Crab Importer whereas China is the Largest Crab Exporter in the World ( 2020 – 2026)
Figure-02: China and Vietnam are most the Largest Indo – Pacific Swamp Crab producing Countries ( 2020 – 2026)
Figure-03: Global – Crab Exporters Market (Million US$), 2014 – 2019
Figure-04: Global – Forecast for Crab Exporters Market (Million US$), 2020 – 2026
Figure-05: Global - Crab Exporters Volume (In 1,000 Tons), 2014 – 2019
Figure-06: Global – Forecast for Crab Exporters Volume (In 1,000 tons), 2020 – 2026
Figure-07: Global Crab Importer Market (Million US$), 2014 – 2019
Figure-08: Global Forecast for Crab Importer Market (Million US$), 2020 – 2026
Figure-09: Global Crab Importer Volume (In 1,000 tons) 2014 – 2019
Figure-10: Global Forecast for Crab Importer Volume (In 1,000 tons), 2020 – 2026
Figure-11: Global – Crab Export Market Share by Countries (Percent ), 2014 – 2019
Figure-12: Global – Forecast for Crab Export Market Share by Countries (Percent ), 2020 – 2026
Figure-13: Global – Crab Import Market Share by Countries (Percent ), 2014 – 2019
Figure-14: Global – Forecast for Crab Import Market Share by Countries (Percent ), 2020 – 2026
Figure-15: Global – Crab Production Share by Types (Percent ), 2014 – 2019
Figure-16: Global – Forecast for Crab Production Share by Types (Percent ), 2020 – 2026
Figure-17: China – Crab Exporters Market (Million US$), 2014 – 2019
Figure-18: China – Forecast for Crab Exporters Market (Million US$), 2020 – 2026
Figure-19: China – Crab Exporters Volume (In 1,000 tons), 2014 – 2019
Figure-20: China – Forecast for Crab Exporters Volume (Million US$), 2020 – 2026
Figure-21: Canada - Crab Exporters Market (Million US$), 2014 – 2019
Figure-22: Canada - Forecast for Crab Exporters Market (Million US$), 2020 – 2026
Figure-23: Canada - Crab Exporters Volume (In 1,000 tons), 2014 – 2019
Figure-24: Canada - Forecast for Crab Exporters Volume (in 1000 tons ), 2020 – 2026
Figure-25: Russian Federation - Crab Exporters Market (Million US$), 2014 – 2019
Figure-26: Russian Federation - Forecast for Crab Exporters Market (Million US$), 2020 – 2026
Figure-27: Russian Federation - Crab Exporters Volume (In 1,000 tons), 2014 – 2019
Figure-28: Russian Federation - Forecast for Crab Exporters Volume (Million US$), 2020 – 2026
Figure-29: Indonesia - Crab Exporters Market (Million US$), 2014 – 2019
Figure-30: Indonesia - Forecast for Crab Exporters Market (Million US$), 2020 – 2026
Figure-31: Indonesia - Crab Exporters Volume (In 1,000 Tons) 2014 – 2019
Figure-32: Indonesia - Forecast for Crab Exporters Volume (Million US$), 2020 – 2026
Figure-33: USA - Crab Exporters Market (Million US$), 2014 – 2019
Figure-34: USA - Forecast for Crab Exporters Market (Million US$), 2020 – 2026
Figure-35: USA - Crab Exporters Volume (In 1,000 Tons), 2014 – 2019
Figure-36: USA - Forecast for Crab Exporters Volume (In 1,000 Tons), 2020 – 2026
Figure-37: Other Countries - Crab Exporters Market (Million US$), 2014 – 2019
Figure-38: Other Countries - Forecast for Crab Exporters Market (Million US$), 2020 – 2026
Figure-39: Other Countries - Crab Exporters Volume (In 1,000 tons) 2014 – 2019
Figure-40: Other Countries - Forecast for Crab Exporters Volume (Million US$), 2020 – 2026
Figure-41: United States of America - Crab Import Market (Million US$), 2014 – 2019
Figure-42: United States of America - Forecast for Crab Importer Market (Million US$), 2020 – 2026
Figure-43: United States of America - Crab Importer Volume (In 1,000 tons) 2014 – 2019
Figure-44: United States of America - Forecast for Crab Importer Volume (In 1,000 tons), 2020 – 2026
Figure-45: China - Crab Importer Market (Million US$), 2014 – 2019
Figure-46: China - Forecast for Crab Importer Market (Million US$), 2020 – 2026
Figure-47: China - Crab Importer Volume (In 1,000 tons) 2014 – 2019
Figure-48: China - Forecast for Crab Importer Volume (In 1,000 tons), 2020 – 2026
Figure-49: Republic of Korea - Crab Importer Market (Million US$), 2014 – 2019
Figure-50: Republic of Korea - Forecast for Crab Importer Market (Million US$), 2020 – 2026
Figure-51: Republic of Korea - Crab Importer Volume (In 1,000 tons), 2014 – 2019
Figure-52: Republic of Korea - Forecast for Crab Importer Volume (In 1,000 tons), 2020 – 2026
Figure-53: Japan - Crab Importer Market (Million US$), 2014 – 2019
Figure-54: Japan - Forecast for Crab Importer Market (Million US$), 2020 – 2026
Figure-55: Japan – Crab Import Volume (In 1,000 tons), 2014 – 2019
Figure-56: Japan - Forecast for Crab Importer Volume (In 1,000 tons), 2018 – 2026
Figure-57: Other Countries - Crab Importer Market (Million US$), 2014 – 2019
Figure-58: Other Countries - Forecast for Crab Importer Market (Million US$), 2020 – 2026
Figure-59: Other Countries - Crab Importer Volume (In 1,000 Tons), 2014 – 2019
Figure-60: Other Countries - Forecast for Crab Importer Volume (In 1,000 tons), 2020 – 2026
Figure-61: Global - Blue Crab Production Volume (In 1,000 tons), 2014 – 2019
Figure-62: Global - Forecast for Blue Crab Production Volume (In 1,000 tons), 2020 – 2026
Figure-63: United States - Blue Crab Production Volume (In 1,000 tons), 2014 – 2019
Figure-64: United States - Forecast for Blue Crab Production Volume (In 1,000 tons), 2020 – 2026
Figure-65: Mexico - Blue Crab Production Volume (In 1,000 tons) 2014 – 2019
Figure-66: Mexico - Forecast for Blue Crab Production Volume (In 1,000 tons) 2020 – 2026
Figure-67: Venezuela - Blue Crab Production Volume (In 1,000 tons), 2014 – 2019
Figure-68: Venezuela - Forecast for Blue Crab Production Volume (In 1,000 tons), 2020 – 2026
Figure-69: Others - Blue Crab Production Volume (In 1,000 tons), 2014 – 2019
Figure-70: Others - Forecast for Blue Crab Production Volume (In 1,000 tons), 2020 – 2026
Figure-71: Global - Chinese Mitten Crab Production Volume (In 1,000 tons), 2014 – 2019
Figure-72: Global - Forecast for Chinese Mitten Crab Production Volume (In 1,000 tons), 2020 – 2026
Figure-73: China - Chinese Mitten Crab Production Volume (In 1,000 tons) 2014 – 2019
Figure-74: China - Forecast for Chinese Mitten Crab Production Volume (In 1,000 tons) 2020 – 2026
Figure-75: Taiwan - Chinese Mitten Crab Production Volume (In 1,000 tons) 2014 – 2019
Figure-76: Taiwan - Forecast for Chinese Mitten Crab Production Volume (In 1,000 tons) 2020 – 2026
Figure-77: Global - Gazami Crab Production Volume (In 1,000 tons), 2014 – 2019
Figure-78: Global - Forecast for Gazami Crab Production Volume (In 1,000 tons), 2020 – 2026
Figure-79: China - Gazami Crab Production Volume (In 1,000 tons), 2014 – 2019
Figure-80: China - Forecast for Gazami Crab Production Volume (In 1,000 tons), 2020 – 2026
Figure-81: South Korea - Gazami Crab Production Volume (In 1,000 tons), 2014 – 2019
Figure-82: South Korea - Forecast for Gazami Crab Production Volume (In 1,000 tons) 2020 – 2026
Figure-83: Japan - Gazami Crab Production Volume (In 1,000 tons), 2014 – 2019
Figure-84: Japan - Forecast for Gazami Crab Production Volume (In 1,000 tons), 2020 – 2026
Figure-85: Global - Indo-pacific Swamp Crab Production Volume (In 1,000 tons), 2014 – 2019
Figure-86: Global - Forecast for Indo-pacific Swamp Crab Production Volume (In 1,000 tons), 2020 – 2026
Figure-87: China - Indo-pacific Swamp Crab Production Volume (In 1,000 tons), 2014 – 2019
Figure-88: China - Forecast for Indo-pacific Swamp Crab Production Volume (In 1,000 tons), 2020 – 2026
Figure-89: Vietnam - Indo-pacific Swamp Crab Production Volume (In 1,000 tons), 2014 – 2019
Figure-90: Vietnam - Forecast for Indo-pacific Swamp Crab Production Volume (In 1,000 tons), 2020 – 2026
Figure-91: Indonesia - Indo-pacific Swamp Crab Production Volume (In 1,000 tons), 2014 – 2019
Figure-92: Indonesia - Forecast for Indo-pacific Swamp Crab Production Volume (In 1,000 tons), 2020 – 2026
Figure-93: Philippines - Indo-pacific Swamp Crab Production Volume (In 1,000 tons), 2014 – 2019
Figure-94: Philippines - Forecast for Indo-pacific Swamp Crab Production Volume (In 1,000 tons), 2020 – 2026
Figure-95: Others - Indo-pacific Swamp Crab Production Volume (In 1,000 tons), 2014 – 2019
Figure-96: Others - Forecast for Indo-pacific Swamp Crab Production Volume (In 1,000 tons), 2020 – 2026
Figure-97: Global - Snow Crab Production Volume (In 1,000 tons), 2014 – 2019
Figure-98: Global - Forecast for Snow Crab Production Volume (In 1,000 tons), 2020 – 2026
Figure-99: Canada - Snow Crab Production Volume (In 1,000 tons), 2014 – 2019
Figure-100: Canada - Forecast for Snow Crab Production Volume (In 1,000 tons), 2020 – 2026
Figure-101: United States - Snow Crab Production Volume (In 1,000 tons), 2014 – 2019
Figure-102: United States - Forecast for Snow Crab Production Volume (In 1,000 tons), 2020 – 2026
Figure-103: Others - Snow Crab Production Volume (In 1,000 tons), 2014 – 2019
Figure-104: Others - Forecast for Snow Crab Production Volume (In 1,000 tons), 2020 – 2026
Figure-105: Global – Per Capita Seafood Consumption by Countries ( KG), 2000 – 2013
Reach out to us
Call us on
USA: +1-678-302-0700
INDIA: +91-120-421-9822
Drop us an email at
info@renub.com