
")
Dental Equipments Market Global Forecast by Products, Regions (Europe, North America, Asia-Pacific & Rest of the World), End User, Companies
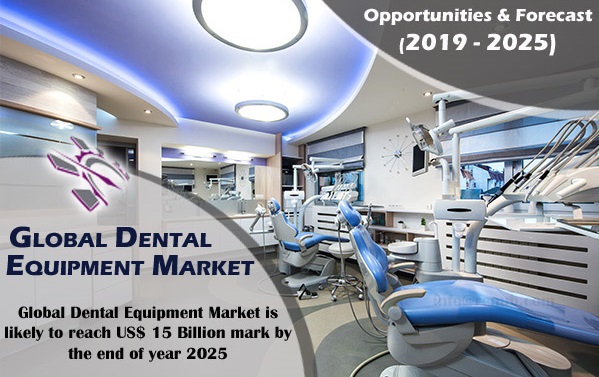
Dental Equipments Market Outlook
Dental equipment includes all the small and big tools that help in diagnostic and treatment of various oral diseases like dental infection. Some of the important reasons for the growth of the dental treatment market are as follows; rapid growth of ageing population, increasing demand of cosmetic dentistry across the world, rising disposable income, growing healthcare infrastructure, rising awareness regarding oral hygiene, increasing incidence rate of dental disorders etc. Besides, due to medical tourism, the dental equipment market is growing very fast and expected to grow in future too. Global Dental Equipment Market is likely to reach US$ 15 Billion mark by the end of year 2025.
In recent time, many governments in the world have made very good initiative for dental reforms. For an example, the Australian Government allocated US$ 1.2 Billion in the 2016 - 2017 Budget for the Single National Child and Adult Public Dental Scheme as a reform. Many countries are providing dental services in the form of medical tourism today. Hungary has become a famous destination of Europe for dental tourism, where about 7000 people visit for dental service. The demand for restorative and surgical dental services is increasing rapidly due to the increase in aged population in the world, due to which the market for dental equipment is growing rapidly.
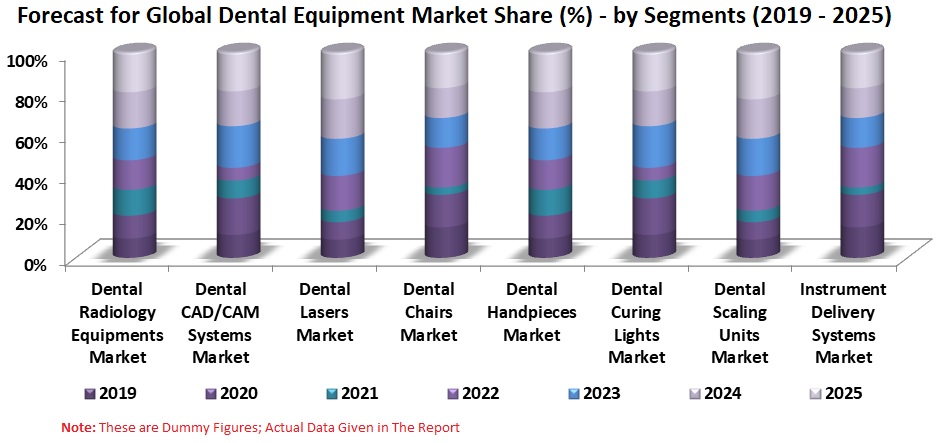
Segment Insight; Dental Radiology is one of the Most Significant Segment in Global Dental Diagnostic Market
In the coming few years, dental radiology equipment will play an important role in the global development market. Comprehensive analysis of all segments has been done in this report, which includes Growth Factor Challenge opportunities; Dental Lasers, Dental Chairs, CAD/CAM system, Dental Handpieces, Dental Curing Lights, Dental Scaling units and Instruments Delivery system.
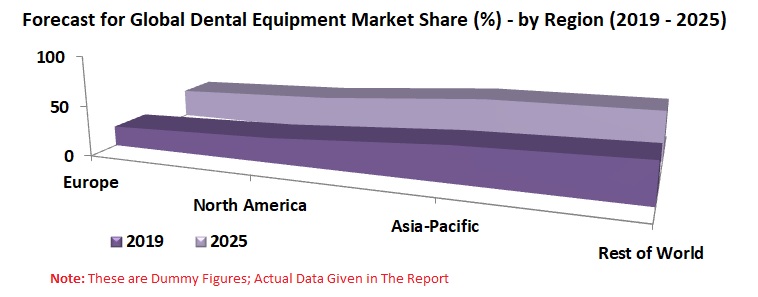
Regional Insight; North America is a Major Market
The Oral hygiene, Health Care Infrastructure, and Government Policy is the reason why North America is a large market, in global dental equipment market. Asia Pacific is going to be the fastest growing market in the coming time. Its main region is awareness towards dental hygiene, growing disposable income and large population base. In this report every regional factor has been well analyzed, which is also a contributor to the global dental recruitment market.
Key Companies Covered in the Report:
In this report, a large dental equipment manufacturer has been included and all the information related to it has been given such as Overview, Sales analysis, its expansion plan, and its products etc.
• Danaher Corporation
• Henry Schein
• Dentsply Sirona
• Straumann
• Patterson
• Zimmer Holdings Inc.
• Biolase Inc.
• Planmeca OY
• Ivoclar Vivadent AG
Renub Research report titled “Dental Equipments Market Global Forecast by Products (Radiology Equipments, CAD/CAM System, Lasers, Chairs, Handpieces, Curing Lights, Scaling Units & Instrument Delivery Systems), Regions (Europe, North America, Asia-Pacific & Rest of the World), End User (Hospitals, Dental Clinics, Diagnostics Centre & Others) Companies (Danaher Corporation, Henry Schein, Dentsply Sirona, Straumann, Patterson, Zimmer Holdings Inc., Biolase Inc., Planmeca OY, Ivoclar Vivadent AG)” provides a complete analysis of Global Dental Equipments Market.
Dental Segments Covered in the Report:
• Dental Radiology Equipments Market
• Dental CAD/CAM Systems Market
• Dental Lasers Market
• Dental Chairs Market
• Dental Handpieces Market
• Dental Curing Lights Market
• Dental Scaling Units Market
• Instrument Delivery Systems Market
Regional Market Covered in the Report:
• Europe
• North America
• APAC
• Rest of World
If the information you seek is not included in the current scope of the study kindly share your specific requirements with our custom research team at info@renub.com
1. Executive Summary
2. Global Dental Diagnostics and Surgical Equipments Market
3. Market Share – Global Dental Diagnostics and Surgical Equipments
3.1 By Segments
3.2 By Region
4. Segment Analysis – Global Dental Diagnostics and Surgical Equipments Market
4.1 Dental Radiology Equipments Market
4.2 Dental CAD/CAM Systems Market
4.3 Dental Lasers Market
4.4 Dental Chairs Market
4.5 Dental Handpieces Market
4.6 Dental Curing Lights Market
4.7 Dental Scaling Units Market
4.8 Instrument Delivery Systems Market
5. By Region – Dental Diagnostics and Surgical Equipments Market
5.1 Europe
5.2 North America
5.3 Asia-Pacific
5.4 Rest of World
6. Global Key Players Analysis
6.1 Danaher Corporation
6.1.1 Initiative / Strategy
6.1.2 Product Development
6.1.3 Net Sales
6.2 Biolase, Inc.
6.2.1 Initiative / Strategy
6.2.2 Product Development
6.2.3 Net Sales
6.3 Straumann
6.3.1 Initiative / Strategy
6.3.2 Product Development
6.3.3 Net Sales
6.4 Henry Schein, Inc.
6.4.1 Initiative / Strategy
6.4.2 Product Development
6.4.3 Net Sales
6.5 Dentsply Sirona
6.5.1 Initiative / Strategy
6.5.2 Product Development
6.5.3 Net Sales
6.6 Planmeca Oy
6.6.1 Initiative / Strategy
6.6.2 Product Development
6.6.3 Net Sales
6.7 Zimmer Holdings Inc.
6.7.1 Initiative / Strategy
6.7.2 Development
6.7.3 Net Sales
6.8 Patterson Companies, Inc.
6.8.1 Initiative / Strategy
6.8.2 Development
6.8.3 Sales Analysis
6.9 Ivoclar Vivadent AG
6.9.1 Initiative / Strategy
6.9.2 Product Development
6.9.3 Net Sales
7. Growth Drivers
7.1 Growth in Per Capita Dental Expenditure
7.2 Aging Trend in Key Markets
7.3 Increasing Demand for Cosmetic Dentistry
7.4 Implementation of High-End Imaging and Radiology Devices in Dentistry
7.5 Annual Expenditure (Budget) on Dental Infrastructure & Services
7.6 Number of Dentists and Dental Technician Increases
7.6.1 Growing Trend in Number of Dentists in Hong Kong & United Kingdom
7.6.2 Age Distribution of United States Dentist Workforce, 2003 - 2033, Baseline Scenario
8. Key Challenges
8.1 Reducing Dental Reimbursement Rate in United States
8.2 Increasing Average Cost of Dental Implant in United States
List of Figures
Figure 2 1: Global Dental Diagnostics and Surgical Equipments Market (Billion US$), 2011 - 2016
Figure 2 2: Forecast for Global Dental Diagnostics and Surgical Equipments Market (Billion US$), 2017 - 2022
Figure 3 1: Global Dental Diagnostics and Surgical Equipments Market Share (%), 2011 - 2016
Figure 3 2: Forecast for Global Dental Diagnostics and Surgical Equipments Market Share (%), 2017 - 2022
Figure 3 3: By Region - Global Dental Diagnostics and Surgical Equipments Market Share (%), 2011 – 2016
Figure 3 4: By Region - Forecast for Global Dental Diagnostics and Surgical Equipments Market Share (%), 2017 - 2022
Figure 4 1: Dental Radiology Equipments Market (Million US$), 2011 - 2016
Figure 4 2: Forecast for Dental Radiology Equipments Market (Million US$), 2017 - 2022
Figure 4 3: Dental CAD/CAM Systems Market (Million US$), 2011 - 2016
Figure 4 4: Forecast for Dental CAD/CAM Systems Market (Million US$), 2017 - 2022
Figure 4 5: Dental Lasers Market (Million US$), 2011 - 2016
Figure 4 6: Forecast for Dental Lasers Market (Million US$), 2017 - 2022
Figure 4 7: Dental Chairs Market (Million US$), 2011 - 2016
Figure 4 8: Forecast for Dental Chairs Market (Million US$), 2017 - 2022
Figure 4 9: Dental Handpieces Market (Million US$), 2011 - 2016
Figure 4 10: Forecast for Dental Handpieces Market (Million US$), 2017 - 2022
Figure 4 11: Dental Curing Lights Market (Million US$), 2011 - 2016
Figure 4 12: Forecast for Dental Curing Lights Market (Million US$), 2017 - 2022
Figure 4 13: Dental Scaling Units Market (Million US$), 2011 - 2016
Figure 4 14: Forecast for Dental Scaling Units Market (Million US$), 2017 - 2022
Figure 4 15: Instrument Delivery Systems Market (Million US$), 2011 - 2016
Figure 4 16: Forecast for Instrument Delivery Systems Market (Million US$), 2017 - 2022
Figure 5 1: Europe - Dental Diagnostics and Surgical Equipments Market (Million US$), 2011 - 2016
Figure 5 2: Europe – Forecast for Dental Diagnostics and Surgical Equipments Market (Million US$), 2017 - 2022
Figure 5 3: North America - Dental Diagnostics and Surgical Equipments Market (Million US$), 2011 - 2016
Figure 5 4: North America – Forecast for Dental Diagnostics and Surgical Equipments Market (Million US$), 2017 - 2022
Figure 5 5: Asia-Pacific - Global Dental Diagnostics and Surgical Equipments Market (Million US$), 2011 - 2016
Figure 5 6: Asia- Pacific – Forecast for Global Dental Diagnostics and Surgical Equipments Market (Million US$), 2017 - 2022
Figure 5 7: Rest of World - Global Dental Diagnostics and Surgical Equipments Market (Million US$), 2011 - 2016
Figure 5 8: Rest of World – Forecast for Global Dental Diagnostics and Surgical Equipments Market (Million US$), 2017 – 2022
Figure 6 1: Danaher Corporation Dental Net Sales (Million US$), 2011 - 2016
Figure 6 2: Forecast for Danaher Corporation Dental Net Sales (Million US$), 2017 - 2022
Figure 6 3: Biolase, Inc. Net Sales (Million US$), 2011 - 2016
Figure 6 4: Forecast for Biolase, Inc. Net Sales (Million US$), 2017 - 2022
Figure 6 5: Straumann Net Sales (Million US$), 2011 - 2016
Figure 6 6: Forecast for Straumann Net Sales (Million US$), 2017 – 2022
Figure 6 7: Henry Schein, Inc. Dental Net Sales (Million US$), 2011 - 2016
Figure 6 8: Forecast for Henry Schein, Inc. Dental Net Sales (Million US$), 2017 - 2022
Figure 6 9: Dentsply Sirona Net Sales (Million US$), 2011 - 2016
Figure 6 10: Forecast for Dentsply Sirona Net Sales (Million US$), 2017 – 2022
Figure 6 11: Planmeca Oy Net Sales (Million US$), 2011 – 2016
Figure 6 12: Forecast for Planmeca Oy Net Sales (Million US$), 2017 - 2022
Figure 6 13: Zimmer Holdings Dental Net Sales (Million US$), 2011 - 2016
Figure 6 14: Forecast for Zimmer Holdings Dental Net Sales (Million US$), 2017 – 2022
Figure 6 15: Patterson Companies Dental Net Sales (Million US$), 2011 - 2016
Figure 6 16: Forecast for Patterson Companies Dental Net Sales (Million US$), 2017 – 2022
Figure 6 17: Ivoclar Vivadent Net Sales (Million US$), 2011 – 2016
Figure 6 18: Forecast for Ivoclar Vivadent Net Sales (Million US$), 2017 – 2022
Figure 7 1: Annual Expenditure on Dental Services in United Kingdom (Million US$), 2010-2016
Figure 7 2: Annual Expenditure on Dental Services in United States (Million US$), 2010-2015
Figure 7 3: Annual Expenditure on Dental Services in Canada (Million US$), 2010-2014
Figure 7 4: Number of Dentists in Hong Kong, 2011-2015
Figure 7 5: Number of Dentists in United Kingdom (Thousand), 2011-2016
Figure 8 1: Average Cost of Dental Implant in United States (US$), 2008-2015
List of Tables
Table 4 1: Common laser types used in dentistry
Table 4 2: Diagnostic Laser Applications in Dental Practice
Table 4 3: Diagnostic Laser Applications Used as Research Tools in Dentistry
Table 8 1: Per Capita Dental Expenditure (US$) by Country, 2008, 2013 &2018
Table 8 2: Percentage of Population Aged over 65 by Country, 2008-2018
Table 8 3: United States –Number of Dentists/100,000 Population, 2003-2033
Table 9 1: Medicaid Fee-for-Service Reimbursement as a Percentage of Commercial Dental Insurance Charges, Pediatric Dental Care Services, 2003 and 2013
Reach out to us
Call us on
USA: +1-678-302-0700
INDIA: +91-120-421-9822
Drop us an email at
info@renub.com