Renub

    United States Anaphylaxis Market, Size, Share, Forecast 2024-2030, Industry Trends, Growth, Insight, Top Companies Analysis

    Excel: 4 Hours
    PDF: 4 Hours
    Mar 2021
    Pages: 205

    United States Anaphylaxis Market Outlook

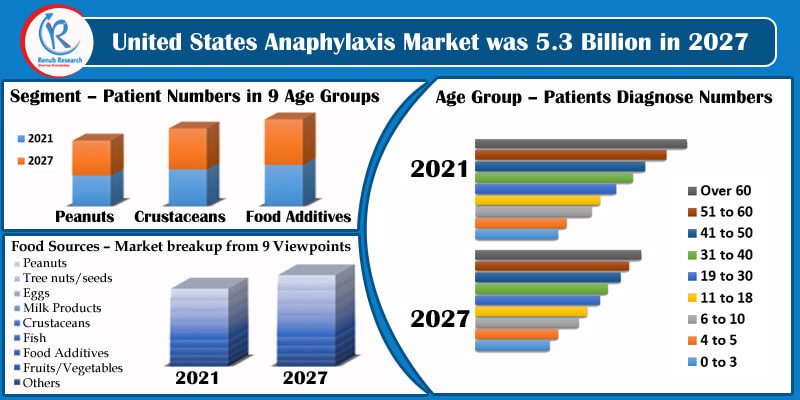
    Anaphylaxis is a severe and potentially fatal allergic reaction. It is a life-threatening reaction with respiratory, cardiovascular, cutaneous, or gastrointestinal manifestations. The bulk habitual anaphylactic reaction is caused by foods, insect stings, medications and latex. People with hypersensitive to things in their environment, their immune responses overreact to an antigen by discharging chemicals that cause allergy reaction. Anaphylaxis food reaction could be vital and cause death if the prior management not taken. According to Renub Research, United States Anaphylaxis Market was 5.3 Billion in 2027.


    united states anaphylaxis market


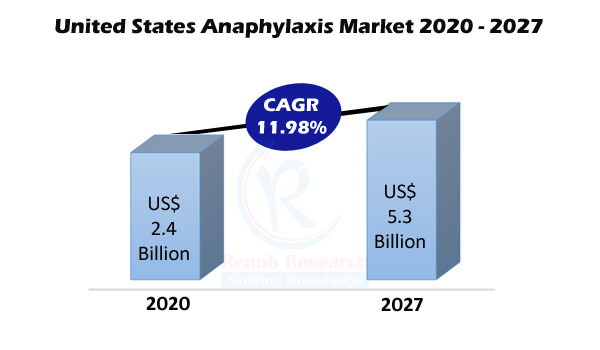
    As per the analysis, in the United States, due to anaphylaxis reaction to foods say Eggs, Milk Products, Crustaceans, Fish, Food Additives, Peanuts, Tree nuts/seeds, the death rate frequency increases with every passing year. However, this leads to an increment in the number of patients. Approximately 1,500 deaths in the United States happen every year due to anaphylaxis. From 2009 to 2016, the percentage of claims due to food allergy diagnoses was more vital than any other state’s medical claims. Besides, North Carolina State has the highest rate in 2016 compared to the low percent in 2009. The United States Anaphylaxis Market is expected to grow with a double-digit CAGR of 11.98% during 2020-2027.


    The food allergy with the highest average cost and service per patient in 2016 was due to milk products. The United States government authorities and bodies were regularly planning and giving awareness tips. Treatment of anaphylaxis is primarily related to Office or O.P. Services. Patients in the United States consider outpatient emergencies for primary diagnosis and symptoms management. In the United States, Anaphylactic Allergens are more in rural areas as compare to Urban.


    us anaphylaxis market


    The factors driving the United States Anaphylaxis Market are the surge in Allergic Reactions, International Trade & Commerce of Food Materials. However, there are few challenges like a Lack of Awareness & Food Control Infrastructure and Food Control Authorities for this market. As per this research study, United States Anaphylaxis Market was worth US$ 2.4 Billion in 2020.


    Deals in Companies

    • Mérieux Nutri Sciences expands capabilities in environmental analyses with C.P.G. Lab in Italy
    • Eurofins acquires L.A.B. Solution, thereby reinforcing its footprint in the Textile and Leather industries.
    • Food Label Regulations in the United States that all packaged foods regulated by F.D.A. under the FD&C Act that are labelled on or after 1 January 2006 must obey food allergen labelling requirements.


    This is a must purchase report to get the full picture of the United States Anaphylaxis Market. The report shows that the prevalence of anaphylaxis in the United States' general population is the least of the people; however, growing probably higher.


    Renub Research studied the “United States Anaphylaxis Market, Food Reaction Testing by Food Sources (Peanuts, Tree nuts/seeds, Eggs, Milk Products, Crustaceans, Fish, Food Additives, Fruits/Vegetables and Others specific foods) Treatment & Services (Immunology Services, Allergen Testing, Venipunctures, Office or O.P. Services New Patient, Ingestion Challenge Testing, Drugs Administered Other than Oral, Office or O.P. Services Established Patient, Therapeutic, Prophylactic, and Dx Injection/Infusions, Chemistry Tests, E.D. New or Estab Patients, Office or Other O.P. Consults, Pulmonary Diagnostic Testing and Therapies, Inpatient Visits, All Others) Anaphylaxis reaction to peanuts, crustaceans by Age group (0-3 years to Over 60 years), (Urban & Rural) End Users (Laboratory, Emergency Room, Inpatients, Outpatients, Office, Others)” provides current trends of the United States Anaphylaxis Industry. 


    Market & Patient Numbers of United States Anaphylaxis Food Reaction has been covered from two viewpoints:

    •    Testing Market
    •    Diagnose Patient Numbers


    united states anaphylaxis food reaction testing market


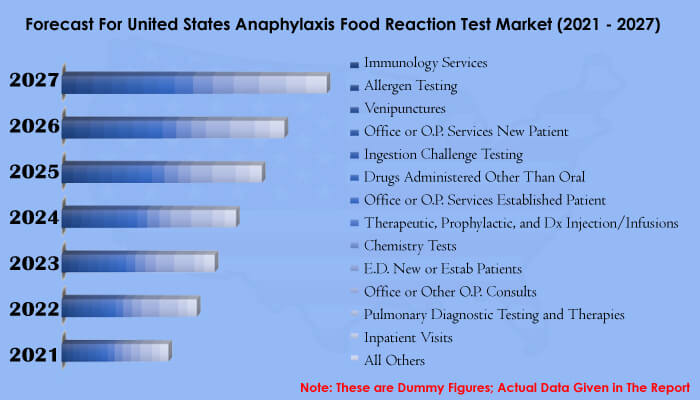
    Treatments & Services – Market breakup from 14 Viewpoints

    1.    Immunology Services
    2.    Allergen Testing
    3.    Venipunctures
    4.    Office or O.P. Services New Patient
    5.    Ingestion Challenge Testing
    6.    Drugs Administered Other Than Oral
    7.    Office or O.P. Services Established Patient
    8.    Therapeutic, Prophylactic, and Dx Injection/Infusions
    9.    Chemistry Tests
    10.    E.D. New or Estab Patients
    11.    Office or Other O.P. Consults
    12.    Pulmonary Diagnostic Testing and Therapies
    13.    Inpatient Visits
    14.    All Others


    Food Sources – Market breakup from 9 Viewpoints

    1.    Peanuts
    2.    Tree nuts/seeds
    3.    Eggs
    4.    Milk Products
    5.    Crustaceans
    6.    Fish
    7.    Food Additives
    8.    Fruits/Vegetables
    9.    Other Specific Foods


    Segment – Patient Numbers in 9 Age Groups

    1.    Peanuts
    2.    Crustaceans
    3.    Food Additives


    Age Group – Patients Diagnose Numbers

    1.    Age Groups 0 to 3
    2.    Age Groups 4 to 5
    3.    Age Groups 6 to 10
    4.    Age Groups 11 to 18
    5.    Age Groups 19 to 30
    6.    Age Groups 31 to 40
    7.    Age Groups 41 to 50
    8.    Age Groups 51 to 60
    9.    Over 60


    Rural & Urban – Market & Patient Numbers from 2 Viewpoints

    1.    Rural Market & Patient Numbers
    2.    Urban Market & Patient Numbers


    End Users – Market breakup from 6 Viewpoints

    1.    Laboratory
    2.    Emergency Room
    3.    Inpatient
    4.    Out Patient
    5.    Food Office
    6.    All Others

    1.    Introduction

    2.    Research & Methodology
    3.    Executive Summary

    4.    Food Label Regulations in the United States

    5.    Market Dynamics

    5.1    Growth Drivers
    5.2    Challenges


    6.    United States Anaphylaxis Market & Patient Numbers

    6.1    Market
    6.2    Diagnose Patient Volume


    7.    Market Share Analysis

    7.1    Rural Vs. Urban


    8.    Treatments & Services – United States Anaphylaxis Market

    8.1    Immunology Services
    8.2    Allergen Testing
    8.3    Venipunctures
    8.4    Office or O.P. Services New Patient
    8.5    Ingestion Challenge Testing
    8.6    Drugs Administered Other Than Oral
    8.7    Office or O.P. Services Established Patient
    8.8    Therapeutic,Prophylactic, and Dx Injection/Infusions
    8.9    Chemistry Tests
    8.10    E.D. New or Estab Patients
    8.11    Office or Other O.P. Consults
    8.12    Pulmonary Diagnostic Testing and Therapies
    8.13    Inpatient Visits
    8.14    Others


    9.    Food Sources – United States Anaphylaxis Market

    9.1    Peanuts
    9.2    Tree nuts/seeds
    9.3    Eggs
    9.4    Milk Products
    9.5    Crustaceans
    9.6    Fish
    9.7    Food Additives
    9.8    Fruits/Vegetables
    9.9    Other Specific Foods


    10.    Age Group Patient Numbers – United States Anaphylaxis

    10.1    Peanuts (9 Categories of Age Group)
    10.2    Crustaceans (9 Categories of Age Group)
    10.3    Food Additives (9 Categories of Age Group)


    11.    Rural & Urban – United States Anaphylaxis

    11.1    Rural

    11.1.1    Market
    11.1.2    Patient Numbers

    11.2    Urban Market

    11.2.1    Market
    11.2.2    Patient Numbers


    12.    End Users – United States Anaphylaxis Market

    12.1    Laboratory
    12.2    Emergency Room
    12.3    Inpatient
    12.4    Out Patient
    12.5    Food Office
    12.6    Others


    List Of Figures:

    Figure-01:        Percentage of children aged 0–17 years with a reported allergic condition in the past 12 months: United States, 1997–2011
    Figure-02:        United States – Anaphylactic Food Reaction Testing Market (Million US$), 2016 – 2020
    Figure-03:        United States – Forecast for Anaphylactic Food Reaction Testing Market (Million US$), 2021 – 2027
    Figure-04:        United States – Anaphylactic Food Reaction Diagnose (Number), 2016 – 2020
    Figure-05:        United States – Forecast for Anaphylactic Food Reaction Diagnose (Number), 2021 – 2027
    Figure-06:        United States – Anaphylactic Food Reaction Test Market Share by Urban & Rural (Percent), 2020
    Figure-07:        United States – Immunology Services (Million US$), 2016 – 2020
    Figure-08:        United States – Forecast for Immunology Services (Million US$), 2021 – 2027
    Figure-09:        United States – Allergen Testing (Million US$), 2016– 2020 
    Figure-10:        United States – Forecast for Allergen Testing (Million US$), 2021 – 2027
    Figure-11:        United States – Venipunctures Test (Million US$), 2016 – 2020
    Figure-12:        United States – Forecast for Venipunctures Test (Million US$), 2021 – 2027
    Figure-13:        United States – Office or O.P. Services New Patient (Million US$), 2016 – 2020
    Figure-14:        United States – Forecast for Office or O.P. Services New Patient (Million US$), 2020 – 2027 
    Figure-15:        United States – Ingestion Challenge Testing (Million US$), 2016 – 2020
    Figure-16:        United States – Forecast for Ingestion Challenge Testing (Million US$), 2021 – 2027
    Figure-17:        United States – Drugs Administered Other Than Oral (Million US$), 2016 – 2020
    Figure-18:        United States – Forecast for Drugs Administered Other Than Oral (Million US$), 2021 – 2027
    Figure-19:        United States – Office or O.P. Services Established Patient (Million US$), 2016 – 2020
    Figure-20:        United States – Forecast for Office or O.P. Services Established Patient (Million US$), 2021 – 2027
    Figure-21:        United States – Therapeutic, Prophylactic, and Dx Injection/Infusions (Million US$), 2016 – 2020
    Figure-22:        United States – Forecast for Therapeutic, Prophylactic, and Dx Injection/Infusions (Million US$), 2021 – 2027
    Figure-23:        United States – Chemistry Tests (Million US$), 2016 – 2020
    Figure-24:        United States – Forecast for Chemistry Tests (Million US$), 2021 – 2027
    Figure-25:        United States – E.D. New or Estab Patients (Million US$), 2016 – 2020
    Figure-26:        United States – Forecast for E.D. New or Estab Patients (Million US$), 2021 – 2027
    Figure-27:        United States – Office or Other O.P. Consults (Million US$), 2016 – 2020
    Figure-28:        United States – Forecast for Office or Other O.P. Consults (Million US$), 2021 – 2027
    Figure-29:        United States – Pulmonary Diagnostic Testing and Therapies (Million US$), 2016 – 2020
    Figure-30:        United States – Forecast for Pulmonary Diagnostic Testing and Therapies (Million US$), 2021 – 2027
    Figure-31:        United States – Inpatient Visits (Million US$), 2016 – 2020
    Figure-32:        United States – Forecast for Inpatient Visits (Million US$), 2021 – 2027
    Figure-33:        United States – All Others Test (Million US$), 2016 – 2020
    Figure-34:        United States – Forecast for All Others Test (Million US$), 2021 – 2027
    Figure-35:        United States – Pea Nuts Reaction Market (Million US$), 2016 – 2020
    Figure-36:        United States – Forecast for Pea Nuts Reaction Market (Million US$), 2021 – 2027
    Figure-37:        United States – Tree Nuts/Seeds Reaction Market (Million US$), 2016 – 2020
    Figure-38:        United States – Forecast for Tree nuts/seeds reaction Market (Million US$), 2021 – 2027
    Figure-39:        United States – Eggs reaction Market (Million US$), 2016 – 2020
    Figure-40:        United States – Forecast for Eggs reaction Market (Million US$), 2021 – 2027
    Figure-41:        United States – Milk Products Reaction Market (Million US$), 2016 – 2020
    Figure-42:        United States – Forecast for Milk Products Reaction Market (Million US$), 2021 – 2027
    Figure-43:        United States – Crustaceans Reaction Market (Million US$), 2016 – 2020
    Figure-44:        United States – Forecast for Crustaceans Reaction Market (Million US$), 2021 – 2027
    Figure-45:        United States – Fish Reaction Market (Million US$), 2016 – 2020
    Figure-46:        United States – Forecast for Fish Reaction Market (Million US$), 2021 – 2027
    Figure-47:        United States – Food Additives Reaction Market (Million US$), 2016 – 2020
    Figure-48:        United States – Forecast for Food Additives Reaction Market (Million US$), 2021 – 2027
    Figure-49:        United States – Fruits/Vegetables Reaction Market (Million US$), 2016 – 2020
    Figure-50:        United States – Forecast for Fruits/Vegetables Reaction Market (Million US$), 2021 – 2027
    Figure-51:        United States – Other Specific Foods Reaction Market (Million US$), 2016 – 2020
    Figure-52:        United States – Forecast for Other Specific Foods Reaction Market (Million US$), 2021 – 2027
    Figure-53:        United States – Anaphylactic Food reaction Rural Market (Million US$), 2016 – 2020
    Figure-54:        United States – Forecast for Anaphylactic Food reaction Rural Market (Million US$), 2021 - 2027
    Figure-55:        United States – Anaphylactic Food Reaction Urban Market (Million US$), 2016 - 2020
    Figure-56:        United States – Forecast for Anaphylactic Food Reaction Urban Market (Million US$), 2021 - 2027
    Figure-57:        United States – Anaphylactic Food Reaction Rural Patients (Number), 2016 – 2020
    Figure-58:        United States – Forecast for Anaphylactic Food Reaction Rural Patients (Number), 2021 – 2027
    Figure-59:        United States – Anaphylactic Food Reaction Urban Patients (Number), 2016 – 2020
    Figure-60:        United States – Forecast for Anaphylactic Food Reaction Urban Patients (Number), 2021 – 2027
    Figure-61:        United States – Anaphylactic Food Reaction Laboratory Market (Million US$), 2016 – 2020
    Figure-62:        United States – Forecast for Anaphylactic Food reaction Laboratory Market (Million US$), 2021 – 2027
    Figure-63:        United States – Anaphylactic Food Allergen Market by Emergency Room (Million US$), 2016 – 2020
    Figure-64:        United States – Forecast for Anaphylactic Food Allergen Market by Emergency Room (Million US$), 2021 – 2027
    Figure-65:        United States – Anaphylactic Food Allergen Market by Inpatient (Million US$), 2016 – 2020
    Figure-66:        United States – Forecast for Anaphylactic Food Allergen Market by Inpatient (Million US$), 2020 – 2027 
    Figure-67:        United States – Anaphylactic Food Allergen Market by Outpatient (Million US$), 2016 – 2020
    Figure-68:        United States – Forecast for Anaphylactic Food Allergen Market by Outpatient (Million US$), 2021 – 2027
    Figure-69:        United States – Anaphylactic Food Allergen Market by Office (Million US$), 2016 – 2020
    Figure-70:        United States – Forecast for Anaphylactic Food Allergen Market by Office (Million US$), 2021 – 2027
    Figure-71:        United States – Anaphylactic Food Allergen Market by All Others (Million US$), 2016 – 2020
    Figure-72:        United States – Forecast for Anaphylactic Food Allergen Market by All Others (Million US$), 2021 – 2027


    List Of Tables:

    Table-01:        Top 10 Exporters and Importers of Food, 2017 (Billion dollars and Percentage)
    Table-02:        United States – Anaphylactic Reaction to Peanuts by Age Group 0 to 3 to Over 60 years (Number), 2016 – 2020
    Table-03:        United States – Forecast for Anaphylactic Reaction to Peanuts by Age Group 0 to 3 to Over 60 years (Number), 2021 – 2027
    Table-04:        United States – Anaphylactic Reaction to Crustaceans by Age Group 0 to 3 to Over 60 years (Number), 2016 – 2020
    Table-05:        United States – Forecast for Anaphylactic Reaction to Crustaceans by Age Group 0 to 3 to Over 60 years (Number), 2021 – 2027
    Table-06:        United States – Anaphylactic Reaction to Food Additives by Age Group Age Groups 0 to 3 years to Over 60 years (Number), 2016 – 2020
    Table-07:        United States – Forecast for Anaphylactic Reaction to Food Additives by Age Group Age Groups 0 to 3 years to Over 60 years (Number), 2021 – 2027

    Related Reports