United States Plant Based Food Market by Segments (into Milk, Meat, Meals, Ice Cream, Yogurt, Creamer, Butter, Cheese, Tofu and Tempeh, Ready to Drink Beverages, Condiments, Dressings, and Mayo, Spreads, Dips, Sour Cream and Sauces, Eggs, and Others) By Food Services (quick-service restaurants (QSR), full-service restaurants, education, healthcare, lodging/casino, recreation, business and industry, and others) and Company Analysis 2025-2033
Buy NowUnited States Plant Based Food Market Size
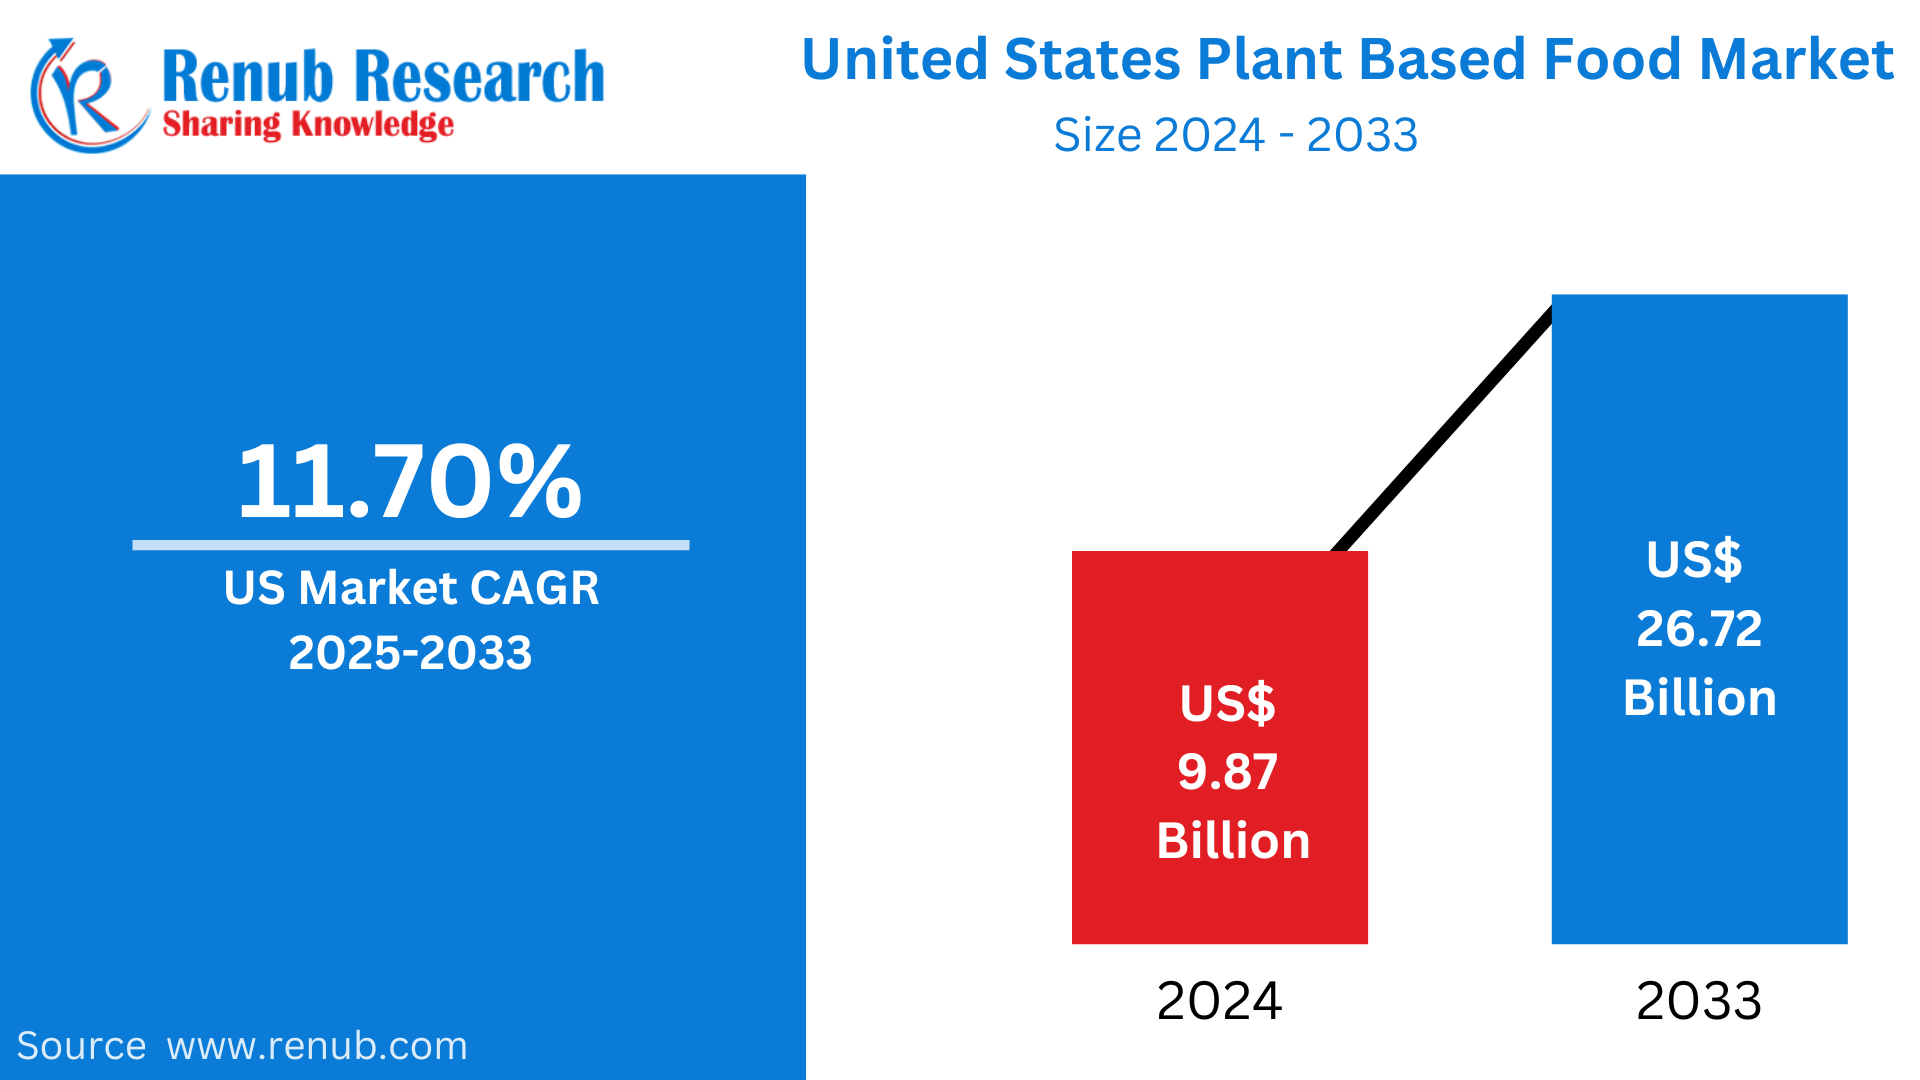
United States Plant Based Food market is expected to reach US$ 26.72 billion in 2033 from US$ 9.87 billion in 2024, with a CAGR of 11.70 % from 2025 to 2033. The widespread embrace of vegan lifestyles, the growing desire for sustainable food options to prevent animal suffering, and the expanding availability of a wide range of distinctive vegan food products through online platforms are all driving the market's notable expansion.
United States Plant Based Food Industry Overview
Due to rising consumer demand for sustainable, ethical, and healthier food options, the plant-based food business in the US has grown significantly. More Americans are switching to plant-based meat, dairy, and snack substitutes as they become more conscious of the environmental and health advantages of plant-based diets. Thanks to advancements in food technology and better flavor, texture, and nutritional profiles, products including plant-based burgers, dairy alternatives (milk, cheese, and yogurt), and plant-based protein powders have become increasingly popular.
An increasing trend toward flexitarian diets, in which customers limit but do not completely avoid animal-based items, is also helping the industry. Gen Z and Millennials have a significant impact on this trend since they frequently look for meals that support their beliefs in animal welfare and sustainability. The increasing demand for organic, gluten-free, and allergy-free products presents prospects for the plant-based food industry as well.
Along with well-known food corporations like Nestlé and PepsiCo, major players in the U.S. market include Beyond Meat, Impossible Foods, Oatly, and Silk, all of which are increasing their plant-based product lines. Price surcharges, complicated supply chains, and customer mistrust of highly processed plant-based products are some of the difficulties. The overall growth trajectory is still robust, though, and the market for plant-based foods in the US is anticipated to keep growing over the next several years.
Growth Drivers for the United States Plant Based Food Market
The Growing Demand for Sustainable Environmental Practices
People are looking for sustainable and environmentally friendly options, such vegan meals, as they become more conscious of the effects on the environment. Compared to food products that contain animal products, vegan food products have lower carbon emissions. According to a U.S. survey, 67% of customers were aware of how food production contributes to climate change, and 71% of consumers expressed concern about it. Furthermore, compared to animal meat, 47% of respondents said they preferred plant-based meat since it has a far smaller environmental impact and produces fewer carbon dioxide emissions. Furthermore, one study substituted plant-based protein sources for ground beef using life cycle assessment (LCA). At the national level, the replacement of plant-based burgers for 25%, 10%, and 50% of ground beef led to decreases in land occupation, water usage, and annual greenhouse gas emissions. Consequently, it is expected that this will enhance the prospects of the plant-based food sector in the upcoming years.
Retail and Restaurant Expansion
One major factor propelling the growth of the plant-based food market in the United States is the expansion of plant-based goods in restaurants and retail establishments. Supermarkets, health food stores, and grocery stores are carrying a greater variety of plant-based products, ranging from dairy products like milk, cheese, and yogurt to animal replacements like burgers and sausages. Customers find plant-based foods more convenient as a result of their increased availability, which lowers adoption hurdles. Furthermore, many fast-food restaurants and chains are adding plant-based products to their menus, drawing in both vegan and flexitarian customers. Prominent collaborations, like those with companies like Beyond Meat and Impossible Foods, have increased the awareness of plant-based products in quick-service dining establishments. Plant-based alternatives are becoming more widely available, enticing, and included into regular meals as a result of their increasing presence in the foodservice and retail industries.
Celebrity Endorsements and Media Influence
The rise in popularity of plant-based diets in the United States has been largely fueled by media influence and celebrity endorsements. A growing number of well-known people, including influencers, sports, and actresses, are promoting plant-based diets, frequently via public campaigns and social media. Because of their impact, plant-based eating has become increasingly accepted and aspirational. The promotion of plant-based products by celebrities like Serena Williams, Leonardo DiCaprio, and Billie Eilish has increased their visibility. The advantages of plant-based diets for health, ethics, and the environment have also been emphasized by media coverage in documentaries, news organizations, and lifestyle platforms. The market is growing as a result of these factors, which foster favorable associations with plant-based eating and inspire a larger audience to investigate and embrace plant-based substitutes.
Challenges in the United States Plant Based Food Market
Price Premium of Plant-Based Products
The cost difference between traditional animal-based substitutes and plant-based equivalents is one of the main obstacles facing the U.S. plant-based food business. Price increases for plant-based foods are frequently caused by the need for more costly raw materials, specialized production techniques, and greater transportation expenses. Cost-conscious buyers may be turned off by this price difference, especially in lower-income and price-sensitive markets. The widespread adoption of plant-based substitutes may be hampered as a result of consumers choosing less expensive, traditional animal goods. The affordability problem still prevents wider acceptance, even if costs have begun to drop as the industry expands and economies of scale take hold. In order to make plant-based solutions available to a larger customer base, especially in economically diverse neighborhoods, it will be imperative to address this obstacle.
Regulatory Hurdles
Regulations pertaining to product names and labeling are becoming increasingly significant as the market for plant-based foods grows in the US. The usage of terminology like "vegan cheese" and "plant-based milk," according to certain industry stakeholders, is causing controversy since they lead customers to believe that they are the same as their dairy counterparts. Specifically, the dairy sector has advocated for more stringent laws, calling for plant-based goods to be referred to as "non-dairy" or "plant-based beverage." Consequently, there is growing demand on regulatory agencies such as the FDA and USDA to establish and regulate plant-based product labeling. To prevent consumer misunderstanding, safeguard companies, and maintain fair competition in this quickly expanding industry, clearer regulations are required.
Meat alternatives will dominate the U.S. plant-based food market share
The plant-based meat industry inside the US is anticipated to increase appreciably because of the rising reputation of vegetarian and vegan diets. Soy based meat alternatives are becoming increasingly renowned because of their meat-like texture and flavors. Brands and startups inside the US are introducing soy-based products to cater to the developing demand, driven through consumer' desire for allergen-loose ingredients, health interest, sustainability problems, and advanced taste and availability of plant-based products in grocery stores.
Quick Service Restaurants (QSR) hold lion's share of plant-based revenue.
The QSR industry in the US is booming, thanks to the factor including fast urbanization, growing disposable income, and advancement in flavors and capabilities. There has been an extensive growth inside the popularity of plant-based meat, with several fast-food chains globally leaping on the trend. KFC, for instance, has become the first fast food chain to introduce a plant-based chicken product to its menu. In January 2022, KFC delivered Beyond Fried Chicken nuggets made from plant-based meat to its menu in the US, marking a substantial milestone within the food market journey towards sustainable and ethical meals manufacturing.
Segments – Market breakup from 14 Viewpoints
1. Milk
2. Meat
3. Meals
4. Ice Cream
5. Yogurt
6. Creamer
7. Butter
8. Cheese
9. Tofu and Tempeh
10. Ready to Drink Beverages
11. Condiments, Dressings and Mayo
12. Spreads, Dips, Sour Cream and Sauces
13. Eggs
14. Others
Food Services – Market breakup from 8 Viewpoints
1. Quick Service Restaurants (QSR)
2. Full Service Restaurants
3. Education
4. Healthcare
5. Lodging/Casino
6. Recreation
7. Business and Industry
8. Others
Merger and Acquisitions
All companies have been covered from 3 Viewpoints
• Overviews
• Recent Developments
• Revenues
Company Analysis – Market breakup from 8 Viewpoint
1. Beyond Meat Inc.
2. Conagra Brands
3. Maple Leaf Food Inc.
4. Archer Daniels Midland
5. US Foods Holding Corp
6. Kellanova
7. Tyson Foods
8. Hormel Foods Corporation
Report Details:
| Report Features | Details |
| Base Year |
2024 |
| Historical Period |
2020 - 2024 |
| Forecast Period |
2025 - 2033 |
| Market |
US$ Billion |
| Segment Covered |
Segments, and Food Service |
| Segments Covered |
|
| Companies Covered |
|
| Customization Scope |
20% Free Customization |
| Post-Sale Analyst Support |
1 Year (52 Weeks) |
| Delivery Format |
PDF and Excel through Email (We can also provide the editable version of the report in PPT/Word format on request) |
Customization Services available
- Analysis of Market Size and Its Segments
- More Company Profiles (Upto 10 without any additional cost):
- Additional Countries (Other than mentioned Countries):
- Region/Country Specific Reports:
- Market Entry Strategy:
- Region-Specific Market Dynamics:
- Regional Market Share Analysis:
- Trade Analysis:
- Production Insights:
- Others Customized Requests:
For more information contact our analysts.
Need More Assistance?
- Talk to our analysts to get more precious information on the current market trends.
- Include more countries and segments and customize the report based on the final requirement.
- Get a competitive advantage in your industry by knowing the report findings and making a positive impact on your revenues and operations.
- Our analysts are always ready to provide more help and pertinent information if you need any additional assistance.