Global LiDAR Market Size, Share & Forecast 2025–2033
Buy NowGlobal LiDAR Market Size
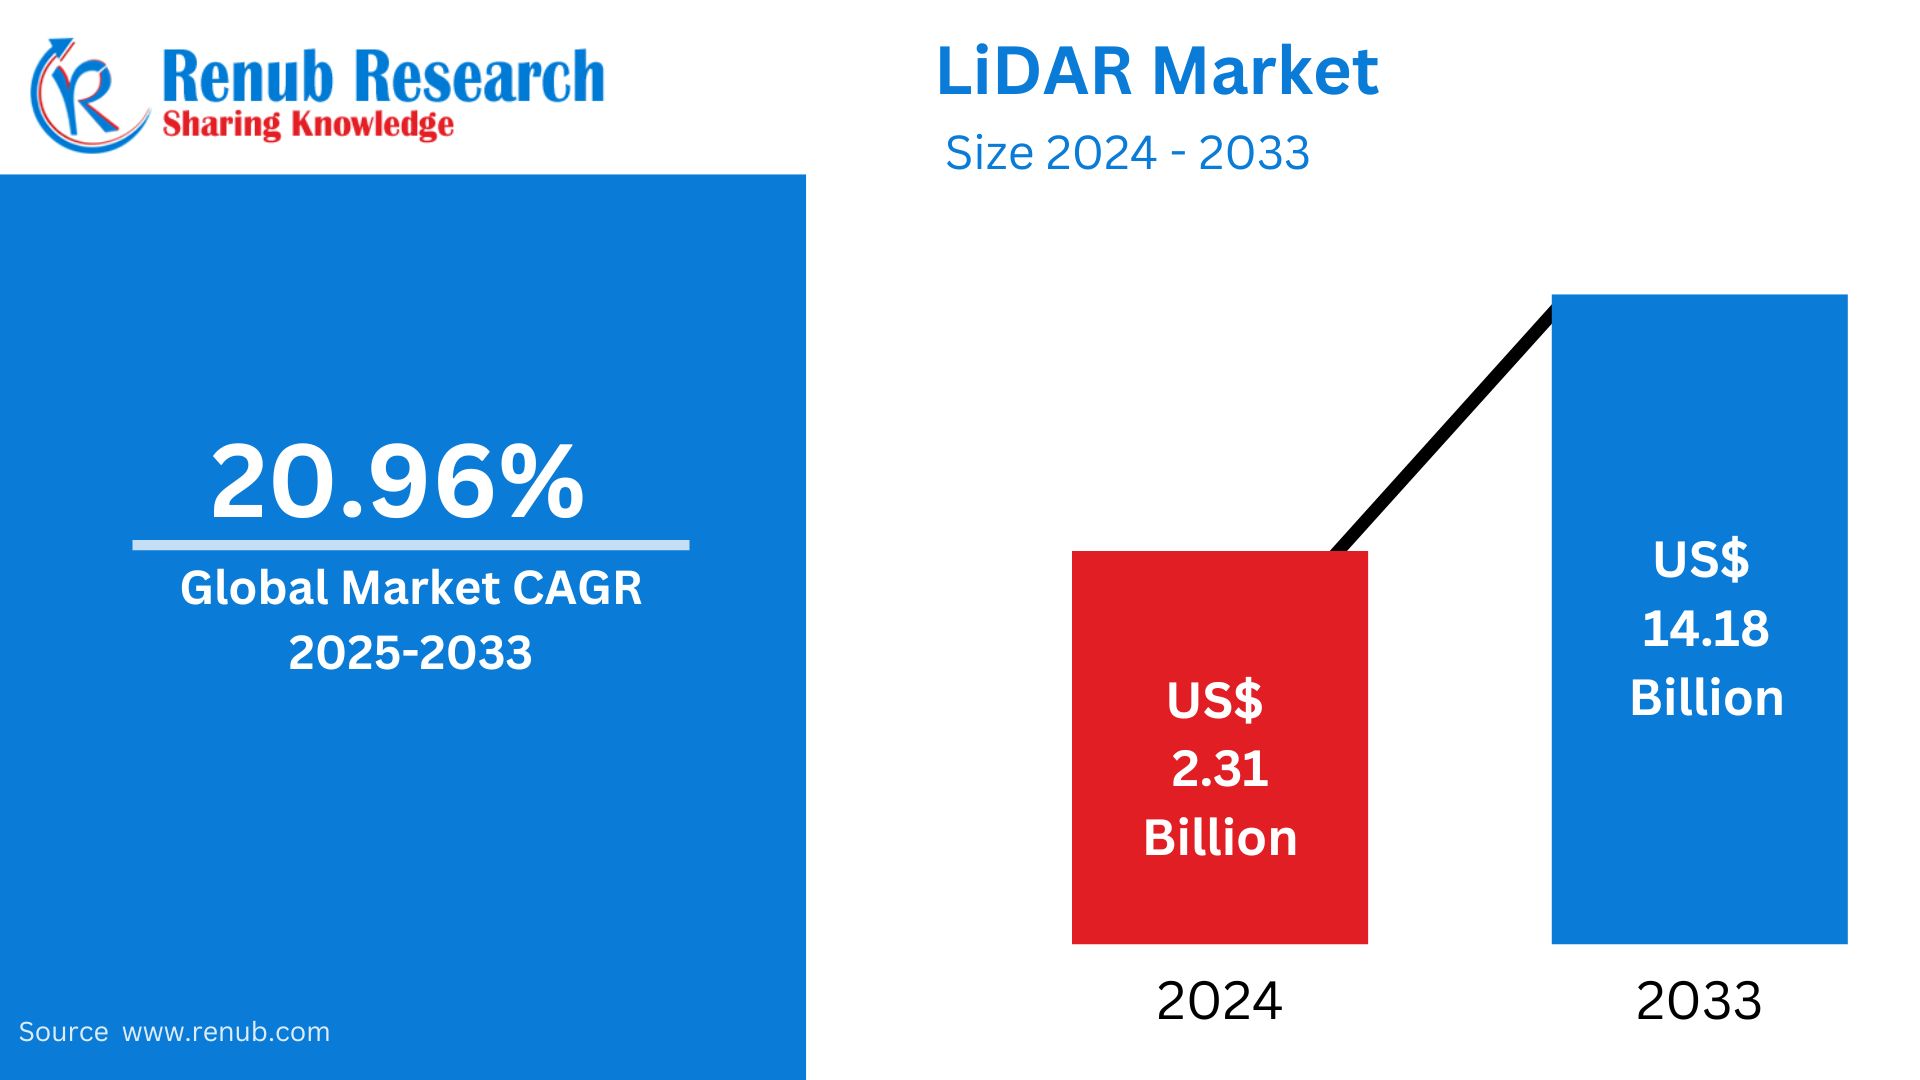
LiDAR market is expected to reach US$ 12.81 billion in 2033 from US$ 2.31 billion in 2024, with a CAGR of 20.96% from 2025 to 2033. The industry is expanding thanks to factors such the growing need for driverless cars, urban population expansion, and precision farming.
LiDAR Market Overview
More LiDAR (Light Detection and Ranging) is a remote sensing technique that measures varying distances to the Earth using light in the form of a pulsed laser. This technology produces accurate, three-dimensional data regarding the Earth's surface properties and shape. LiDAR is widely employed in many fields where precise geospatial data is essential, including geography, forestry, agriculture, autonomous vehicles, and infrastructure management.
The growing need for 3D imaging technology across a range of industries, including automotive, robotics, geographic information systems (GIS), and environmental monitoring, is propelling the worldwide LiDAR market's notable expansion. This demand is especially fueled by developments in autonomous vehicle technology, since LiDAR is an essential part of the sensor suites that allow these cars to navigate and comprehend their surroundings. Furthermore, a wider adoption across industries and applications has been made possible by the recent decrease in the cost of LiDAR sensors.
The automobile industry's transition to autonomous technology, where LiDAR sensors are essential for maintaining vehicle safety and navigational accuracy, is a major factor driving the need for LiDAR technology. Because LiDAR can give detailed topographical data that assists urban planning, disaster management, and climate studies, it is being used more and more in smart city initiatives and environmental monitoring outside of the automobile industry.
Growth Drivers for the LiDAR Market
Population growth in urban areas
According to a World Bank report, in 2023, about half of the people lived in urban regions. The necessity for developing effective traffic management and transportation systems is increasing. Transportation planners may better plan public transportation routes, manage traffic signals, and create safer crossings by using LiDAR technology to collect data on road networks, traffic patterns, and pedestrian movements. In addition, as the population of cities grows, more infrastructure—such as buildings, roads, and utilities—is required. Since LiDAR technology allows for 3D mapping and modeling of urban surroundings, it is the primary tool used in urban planning and development.
Growing use of precision farming
By lowering input consumption, minimizing environmental effect, and increasing resource efficiency, precision agriculture using LiDAR technology enables sustainable farming. Accordingly, LiDAR technology helps with precision planting and harvesting by giving precise measures of crop maturity, row alignment, and plant spacing. With the use of this data, farmers can adjust planting densities, lessen crop damage during harvest, and improve harvesting efficiency—all of which lead to increased yields and lower operating costs.
Growing interest in autonomous vehicles (AVs)
According to a survey by the IMARC Group, the global market for autonomous vehicles was valued at $81.0 billion in 2023. Advanced sensors are used by AVs to sense their environment and autonomously drive through traffic. Since the development of automated cars places a high premium on safety, there is a growing demand for LiDAR sensor technology, which provides accurate and dependable detection. In addition to cameras, radar, and other sensors, LiDAR is employed to provide a 360-degree view of the AVs' environment in real time. Accurate distance readings from LiDAR sensors enable AVs to make well-informed decisions and navigate safely in a variety of driving situations, including intricate urban environments and inclement weather.
Challenges in the LiDAR Market
Highly Expensive and complicated
The high costs and complexity of LiDAR technology's systems limit its acceptance, despite its expanding applications. The substantial financial outlay required for the creation and upkeep of LiDAR sensors may be prohibitive for small and medium-sized businesses and new competitors. Furthermore, integrating LiDAR systems into already-existing vehicles or infrastructures necessitates significant customisation, which raises the price even more. This financial difficulty is made worse by the complexity of LiDAR technology, which limits its accessibility and broad use by requiring specific expertise for operation and interpretation.
Complexity of Technology and Integration Problems
The technical difficulty of integrating LiDAR systems onto different platforms is one of the main obstacles facing the LiDAR sector. The practical deployment of these systems may be hampered by the need for substantial calibration, customization, and maintenance when integrating them. Overcoming these integration issues is also essential because LiDAR competes with other technologies, such as radar and camera systems, which are frequently less expensive and simpler to integrate. The wider deployment of LiDAR technology across numerous industries depends on ensuring interoperability with several platforms and streamlining the integration process without sacrificing data quality.
Globally, terrestrial LiDAR is increasing its share
Terrestrial LiDAR is increasing its worldwide market presence. This technology offers precise and accurate 3D mapping of terrestrial environments, making it necessary in various industries. Its potential to capture precise spatial data quickly and successfully enhances undertaking planning, monitoring, and management techniques. Also, improvements in LiDAR sensor technology and data processing strategies have made terrestrial LiDAR more available and cost-effective, further propelling its adoption globally.
laser scanners are growing in the global LiDAR market
Laser scanners are experiencing a sizeable upward push in the market due to their versatility and growing programs. These scanners provide excessive precision, making them critical devices in the car, advent, archaeology, and forestry industries. The demand for unique spatial statistics for urban planning, infrastructure development, and environmental monitoring drives the adoption of laser scanners. Moreover, upgrades in sensor technology and data processing talents also propel their growth in the LiDAR market.
Corridor mapping commands a high proportion
Corridor mapping holds an enormous share of the international LiDAR market. This dominance stems from its immense utility in various industries, which include transportation, town planning, and infrastructure improvement. Corridor mapping LiDAR structures are instrumental in growing particular 3D maps of linear features like roads, railways, pipelines, and electricity traces. They offer precise information collection and assessment competencies, facilitating efficient plans, preservation, and international management of transportation networks and linear infrastructure responsibilities.
The LiDAR industry is growing thanks to 3D technology's precise and effective capabilities
The industry is witnessing a surge in the adoption of 3D technology. 3D LiDAR systems provide superior precision, accuracy, and spatial focus compared to traditional 2D counterparts. They are extensively applied in independent automobiles, town-making plans, and infrastructure tracking programs. The growing call for exact and complete 3D mapping solutions, coupled with advancements in sensor technology and data processing skills, propels the quick growth of 3D technology in the international LiDAR market.
Short-range Because of its many uses, affordability, and adaptability, LiDAR has a sizable market share worldwide
Short-range LiDAR holds an extensive share in the global market. It is broadly utilized in automotive, robotics, and consumer electronics for collision avoidance, motion recognition, and object detection applications. The compact size, high precision, and low power intake of short-range LiDAR structures make them appealing for integration into various gadgets and systems. As those industries expand, the demand for short-range LiDAR is anticipated to grow.
LiDAR Market Overview by Regions
By countries, the global LiDAR market is dissected into North America (United States, Canada), Europe (France, Germany, Italy, Spain, United Kingdom, Belgium, Netherlands, Turkey), Asia Pacific (China, Japan, India, Australia, South Korea, Thailand, Malaysia, Indonesia, New Zealand), Latin America (Brazil, Mexico, Argentina), Middle East & Africa (South Africa, Saudi Arabia, and UAE).
United States LiDAR Market
Due to rising demand from a variety of industries, including automotive, aerospace, defense, agriculture, and construction, the US LiDAR market is expanding significantly. Autonomous vehicle navigation, topographic surveying, and accurate 3D mapping all make use of LiDAR (Light Detection and Ranging) technology. One of the main drivers is the emergence of autonomous vehicles, which require precise and up-to-date environmental data. The technology's uses in natural resource management, urban planning, and geographic information systems (GIS) all contribute to the market's growth. Growth is also being aided by government spending on environmental monitoring, defense, and infrastructure. But there are also issues like expensive equipment, complicated data processing, and the requirement for qualified personnel to run LiDAR systems. Despite this, the market is anticipated to keep growing as a result of growing adoption and technical advances.
For instance, according to data from the American Bar Association, 33,000 people died and 1.8 million people were injured in car crashes in the US in 2019. As a result of this tendency, technologies like ADAS are becoming more widely used. 92% of automobiles have at least one ADAS technology by 2020, such as forward collision warning (FCW) or automated emergency braking (AEB).
The development of LiDAR sensors as a result of advancements in LiDAR systems has allowed market participants to incorporate these sensors into automobiles. This improves safety and aids in their adherence to legal requirements. For example, Aeva and Daimler Trucks North America collaborated to unveil the Atlas LiDAR sensor at CES 2024 in January 2024. This LiDAR sensor can detect frequency-modulated continuous waves (FMCW) and time-of-flight (ToF).
United Kingdom LiDAR Market
The market for LiDAR in the UK is expanding quickly due to technological developments and increased applications in a variety of sectors, including environmental monitoring, construction, automotive, and agricultural. Autonomous vehicle navigation, topographic surveying, 3D mapping, and urban planning all make extensive use of LiDAR (Light Detection and Ranging) systems. The demand for LiDAR technology is being further fueled by the UK's emphasis on environmental sustainability, infrastructure development, and smart city programs. Another major market driver is the emergence of autonomous cars, which necessitate precise real-time mapping and obstacle recognition. Growth is also aided by government programs that assist environmental management and the gathering of geographic data. But issues including expensive startup costs, intricate data processing, and a shortage of qualified operators continue to exist. The market is anticipated to keep growing in spite of this.
India LiDAR Market
The growing need for high-precision 3D mapping and geospatial data in industries like construction, agriculture, urban planning, and transportation is driving the LiDAR market's explosive expansion in India. India's infrastructure projects and smart city programs are increasingly reliant on LiDAR technology, which is utilized for topographic surveys, infrastructure construction, and autonomous vehicle navigation. The market is expanding as a result of LiDAR's increasing use in surveying, environmental monitoring, and natural resource management. The need for LiDAR solutions is also being increased by the government's drive for digitization, which includes programs like the National Remote Sensing Centre and smart city initiatives. Adoption in some areas, however, may be constrained by issues including expensive equipment, complicated data processing, and the requirement for qualified personnel. The market is anticipated to expand gradually in spite of these obstacles.
United Arab Emirates LiDAR Market
The market for LiDAR in the United Arab Emirates (UAE) is expanding rapidly due to rising demand for sophisticated mapping, surveying, and geospatial data solutions. In the UAE, LiDAR technology is extensively utilized in a variety of fields, including environmental monitoring, transportation, urban planning, and construction. LiDAR adoption is being driven mostly by the nation's fast urbanization, infrastructure development, and smart city programs like Dubai's Vision 2021. The industry is further boosted by the development of autonomous vehicles and the need for accurate topographic data for building projects. Growth is supported by government spending on infrastructure projects, environmental monitoring, and digital change. Faster adoption, however, can be hampered by issues including expensive equipment, complicated data processing, and the requirement for qualified personnel. It is anticipated that the industry would keep expanding in spite of these obstacles.
Market Segmentation
Types – Market breakup in 4 viewpoints:
- Terrestrial
- Aerial
- Mobile
- Short Range
Components – Market breakup in 5 viewpoints:
- LASER
- Inertial Navigation System
- Camera
- GPS GNSS Receiver
- MEMS (Micro Electro Mechanical Systems)
Application – Market breakup in 6 viewpoints:
- Corridor Mapping
- Engineering
- Environment
- Exploration
- Advanced Driver Assistance Systems
- Others
Technology – Market breakup in 3 viewpoints:
- 3D
- 2D
- 1D
Range – Market breakup in 3 viewpoints:
- Short Range
- Medium Range
- Long Range
Regional Analysis
North America
- United States
- Canada
Europe
- France
- Germany
- Italy
- Spain
- United Kingdom
- Belgium
- Netherlands
- Turkey
Asia Pacific
- China
- Japan
- India
- South Korea
- Thailand
- Malaysia
- Indonesia
- Australia
- New Zealand
Latin America
- Brazil
- Mexico
- Argentina
Middle East & Africa
- Saudi Arabia
- UAE
- South Africa
All the Key players have been covered from 3 Viewpoints:
• Overview
• Recent Developments
• Revenue Analysis
Company Analysis:
- Faro Technologies Inc.
- Hexagon AB
- Vaisala Oyj
- Sick AG
- Teledyne Technologies Inc.
- Innoviz Technologies Ltd.
- LeddarTech Inc.
- NV5 Global Inc.
Report Details:
| Report Features | Details |
| Base Year |
2024 |
| Historical Period |
2020 - 2024 |
| Forecast Period |
2025 - 2033 |
| Market |
US$ Billion |
| Segment Covered |
Type, Component, Application, Technology, Range and Countries |
| Countries Covered |
|
| Companies Covered |
|
| Customization Scope |
20% Free Customization |
| Post-Sale Analyst Support |
1 Year (52 Weeks) |
| Delivery Format |
PDF and Excel through Email (We can also provide the editable version of the report in PPT/Word format on request) |
Customization Services available
- Analysis of Market Size and Its Segments
- More Company Profiles (Upto 10 without any additional cost):
- Additional Countries (Other than mentioned Countries):
- Region/Country Specific Reports:
- Market Entry Strategy:
- Region-Specific Market Dynamics:
- Regional Market Share Analysis:
- Trade Analysis:
- Production Insights:
- Others Customized Requests:
For more information contact our analysts.
Need More Assistance?
- Talk to our analysts to get more precious information on the current market trends.
- Include more countries and segments and customize the report based on the final requirement.
- Get a competitive advantage in your industry by knowing the report findings and making a positive impact on your revenues and operations.
- Our analysts are always ready to provide more help and pertinent information if you need any additional assistance.