Global Autonomous Vehicles Market Size, Share & Forecast 2025–2033
Buy NowAutonomous Vehicles Market Forecast and Opportunities (2025–2033)
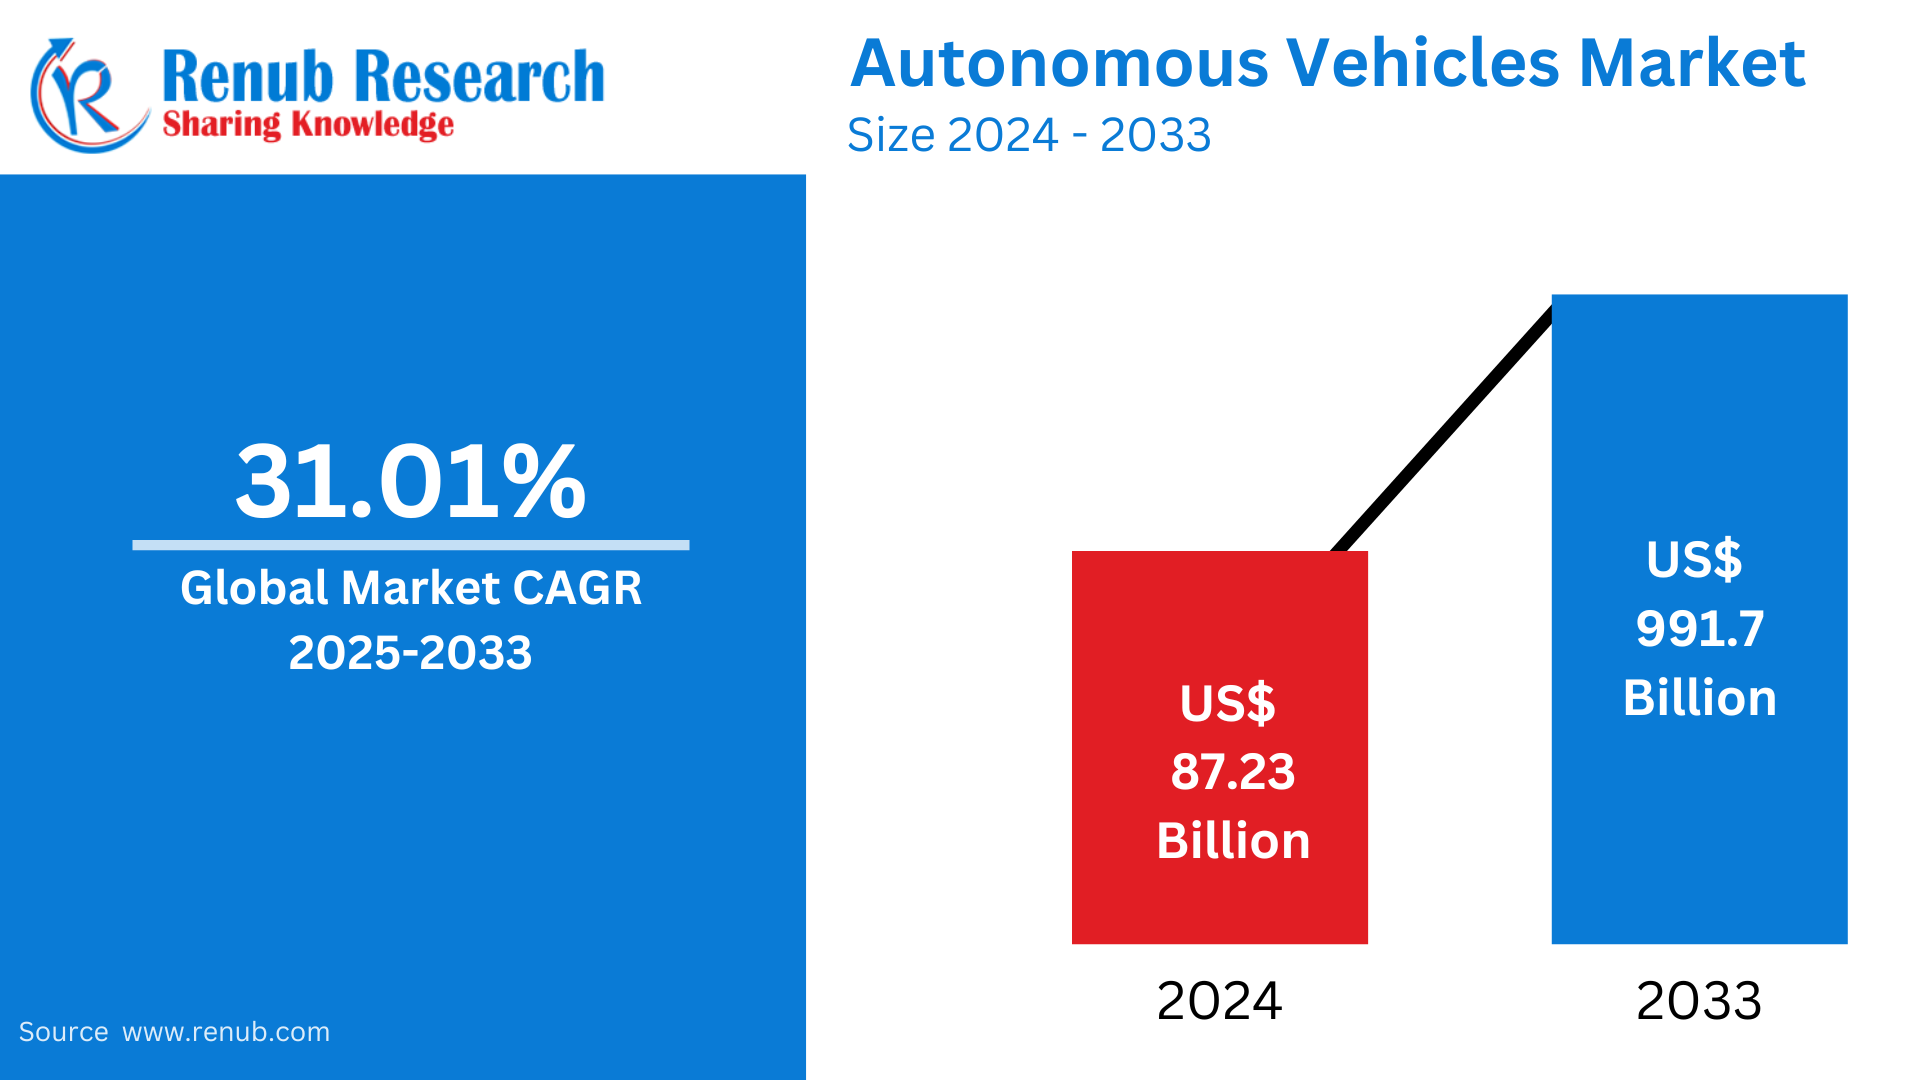
The autonomous vehicle market worldwide is anticipated to become US$ 991.7 billion by 2033 from US$ 87.23 billion in 2024 at a compound annual growth rate (CAGR) of 31.01% during the period from 2025 to 2033. The growth in the market is influenced by emerging technologies in artificial intelligence, sensors, and demand for more secure and efficient modes of transportation. The growth is also stimulated by regulatory policies and changing consumer needs.
Autonomous Vehicles Market Report by Component (Hardware, and Software and Services), Level of Automation (Level 3, Level 4, and Level 5), Application (Transportation and Logistics, and Military and Defense), Region and Company Analysis 2025-2033
Global Autonomous Vehicles Market Overview
Autonomous cars (AVs) or self-driving cars are cars fitted with technology that allows them to move and drive without any human input. They utilize a combination of lidar, radar, cameras, sensors, and artificial intelligence (AI) to sense what is around them, make choices, and operate vehicle functions. AVs employ sophisticated algorithms to identify obstructions, interpret road features, and obey traffic rules while ensuring the safety of passengers.
The main application of autonomous cars is to provide safer, more efficient travel. By eliminating human error in driving, AVs can minimize traffic accidents, make traffic flow better, and maximize fuel efficiency. They are especially useful for older, disabled, and other people who cannot drive. Autonomous cars can also be employed for ride-sharing and delivery purposes, lessening the necessity for human drivers. In sectors such as public transport and logistics, AVs can completely transform operations, enhancing efficiency and decreasing operational expenses and environmental footprint.
Growth Drivers of the Global Autonomous Vehicles Market
Improvements in Artificial Intelligence (AI)
Improvement in AI technology is spearheading the growth of the global autonomous vehicles market. AI allows autonomous cars to analyze data from sensors, make decisions, and anticipate possible dangers on the road. Machine learning algorithms improve the vehicle's capacity to learn and respond to different driving conditions, enhancing safety and efficiency. With advancements in AI, autonomous vehicle performance increases, promoting broader adoption across industries, including transportation, logistics, and ride-sharing services. Dec 2024, Uber Technologies, Inc. partnered with WeRide, a pioneer in autonomous driving, to introduce their ride-hailing collaboration in Abu Dhabi.
Growing Consumer Demand for Safety and Convenience
The rise in demand for safer, more convenient modes of transportation is one of the biggest drivers of the autonomous vehicles market. Consumers are becoming more worried about road safety, and AVs are set to drastically curb accidents caused by human error. The convenience of autonomous driving, such as the use of adaptive cruise control and automated parking, is attractive to consumers. As the level of public knowledge about the advantages of AVs increases, consumers are increasingly willing to accept autonomous vehicle technology, further spurring market expansion. April 2024, Horizon Robotics just hosted its 2024 Product Launch Event and launched the Horizon SuperDrive™ full-stack AD solution. Collaborating with industry leaders, the company is committed to developing intelligent driving solutions that span ADAS active safety, all-scenario NOA (Navigate on Pilot), focusing on consumers' safety, comfort, and convenience.
Government Support and Regulations
Government support and regulations enabling autonomous vehicle development and deployment is another significant growth driver. Most nations are investing in autonomous car technology through financing, research, and supporting policies to encourage innovation and safety. The United States, the European Union, and China are leading the adoption of AV policies, including standards for testing and deploying vehicles to support safety and environmental regulations. All these activities are building a supportive ecosystem for the autonomous car market, stimulating both new companies and established ones to innovate AV technologies. Oct 2024, R&D funding by the government of India is supported by initiatives such as the Atal Innovation Mission, grants by NITI Aayog, and Make in India, which serves to provide much-needed financial support to startups and firms investing in autonomous vehicle research.
Obstacles in the Global Autonomous Vehicles Market
Technical Challenges in Sensor Technology
Though major developments have been made, sensor technology deployed in autonomous vehicles is still constrained by technical challenges, and such limitations pose hurdles for market expansion. The performance, reliability, and accuracy of sensors like LiDAR, cameras, and radar are all important for safe AV operation. Weather, road surface, and sensor failure can lead to errors, making it difficult for the vehicle to read its environment. Addressing these technical issues is important in order to enhance the safety and performance of autonomous cars, hindering the rapid dissemination of the technology.
Ethical and Legal Issues
Ethical and legal issues relating to autonomous vehicles pose considerable hurdles for their market development. Concerns such as responsibility in the event of accidents, privacy of data, and ethics of decision-making by autonomous systems must be managed. Governments will have to frame new legislation governing the running of autonomous vehicles such that rights of passengers and security are guaranteed. Furthermore, ethical issues regarding the algorithms of AVs, e.g., decision-making in unavoidable crash situations, need to be thoroughly thought through in order to win the confidence and trust of the public.
Autonomous Vehicles Hardware Market
The autonomous vehicles hardware market is influenced by the rising need for high-performance sensors, cameras, LiDAR, radar, and computing systems that drive autonomous driving. The hardware components help AVs detect the environment, make decisions in real-time, and drive safely. As advanced technology drives autonomous vehicles, the hardware market will grow, with development centered on sensor accuracy improvement, cost reduction, and system reliability enhancement. This industry is instrumental in the evolution of autonomous driving technology and is necessary for complete autonomy in cars.
Autonomous Vehicles Software and Services Market
The autonomous vehicles software and services market worldwide is growing at a very fast rate due to the demand for smart software solutions that make self-driving vehicles navigate sophisticated environments. These software programs apply machine learning, computer vision, and deep learning to process sensor data and drive. Software services including over-the-air updates, data storage through cloud-based platforms, and fleet management solutions are also becoming vital for autonomous vehicle fleet management. With the progression of technology, the need for software and services will keep growing, and it will be an integral part of the autonomous vehicles ecosystem.
Autonomous Vehicles Level 3 Market
The Level 3 autonomous vehicles market across the globe is growing rapidly as manufacturers and technology firms concentrate on attaining partial automation in cars. In Level 3, the car can perform most of the driving tasks, but human input is needed in some situations. This level of automation offers a perfect balance of convenience and safety, and hence it is a preferred choice among consumers. As vehicle manufacturers develop Level 3 technologies further and collaborate with the regulators, this segment will experience common adoption, mainly in luxury sectors and in advanced driver-assistance systems (ADAS).
Autonomous Vehicles Military and Defense Market
The worldwide autonomous vehicles military and defense market is expanding as defense agencies and governments increasingly use autonomous technology for several applications. Autonomous vehicles provide increased efficiency, safety, and tactical superiority in military operations, such as surveillance, logistics, and combat missions. Autonomous supply chains, drones, and unmanned ground vehicles are some of the primary areas where the military industry is adopting AV technologies. The military and defense industries' demand for autonomous vehicles is driven by the requirement for cost-saving, risk-minimizing solutions to increase operational capabilities and ensure a technological advantage.
United States Autonomous Vehicles Market
The United States is a global leader in the autonomous vehicles market, with a strong lead in the development and testing of autonomous driving technology. U.S.-based firms such as Tesla, Waymo, and Uber are the leaders in AV innovation, with significant investments in research and development. The robust technology ecosystem of the country, together with the supporting government policies and regulations, propels the development of the autonomous vehicle market. Widespread application of autonomous vehicles in commercial transportation fleets as well as in cities is likely in the United States. September 2023 – Mercedes-Benz plans to release production-ready implementation of its DRIVE PILOT system in the U.S. This next-generation system for conditionally automated driving is set to launch in late 2023 with a small fleet of EQS Sedans that feature SAE Level 3 technology. The initial deployment will be in California and Nevada.
France Autonomous Vehicles Market
France is becoming a major force in the European autonomous vehicles market, with a focus on the adoption of AV technology in public transportation, logistics, and private cars. The government of France has been actively backing the growth of autonomous driving in the form of investments, partnerships with technology companies, and regulation. France is piloting autonomous shuttle buses and testing autonomous taxis in big cities. The increased demand for sustainable transport solutions and the nation's focus on curbing emissions are also propelling the use of autonomous vehicles in the French market. May 2024 – Renault Group's conviction is that technology must be shared, accessible economically, and truly useful to as wide a population as possible.
India Autonomous Vehicles Market
The autonomous vehicles market in India is in its nascent stages but has high growth potential with rapid urbanization, escalating traffic congestion, and growing emphasis on green transport solutions. The Indian government's drive for smart city projects and road safety enhancement schemes has provided a favorable climate for AV development. Although issues of infrastructure constraints and regulatory challenges continue to exist, the need for more efficient, safer, and environmentally friendly means of transportation will probably spur autonomous vehicle adoption in India, especially for ride-hailing and logistics services. Jun 2023, Bengaluru startup introduces zPod, India's first autonomous car. This electric vehicle relies on a camera-sensor suite and artificial intelligence algorithms to steer through traffic without a human driver.
Saudi Arabia Autonomous Vehicles Market
Saudi Arabia's autonomous vehicles market is growing as the nation aims to diversify its economy and adopt innovative technologies in the spirit of Vision 2030. Autonomous vehicles are considered to be a central aspect of the country's vision to upgrade the transport network, avoid traffic jams, and increase security. The government is investing in smart city projects, including the NEOM project, where autonomous transportation solutions will be part of the same. As the regulatory framework and infrastructure develop, autonomous vehicles are likely to be in higher demand in Saudi Arabia, particularly in logistics and urban mobility sectors. April 2023, The Deputy Minister of Transport and Logistics, inaugurated the trial operation of 'Dhahaina' (Smart), a new autonomous vehicle, at the Riyadh Business Front. The event was designed to increase awareness and acceptance of autonomous vehicle technology and represents the start of the process of creating associated legislation and regulation.
Autonomous Vehicles Market Segmentation
Component
- Hardware
- Software and Services
Level of Automation
- Level 3
- Level 4
- Level 5
Application
- Transportation and Logistics
- Military and Defense
Regional Analysis
North America
- United States
- Canada
Europe
- France
- Germany
- Italy
- Spain
- United Kingdom
- Belgium
- Netherlands
- Turkey
Asia Pacific
- China
- Japan
- India
- Australia
- South Korea
- Thailand
- Malaysia
- Indonesia
- New Zealand
Latin America
- Brazil
- Mexico
- Argentina
Middle East & Africa
- South Africa
- Saudi Arabia
- UAE
All the Key players have been covered from 5 Viewpoints:
- Overview
- Key persons
- Recent Development
- Product Portfolio
- Revenue
Key Players Analysis
- Ford Motor Company
- AB Volvo
- AUDI Aktiengesellschaft (Volkswagen Group)
- General Motors
- Tesla Inc.
- Toyota Motor Corporation
- Uber Technologies Inc.
- BMW AG
Report Details:
| Report Features | Details |
| Base Year |
2024 |
| Historical Period |
2020 - 2024 |
| Forecast Period |
2025 - 2033 |
| Market |
US$ Billion |
| Segment Covered |
By Component, By Level of Automation, By Application & By Countries |
| Countries Covered |
|
| Companies Covered |
|
| Customization Scope |
20% Free Customization |
| Post-Sale Analyst Support |
1 Year (52 Weeks) |
| Delivery Format |
PDF and Excel through Email (We can also provide the editable version of the report in PPT/Word format on request) |
Key Questions Answered in This Report:
-
What is the projected market value of the global autonomous vehicle market by 2033?
-
What is the estimated compound annual growth rate (CAGR) for the market from 2025 to 2033?
-
How do artificial intelligence (AI) and sensor advancements contribute to the growth of autonomous vehicles?
-
What are the major challenges faced by the autonomous vehicle industry, including technical, ethical, and legal issues?
-
What role do governments play in supporting the adoption of autonomous vehicles through policies and funding?
-
How is consumer demand for safety and convenience driving the market for autonomous vehicles?
-
Which key companies are leading the development and deployment of autonomous vehicle technologies?
-
What are the main applications of autonomous vehicles across transportation, logistics, and defense?
-
How does the adoption of different levels of automation (Level 3, Level 4, and Level 5) vary across industries?
-
Which regions or countries are expected to experience the fastest growth in the autonomous vehicle market?
Customization Services available
- Analysis of Market Size and Its Segments
- More Company Profiles (Upto 10 without any additional cost):
- Additional Countries (Other than mentioned Countries):
- Region/Country Specific Reports:
- Market Entry Strategy:
- Region-Specific Market Dynamics:
- Regional Market Share Analysis:
- Trade Analysis:
- Production Insights:
- Others Customized Requests:
For more information contact our analysts.
Need More Assistance?
- Talk to our analysts to get more precious information on the current market trends.
- Include more countries and segments and customize the report based on the final requirement.
- Get a competitive advantage in your industry by knowing the report findings and making a positive impact on your revenues and operations.
- Our analysts are always ready to provide more help and pertinent information if you need any additional assistance.