Agricultural Tractor Market Size and Share Analysis - Growth Trends and Forecast Report 2025-2033
Buy NowAgricultural Tractors Market Trends & Summary
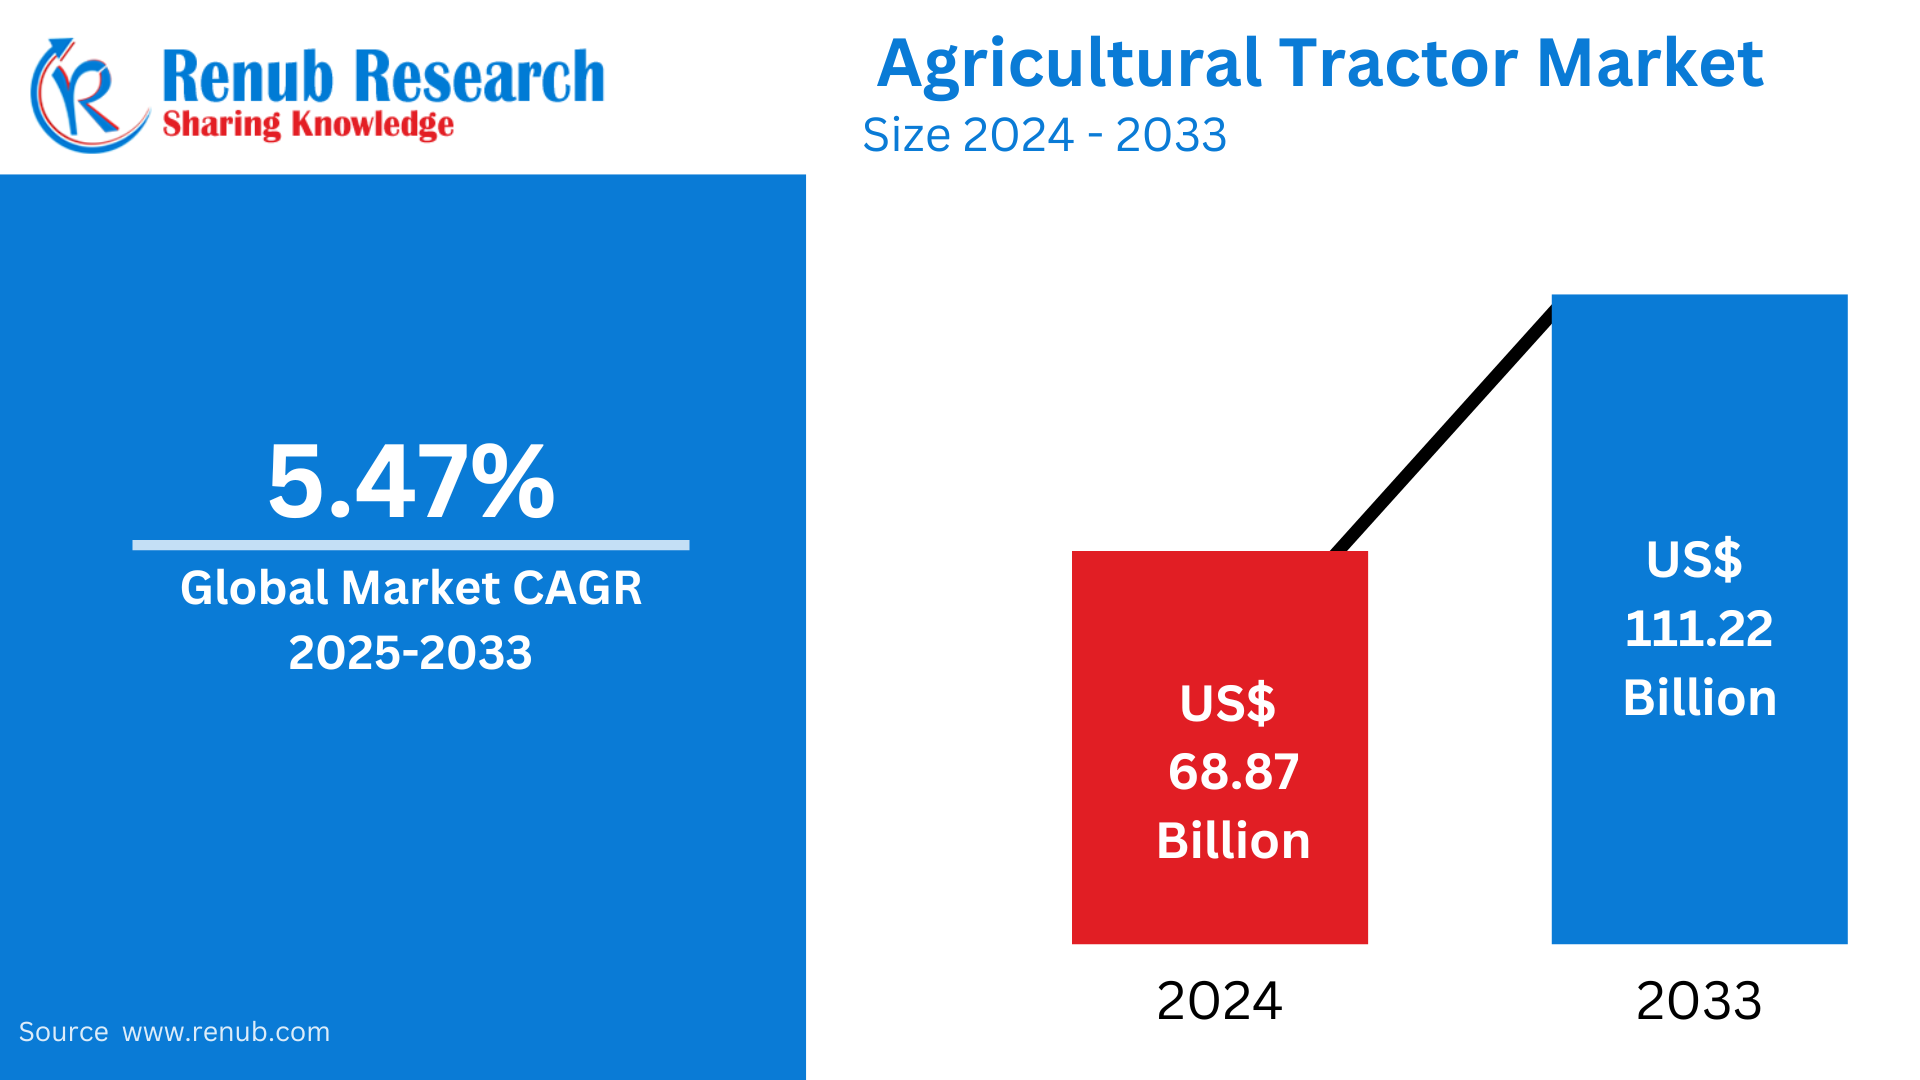
The market for agricultural tractors is estimated to reach USD 68.87 billion by 2024, spurred by growing mechanization in agriculture. The market is anticipated to grow at a CAGR of 5.47% between 2025 and 2033, reaching USD 111.22 billion by 2033. Market growth is spurred by factors such as growing food demand, technology innovation, and government incentives for new agriculture.
The report Agricultural Tractors Market Forecast covers by Horse Power (Lesser than 40 HP, 40 HP to 99 HP, 100 HP to 150 HP, 151 HP to 200 HP, 201 HP to 270 HP, 271 HP to 350 HP, Greater than 350 HP), Type (Orchard Tractors, Row-crop Tractors, Other Types), Application (Harvesting, Seed Sowing, Spraying, Others), Country and Company Analysis 2025-2033.
Agricultural Tractors Market Outlooks
Farm tractors are specialized equipment utilized in agriculture to carry out operations like plowing, tilling, planting, and harvesting. They increase productivity by minimizing human labor and increasing efficiency in agricultural work. Tractors are of different types, such as utility tractors, row crop tractors, and compact tractors, for diverse farming requirements.
The world consumption of farm tractors is increasing with growing mechanization in farming, population, and the demand for greater food output. Developed nations such as the U.S., Germany, and Japan have superior adoption rates of sophisticated tractors with automation and GPS technology. On the other hand, developing nations like India, China, and Brazil are witnessing a spurt in the demand for tractors because of government subsidies and advanced farming methods. Demand for electric and fuel-efficient tractors is also rising as sustainability becomes a concern. With technological development and growing concerns for food security, the world agricultural tractor market is likely to grow steadily over the next few years.
Drivers of Growth in the Global Agricultural Tractor Market
Increased Mechanization in Agriculture
The need for greater efficiency and productivity in agriculture has led to extensive mechanization, creating demand for farm tractors. Farmers are using tractors to carry out manual tasks like plowing, sowing, and harvesting more effectively. Government schemes in developing nations, such as subsidies and loan facilities, urge farmers to spend money on mechanized farming machines. Moreover, the lack of skilled farmhands has also expedited the usage of tractors, providing higher yields and lesser reliance on labor. The demand for contemporary farming techniques, aided by precision agriculture, is anticipated to maintain this rate of growth for the next several years. Aug 2024, AGCO Corporation, agricultural equipment and precision ag technology, will be promoting new products as well as solutions oriented toward the farmer. Items include new tractors from Massey Ferguson®, Fendt®, and exhibiting by PTx Trimble™, Precision Planting®, as well as FarmerCore.
Technological Innovations and Smart Tractors
The incorporation of new technologies in tractors, including GPS, automation, telematics, and artificial intelligence, is transforming the agricultural industry. Intelligent tractors with precision farming features allow farmers to maximize field operations, reduce wastage, and increase productivity. Electric and autonomous tractors are becoming popular because they save fuel and have a lower environmental footprint. In addition, sensor technology and IoT application innovations aid in monitoring soil health and enhancing resource management. These technological advancements are likely to propel strong growth in the agricultural tractor market as farmers continue to look for sophisticated and efficient solutions for contemporary farming. July 2024, Monarch Tractor's driver-optional smart tractor and Wingspan Ag Intelligence platform made history with a record-breaking $133 million Series C funding round, the largest in the history of agricultural robotics.
Government Support and Subsidies
Most governments across the globe are encouraging agricultural mechanization with financial support and subsidies. Schemes on sustainable agriculture, rural growth, and farm productivity urge farmers to make investments in new equipment, such as tractors. Nations such as India, China, and Brazil offer incentives, credit lines, and tax concessions to buy farm equipment like tractors. In the European Union and North America, regulations on precision farming and sustainable farming also enhance the use of tractors. These government-sponsored programs lower the cost of finance for farmers and make tractors more affordable, playing a major role in market growth. Feb 2025, The Indian government's Sub-Mission on Agricultural Mechanization (SMAM) assists small and marginal farmers by providing subsidies of 20% to 50% on the purchase of tractors, with priority to Scheduled Caste (SC), Scheduled Tribe (ST), and women farmers.
Challenges in the Global Agricultural Tractor Market
High Initial Investment and Maintenance Costs
Farm tractors, particularly those of advanced technology, are costly to purchase and, therefore, out of reach for small- and medium-scale farmers. Further, the maintenance and repair costs of new tractors, in terms of fuel, spare parts, and maintenance services, contribute to the total expenses. Financial aid is available in some countries, but cost is still a serious problem for developing nations. Farmers use second-hand tractors as a rule, which does not stimulate the sales of new high-tech models. The high-cost element prevents the extensive use of tractors, especially in areas with low farm revenues and poor access to credit.
Environmental and Regulatory Challenges
More stringent environmental regulations regarding emissions and fuel usage challenge the agricultural tractor industry. Conventional diesel tractors emit greenhouse gases, placing pressure on manufacturers to create environmentally friendly alternatives. Governments are enacting tough emission regulations, mandating producers to invest in eco-friendly solutions like electric and hybrid tractors. Fluctuating fuel prices and trade policies pose barriers to mass-market adoption due to the high price and limited infrastructure for electric farm equipment. Fluctuating fuel prices and shifting trade policies affect the entire market, leaving manufacturers and farmers with uncertainties.
Agricultural 40 HP to 99 HP Tractor Market
Small-scale and medium-scale farmers extensively employ the 40 HP to 99 HP tractor segment for various agricultural operations, such as plowing, planting, and harvesting. Tractors in this range maintain a balance between power and cost, thus proving to be very popular in developed and developing nations. These tractors are best for small-scale farming, orchards, and dairy farming. Demand for these tractors is growing on account of government subsidies and advances in technology like GPS and automatic steering. As there is more mechanization and the demand for effective mid-range tractors, this segment will see steady growth in the next few years.
Agricultural 201 HP to 270 HP Tractor Market
The 201 HP to 270 HP tractor market addresses large-scale commercial farming businesses with high horsepower demands for extensive work in the field. The tractors are endowed with sophisticated features like precision farming technology, auto controls, and enhanced fuel economy. They handle heavy-duty work like deep plowing, heavy harvesting, and multi-implement operations. The market for high-powered tractors is boosted by the desire for higher productivity and efficiency on large farmlands, most notably in North America, Europe, and select regions of Asia. The market is expected to grow with ongoing innovation in high-horsepower tractors.
Agricultural Orchard Tractor Market
Tractors used specifically in vineyards, orchards, and plantations are the orchard tractors, in which compact size and maneuverability are crucial. These tractors with narrow bodies can drive through rows of trees and crops without injuring crops. They usually have protective cabs, low clearance from the ground, and specially designed tires to manage uneven terrain. Demand for orchard tractors increases with the growth in fruit and nut cultivation globally. As more farms adopt precision farming methods, automated spraying and harvesting orchard tractors are poised to be even more popular with farmers.
Global Agricultural Harvesting Tractor Market
Modern agriculture depends much on harvesting tractors as these help harvest crops more efficiently with less expenditure. Harvesting tractors are traditionally used with such attachments as the combine and the forage harvesters. The demand for harvesting tractors is growing globally as farmers are emphasizing mechanized harvesting to increase yields and reduce post-harvest losses. North America and Europe dominate the market while emerging economies in Asia and Africa are slowly embracing harvesting tractors to enhance productivity. The launch of autonomous harvesting tractors will also drive growth in this segment further.
Global Agricultural Spraying Tractor Market
Spraying tractors are required to spray pesticides, herbicides, and fertilizers in large open fields. Such tractors have specialized spraying heads that distribute the chemicals evenly and enhance crop defense and production. The need for spraying tractors is on the rise with better awareness of precision agriculture and an urgent requirement to control pests and weeds effectively. GPS-equipped new models and spraying systems supported by drones are increasing in popularity. With the increasing focus on sustainable agriculture and precision use, the market for spraying tractors is likely to expand in the next few years.
United States Agricultural Tractor Market
The United States agricultural tractor market is fueled by commercial farming on a large scale, sophisticated agricultural technology, and government incentives for mechanization. Powerful tractors are demanded because of extensive farmlands that need efficient equipment. The market is also seeing growth in autonomous and electric tractors backed by sustainability campaigns. Moreover, American farmers embrace precision agriculture technology more and more, boosting productivity. The market is also underpinned by the presence of leading global tractor manufacturers. The U.S. agricultural tractor market is likely to see steady growth with ongoing improvement in farming methodologies. Dec 2022 – Monarch Tractor announced its first MK-V tractors, its fully electric, driver-optional smart tractors, rolled off the production line at its Livermore, California facility.
Italy Agricultural Tractor Market
Italy specializes in having an agricultural tractor market for vineyard and orchard tractors. Italy's high-value crop concentration on grapes and olives promotes demand for agile and compact tractors. Italian producers are leaders in innovation, manufacturing technologically advanced and energy-efficient tractors. Incentives for mechanization and sustainable agriculture from the government fuel market growth. With Italy's ongoing modernization of its agricultural industry, the need for efficient and specialized tractors is expected to increase, guaranteeing continuous growth in the market. Sept 2023, OXE-E, an Italian firm, is working on a 100% electric, autonomous tractor with a tethered cable as the power source for heavy-duty farming.
China Agricultural Tractor Market
China's agricultural tractor market is growing rapidly because of large-scale mechanization and government drives towards modern agriculture. Demand for high-powered tractors rises as the country transitions towards commercial agriculture. The market is dominated by domestic manufacturers, who make affordable tractors with sophisticated features. The use of precision farming technology, such as GPS tractors, is also on the rise. With ongoing investment in rural development and agricultural modernization, China's tractor market will develop strongly in the years to come. June 2024: Ricardo, a UK engineering consultancy, has entered into an agreement with Wuzheng, a Chinese commercial vehicle company, to create powertrains for electric tractors and agricultural equipment. The partnership is meant to research new technologies and enhance powertrain efficiency in Wuzheng's product lineup.
UAE Agricultural Tractor Market
The UAE agricultural tractor market is smaller but expanding in response to enhanced agritech and sustainable agriculture investments. The government's emphasis on food security as well as controlled environment agriculture demand for specialized tractors. Hydroponic cultivation and greenhouse agriculture are among the factors driving efficient tractor demand. Government incentives supporting agricultural innovation coupled with sophisticated irrigation systems are catalyzing the growth of the market. As the UAE expands its agricultural base, the call for technologically sound tractors is likely to increase. Feb 2025, Escorts Kubota rolled out the FARMTRAC PROMAXX tractor range, providing mid horsepower models of 39-47 HP. With seven models on offer, with both 2WD and 4WD configurations (PROMAXX 39, 42, 45, and 47), the range is convenient for multiple agricultural and commercial applications, including haulage.
Agricultural Tractor Market Segments
Horse Power
- Lesser than 40 HP
- 40 HP to 99 HP
- 100 HP to 150 HP
- 151 HP to 200 HP
- 201 HP to 270 HP
- 271 HP to 350 HP
- Greater than 350 HP
Type
- Orchard Tractors
- Row-crop Tractors
- Other Types
Application
- Harvesting
- Seed Sowing
- Spraying
- Others
Countries
North America
- United States
- Canada
Europe
- France
- Germany
- Italy
- Spain
- United Kingdom
- Belgium
- Netherlands
- Turkey
Asia Pacific
- China
- Japan
- India
- Australia
- South Korea
- Thailand
- Malaysia
- Indonesia
- New Zealand
Latin America
- Brazil
- Mexico
- Argentina
Middle East & Africa
- South Africa
- Saudi Arabia
- UAE
All the Key players have been covered from 4 Viewpoints:
- Overview
- Key Persons
- Recent Development
- Revenue
Key Players Analysis
- John Deere's
- CNH Industrial
- AGCO Corporation
- KUBOTA Corporation
- Mahindra & Mahindra
- ClaasKGaAmbH
- Escorts Ltd.
- Titan Machinery Inc.
Report Details:
| Report Features | Details |
| Base Year |
2024 |
| Historical Period |
2020 - 2024 |
| Forecast Period |
2025 - 2033 |
| Market |
US$ Billion |
| Segment Covered |
Type, Engine Power, Application and Countries |
| Countries Covered |
|
| Companies Covered |
|
| Customization Scope |
20% Free Customization |
| Post-Sale Analyst Support |
1 Year (52 Weeks) |
| Delivery Format |
PDF and Excel through Email (We can also provide the editable version of the report in PPT/Word format on request) |
Key Questions Answered in This Report:
-
What is the estimated market value of the global agricultural tractor market in 2024?
-
What is the projected CAGR of the agricultural tractor market from 2025 to 2033?
-
What are the key factors driving the growth of the agricultural tractor market?
-
How are technological innovations, such as GPS and AI, impacting the tractor industry?
-
What role do government subsidies play in increasing tractor adoption in developing countries?
-
What are the major challenges faced by the global agricultural tractor market?
-
Which horsepower segment is most popular among small and medium-scale farmers?
-
How is the demand for electric and autonomous tractors shaping the future of the industry?
-
Which countries are expected to experience significant growth in tractor sales?
-
Who are the key players in the global agricultural tractor market?
Customization Services available
- Analysis of Market Size and Its Segments
- More Company Profiles (Upto 10 without any additional cost):
- Additional Countries (Other than mentioned Countries):
- Region/Country Specific Reports:
- Market Entry Strategy:
- Region-Specific Market Dynamics:
- Regional Market Share Analysis:
- Trade Analysis:
- Production Insights:
- Others Customized Requests:
For more information contact our analysts.
Need More Assistance?
- Talk to our analysts to get more precious information on the current market trends.
- Include more countries and segments and customize the report based on the final requirement.
- Get a competitive advantage in your industry by knowing the report findings and making a positive impact on your revenues and operations.
- Our analysts are always ready to provide more help and pertinent information if you need any additional assistance.