1 Introduction
2 Research & Methodology
3 Executive Summary
4 Global Native Starch Market
5 Market Share Analysis – Global Native Starch
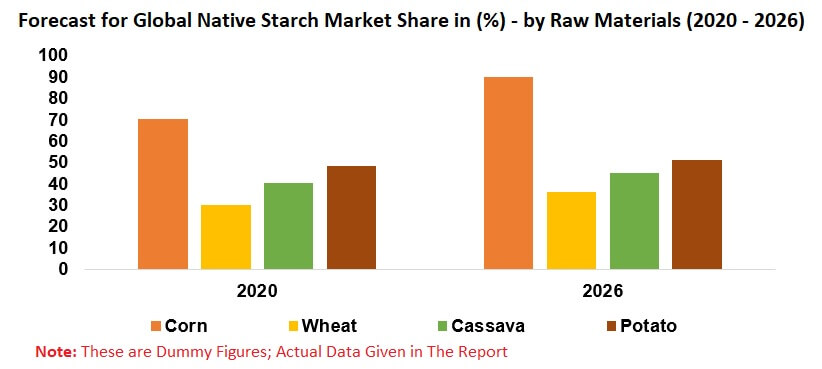
5.1 By Raw Material
5.2 By Region
6 Production Share Analysis – Global Native Starch
6.1 By Raw Materials
6.2 By Region
7 Industry Consumption Share Analysis – Global Native Starch
8 By Raw Materials – Global Native Starch Market
8.1 Corn
8.2 Wheat
8.3 Cassava
8.4 Potato
9 America - Native Starch Market
9.1 Raw Materials Market Share Analysis
9.2 By Raw Materials
9.2.1 Corn
9.2.2 Wheat
9.2.3 Cassava
9.2.4 Potato
10 Europe - Native Starch Market
10.1 By Raw Materials – Market Share Analysis
10.2 By Raw Materials
10.2.1 Corn
10.2.2 Wheat
10.2.3 Potato
11 Asia-Pacific - Native Starch Market
11.1 By Raw Materials – Market Share Analysis
11.2 By Raw Materials
11.2.1 Corn
11.2.2 Wheat
11.2.3 Cassava
11.2.4 Potato
12 Rest of the World - Native Starch Market
12.1 By Raw Materials – Market Share Analysis
12.2 By Raw Materials
12.2.1 Corn
12.2.2 Wheat
12.2.3 Cassava
12.2.4 Potato
13 By Industry Consumption – Global Native Starch
13.1 Confectionery and Drinks
13.2 Processed food
13.3 Corrugating and Paper Making
13.4 Feed
13.5 Pharma and Chemicals
13.6 Other non-food
14 Global Native Starch Production
15 By Raw materials – Global Native Starch Production
15.1 Corn
15.2 Wheat
15.3 Cassava
15.4 Potato
16 Americas - Native Starch Production
16.1 By Raw Materials – Production Share Analysis
16.2 By Raw Materials
16.2.1 Corn
16.2.2 Wheat
16.2.3 Cassava
16.2.4 Potato
17 Europe - Native Starch Production
17.1 By Raw Materials – Production Share Analysis
17.2 By Raw Materials
17.2.1 Corn
17.2.2 Wheat
17.2.3 Potato
18 Asia-Pacific - Native Starch Production
18.1 By Raw Materials – Production Share Analysis
18.2 By Raw Materials
18.2.1 Corn
18.2.2 Wheat
18.2.3 Cassava
18.2.4 Potato
19 Rest of World - Native Starch Production
19.1 By Raw Materials – Production Share Analysis
19.2 By Raw Materials
19.2.1 Corn
19.2.2 Wheat
19.2.3 Cassava
19.2.4 Potato
20 Processing Process
20.1 Starch Value Chain
20.2 Corn Starch Production Process
20.3 Wheat Starch Production Process
20.4 Cassava Starch Production Process
20.5 Potato Starch Production Process
21 Key Players – Financial Insights
21.1 Cargill
21.1.1 Overview
21.1.2 Recent Development
21.1.3 Revenue
21.2 Ingredion
21.2.1 Overview
21.2.2 Recent Development
21.2.3 Revenue
21.3 Archer Daniels Midland Company
21.3.1 Overview
21.3.2 Recent Development
21.3.3 Revenue
21.4 Tate & Lyle
21.4.1 Overview
21.4.2 Recent Development
21.4.3 Revenue
22 Growth Drivers
22.1 Point no. 1
22.2 Point no. 2
22.3 Point no. 3
23 Restraints
23.1 Point no. 1
24 Appendix
List of Figures:
Figure 4‑1: Global Native Starch Market (Million US$), 2014 - 2019
Figure 4‑2: Forecast for Global Native Starch Market (Million US$), 2020 - 2026
Figure 5‑1: By Raw Material - Global Native Starch Market Share (%), 2014-2019
Figure 5‑2: By Raw Material – Forecast for Global Native Starch Market Share (%), 2020 - 2026
Figure 5‑3: By Region - Global Native Starch Market Share (%), 2014 – 2019
Figure 5‑4: By Region – Forecast for Global Native Starch Market Share (%), 2020 – 2026
Figure 6‑1: By Raw Materials - Global Native Starch Production Share (%), 2014 – 2019
Figure 6‑2: By Raw Materials – Forecast for Global Native Starch Production Share (%), 2020 – 2026
Figure 6‑3: By Region - Global Native Starch Production Share (%), 2014 – 2019
Figure 6‑4: By Region – Forecast for Global Native Starch Production Share (%), 2020 – 2026
Figure 8‑1: Global – Native Corn Starch Market (Million US$), 2014 – 2019
Figure 8‑2: Global – Forecast for Native Corn Starch Market (Million US$), 2020 – 2026
Figure 8‑3: Global – Native Wheat Starch Market (Million US$), 2014 – 2019
Figure 8‑4: Global – Forecast for Native Wheat Starch Market (Million US$), 2020 – 2026
Figure 8‑5: Global - Native Cassava Starch Market (Million US$), 2014 – 2019
Figure 8‑6: Global – Forecast for Native Cassava Starch Market (Million US$), 2020 – 2026
Figure 8‑7: Global – Native Potato Starch Market (Million US$), 2014 – 2019
Figure 8‑8: Global – Forecast for Native Potato Starch Market (Million US$), 2020 – 2026
Figure 9‑1: Americas - Native Starch Market (Million US$), 2014 - 2019
Figure 9‑2: Americas – Forecast for Native Starch Market (Million US$), 2020 – 2026
Figure 9‑3: Americas - Native Starch Raw Materials Market Share (%), 2014 - 2019
Figure 9‑4: Americas – Forecast for Native Starch Raw Materials Market Share (%), 2020 - 2026
Figure 9‑5: Americas –Native Corn Starch Market (Million US$), 2014 - 2019
Figure 9‑6: Americas – Forecast for Native Corn Starch Market (Million US$), 2020 - 2026
Figure 9‑7: Americas –Native Wheat Starch Market (Million US$), 2014 - 2019
Figure 9‑8: Americas – Forecast for Native Wheat Starch Market (Million US$), 2020 - 2026
Figure 9‑9: Americas –Native Cassava Starch Market (Million US$), 2014 – 2019
Figure 9‑10: Americas – Forecast for Native Cassava Starch Market (Million US$), 2020 – 2026
Figure 9‑11: Americas – Native Potato Starch Market (Million US$), 2014 – 2019
Figure 9‑12: Americas – Forecast for Native Potato Starch Market (Million US$), 2020 – 2026
Figure 10‑1: Europe - Native Starch Market (Million US$), 2014 - 2019
Figure 10‑2: Europe – Forecast for Native Starch Market (Million US$), 2020 – 2026
Figure 10‑3: Europe - Native Starch Raw Materials Market Share (%), 2014 – 2019
Figure 10‑4: Europe – Forecast for Native Starch Raw Materials Market Share (%), 2020 – 2026
Figure 10‑5: Europe –Native Corn Starch Market (Million US$), 2014 – 2019
Figure 10‑6: Europe – Forecast for Native Corn Starch Market (Million US$), 2020 – 2026
Figure 10‑7: Europe –Native Wheat Starch Market (Million US$), 2014 – 2016
Figure 10‑8: Europe – Forecast for Native Wheat Starch Market (Million US$), 2020 – 2026
Figure 10‑9: Europe –Native Potato Starch Market (Million US$), 2014 – 2019
Figure 10‑10: Europe – Forecast for Native Potato Starch Market (Million US$), 2020 – 2026
Figure 11‑1: Asia-Pacific - Native Starch Market (Million US$), 2014 - 2019
Figure 11‑2: Asia-Pacific – Forecast for Native Starch Market (Million US$), 2020 – 2026
Figure 11‑3: Asia-Pacific - Native Starch Raw Materials Market Share (%), 2014 – 2019
Figure 11‑4: Asia-Pacific – Forecast for Native Starch Raw Materials Market Share (%), 2020 – 2026
Figure 11‑5: Asia-Pacific –Native Corn Starch Market (Million US$), 2014 – 2019
Figure 11‑6: Asia-Pacific – Forecast for Native Corn Starch Market (Million US$), 2020– 2026
Figure 11‑7: Asia-Pacific –Native Wheat Starch Market (Million US$), 2014 – 2019
Figure 11‑8: Asia-Pacific – Forecast for Native Wheat Starch Market (Million US$), 2020 – 2026
Figure 11‑9: Asia-Pacific –Native Cassava Starch Market (Million US$), 2014 – 2019
Figure 11‑10: Asia-Pacific – Forecast for Native Cassava Starch Market (Million US$), 2020 – 2026
Figure 11‑11: Asia-Pacific –Native Potato Starch Market (Million US$), 2014 – 2019
Figure 11‑12: Asia-Pacific – Forecast for Native Potato Starch Market (Million US$), 2020 – 2026
Figure 12‑1: ROW - Native Starch Market (Million US$), 2014 - 2019
Figure 12‑2: ROW – Forecast for Native Starch Market (Million US$), 2020 – 2026
Figure 12‑3: ROW - Native Starch Raw Materials Market Share (%), 2014 – 2019
Figure 12‑4: ROW – Forecast for Native Starch Raw Materials Market Share (%), 2020 – 2026
Figure 12‑5: ROW –Native Corn Starch Market (Million US$), 2014 – 2019
Figure 12‑6: ROW – Forecast for Native Corn Starch Market (Million US$), 2020 – 2026
Figure 12‑7: ROW – Native Wheat Starch Market (Million US$), 2014 – 2019
Figure 12‑8: ROW – Forecast for Native Wheat Starch Market (Million US$), 2020 – 2026
Figure 12‑9: ROW –Native Cassava Starch Market (Million US$), 2014 – 2019
Figure 12‑10: ROW – Forecast for Native Cassava Starch Market (Million US$), 2020 – 2026
Figure 12‑11: ROW –Native Potato Starch Market (Million US$), 2014 – 2019
Figure 12‑12: ROW – Forecast for Native Potato Starch Market (Million US$), 2020 – 2026
Figure 13‑1: Confectionery and Drinks – Native Starch Consumption (Million Tonnes), 2014 - 2019
Figure 13‑2: Confectionery and Drinks – Forecast for Native Starch Consumption (Million Tonnes), 2020 – 2026
Figure 13‑3: Processed Food – Native Starch Consumption (Million Tonnes), 2014 - 2019
Figure 13‑4: Processed Food – Forecast for Native Starch Consumption (Million Tonnes), 2020 – 2026
Figure 13‑5: Corrugating & Paper Making – Native Starch Consumption (Million Tonnes), 2014 – 2019
Figure 13‑6: Corrugating & Paper Making – Forecast for Native Starch Consumption (Million Tonnes), 2020 – 2026
Figure 13‑7: Feed – Native Starch Consumption (Million Tonnes), 2014 – 2019
Figure 13‑8: Feed – Forecast for Native Starch Consumption (Million Tonnes), 2020 – 2026
Figure 13‑9: Pharma & Chemicals – Native Starch Consumption (Million Tonnes), 2014 – 2019
Figure 13‑10: Pharma & Chemicals – Forecast for Native Starch Consumption (Million Tonnes), 2020 – 2026
Figure 13‑11: Other non-food – Native Starch Consumption (Million Tonnes), 2014 – 2019
Figure 13‑12: Other non-food – Forecast for Native Starch Consumption (Million Tonnes), 2020 – 2026
Figure 14‑1: Starch Production Process
Figure 14‑2: Global Native Starch Production (Million Tonnes), 2014 - 2019
Figure 14‑3: Forecast for Global Native Starch Production (Million Tonnes), 2020 - 2026
Figure 15‑1: Global - Native Corn Starch Production (Million Tonnes), 2014 – 2019
Figure 15‑2: Global – Forecast for Native Corn Starch Production (Million Tonnes), 2020 – 2026
Figure 15‑3: Global - Native Wheat Starch Production (Million Tonnes), 2014 – 2019
Figure 15‑4: Global – Forecast for Native Wheat Starch Production (Million Tonnes), 2020 – 2026
Figure 15‑5: Global - Native Cassava Starch Production (Million Tonnes), 2014 – 2019
Figure 15‑6: Global – Forecast for Native Cassava Starch Production (Million Tonnes), 2020 – 2026
Figure 15‑7: Global – Native Potato Starch Production (Million Tonnes), 2014 – 2019
Figure 15‑8: Global – Forecast for Native Potato Starch Production (Million Tonnes), 2020 – 2026
Figure 16‑1: Americas - Native Starch Production (Million Tonnes), 2014 - 2019
Figure 16‑2: Americas – Forecast for Native Starch Production (Million Tonnes), 2020 - 2026
Figure 16‑3: Americas - Native Starch Raw Materials Production Share (%), 2014 – 2019
Figure 16‑4: Americas – Forecast for Native Starch Raw Materials Production Share (%), 2020 – 2026
Figure 16‑5: Americas – Native Corn Starch Production (Million Tonnes), 2014 – 2019
Figure 16‑6: Americas – Forecast for Native Corn Starch Production (Million Tonnes), 2020 – 2026
Figure 16‑7: Americas – Native Wheat Starch Production (Million Tonnes), 2014 – 2019
Figure 16‑8: Americas – Forecast for Native Wheat Starch Production (Million Tonnes), 2020 – 2026
Figure 16‑9: Americas – Native Cassava Starch Production (Million Tonnes), 2014 – 2019
Figure 16‑10: Americas – Forecast for Native Cassava Starch Production (Million Tonnes), 2020 – 2026
Figure 16‑11: Americas – Native Potato Starch Production (Million Tonnes), 2014 – 2019
Figure 16‑12: Americas – Forecast for Native Potato Starch Production (Million Tonnes), 2020 – 2026
Figure 17‑1: Europe - Native Starch Production (Million Tonnes), 2014 - 2019
Figure 17‑2: Europe – Forecast for Native Starch Production (Million Tonnes), 2020 - 2026
Figure 17‑3: Europe - Native Starch Raw Materials Production Share (%), 2014 – 2019
Figure 17‑4: Europe – Forecast for Native Starch Raw Materials Production Share (%), 2020 – 2026
Figure 17‑5: Europe – Native Corn Starch Production (Million Tonnes), 2014– 2019
Figure 17‑6: Europe – Forecast for Native Corn Starch Production (Million Tonnes), 2020 – 2026
Figure 17‑7: Europe – Native Wheat Starch Production (Million Tonnes), 2014 – 2019
Figure 17‑8: Europe – Forecast for Native Wheat Starch Production (Million Tonnes), 2020 – 2026
Figure 17‑9: Europe – Native Potato Starch Production (Million Tonnes), 2014 – 2019
Figure 17‑10: Europe – Forecast for Native Potato Starch Production (Million Tonnes), 2020 – 2026
Figure 18‑1: Asia-Pacific - Native Starch Production (Million Tonnes), 2014 - 2019
Figure 18‑2: Asia-Pacific – Forecast for Native Starch Production (Million Tonnes), 2020 – 2026
Figure 18‑3: Asia-Pacific - Native Starch Raw Materials Production Share (%), 2014 – 2019
Figure 18‑4: Asia-Pacific – Forecast for Native Starch Raw Materials Production Share (%), 2020 – 2026
Figure 18‑5: Asia-Pacific – Native Corn Starch Production (Million Tonnes), 2014 – 2019
Figure 18‑6: Asia-Pacific – Forecast for Native Corn Starch Production (Million Tonnes), 2020 – 2026
Figure 18‑7: Asia-Pacific – Native Wheat Starch Production (Million Tonnes), 2014 – 2019
Figure 18‑8: Asia-Pacific – Forecast for Native Wheat Starch Production (Million Tonnes), 2020 – 2026
Figure 18‑9: Asia-Pacific – Native Cassava Starch Production (Million Tonnes), 2014 – 2019
Figure 18‑10: Asia-Pacific – Forecast for Native Cassava Starch Production (Million Tonnes), 2020 – 2026
Figure 18‑11: Asia-Pacific – Native Potato Starch Production (Million Tonnes), 2014 – 2019
Figure 18‑12: Asia-Pacific – Forecast for Native Potato Starch Production (Million Tonnes), 2020 – 2026
Figure 19‑1: ROW - Native Starch Production (Million Tonnes), 2014 - 2019
Figure 19‑2: ROW – Forecast for Native Starch Production (Million Tonnes), 2020 - 2026
Figure 19‑3: ROW - Native Starch Raw Materials Production Share (%), 2014 – 2019
Figure 19‑4: ROW – Forecast for Native Starch Raw Materials Production Share (%), 2020 – 2026
Figure 19‑5: ROW – Native Corn Starch Production (Million Tonnes), 2014 – 2019
Figure 19‑6: ROW – Forecast for Native Corn Starch Production (Million Tonnes), 2020 – 2026
Figure 19‑7: ROW – Native Wheat Starch Production (Million Tonnes), 2014 – 2019
Figure 19‑8: ROW – Forecast for Native Wheat Starch Production (Million Tonnes), 2020 – 2026
Figure 19‑9: ROW – Native Cassava Starch Production (Million Tonnes), 2014 – 2019
Figure 19‑10: ROW – Forecast for Native Cassava Starch Production (Million Tonnes), 2020 – 2026
Figure 19‑11: ROW – Native Potato Starch Production (Million Tonnes), 2014 – 2019
Figure 19‑12: ROW – Forecast for Native Potato Starch Production (Million Tonnes), 2020 – 2026
Figure 20‑1: Starch Raw Materials Value Chain
Figure 20‑2: Corn Starch Production Process
Figure 20‑3: Wheat Starch Production Process
Figure 20‑4: Cassava Starch Production Process
Figure 20‑5: Potato Starch Production Process
Figure 21‑1: Cargill – Net Revenue (Million US$), 2014 – 2019
Figure 21‑2: Cargill – Forecast for Net Revenue (Million US$), 2020 – 2026
Figure 21‑3: Ingredion – Net Sales (Million US$), 2014 – 2019
Figure 21‑4: Ingredion – Forecast for Net Sales (Million US$), 2020 – 2026
Figure 21‑5: ADM – Net Revenue (Million US$), 2011 – 2019
Figure 21‑6: ADM – Forecast for Net Revenue (Million US$), 2020 – 2026
Figure 21‑7: Tate & Lyle – Net Sales (Million US$), 2014 – 2019
Figure 21‑8: Tate & Lyle – Forecast for Net Sales (Million US$), 2020 – 2026
List of Table:
Table 7‑1: By Industry – Global Native Starch Consumption Share (%), 2014 – 2019
Table 7‑2: By Industry – Forecast for Global Native Starch Consumption Share (%), 2020 – 2026