Renub

    Asia-Pacific Condom Market Forecast 2021-2030, Industry Trends, Share, Insight, Growth, Impact of COVID-19, Opportunity Key Players Analysis

    Excel: 12 Hours
    PDF: 24 Hours
    Oct 2021
    Pages: 240

    Get Free Customization in this Report

    Condoms play a pivotal role in contraception and preventing sexually transmitted diseases for safer sex and family planning. Dating back years, condoms have a long history, even before latex was not produced. Condoms are preferred due to their affordable price, easy to carry and use, and high reliability. Furthermore, male and female condoms are the only devices to protect against unplanned pregnancy and the transmission of STIs, including HIV and many more diseases. In earlier years, Male condom has dominated the market and will lead the market over the forecast time frame, but female condom has also gained momentum with time. Here in this report, we have only covered Male condom users and its market in Asia-Pacific regions. According to Renub Research, Asia-Pacific Condom Industry will grow with a CAGR of 3.74% from 2021 to 2030.


    Asia-Pacific Condom Industry


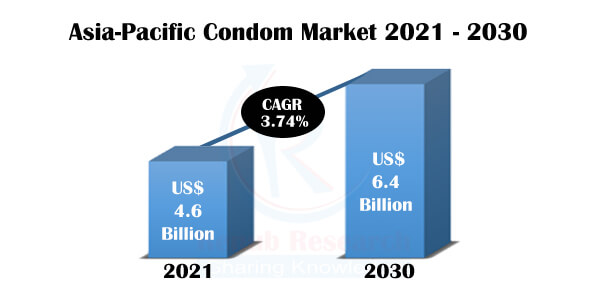
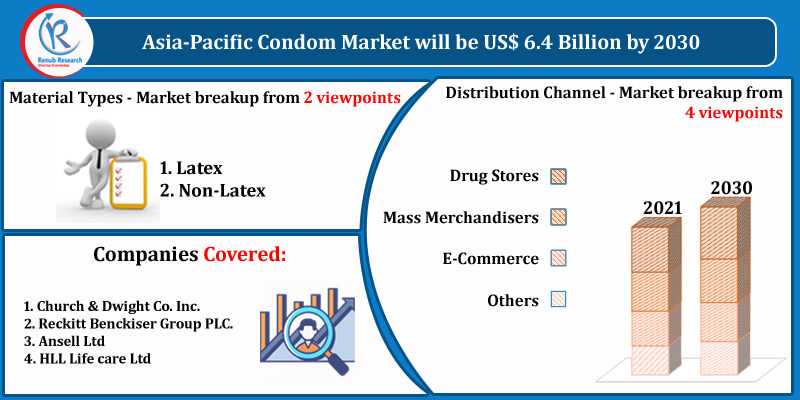
    Asia-Pacific Condom Market will be US$ 6.4 Billion by 2030.

    In the Asia-Pacific countries, most of the countries are not economically strong, and the efforts made by its government have been phenomenal in recent years. Countries like China, Japan and India are more developed among the rest of the Asia Pacific countries. Apart from that, awareness of contraception and prevention against HIV and condoms in these regions are strong. The numbers of condom pieces sold in these regions are exceptionally well and as our analysts suggest, it will surge over the period.


    Asia-Pacific Condom Market Size was valued US$ 4.6 Billion in the year 2021

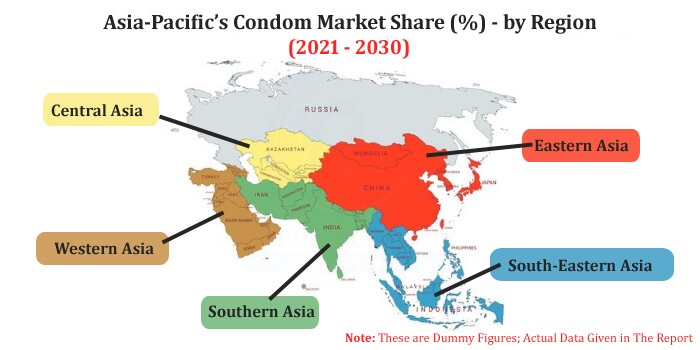
    By Region, in this report study, we have analyzed the countries and distinguished the Asia-Pacific condom market into Central Asia, Eastern Asia, Southern Asia, South-Eastern Asia and Western Asia. Among East Asian region like China and the Democratic People’s Republic of Korea market have shown pretty much impressive growth. Likewise, Southern Asian countries say India, Pakistan, Bangladesh, and the Afghanistan market for condom has shown growth inclination during the forecast period. The number of condom pieces sold in these regions has surged over time and will grow as per our analysts suggest.


    Latex Material Condoms controls the Lion’s Market Share

    Condoms made of latex material controls the lion’s market share in Asia Pacific region. Primary reason for this is latex material condoms are cheaper in price. But our analyst suggests that non-latex condoms will gain their market share in future. The factors driving the Asia- Pacific’s condom market are growing awareness about its benefits and its vast population base in the region. Apart from that sex education and protection against STDs, the introduction of innovative condom designs, coupled with innovative packaging style, promotional activities and increased marketing, are some of the other major factors boosting the market growth further.


    asia-pacific condom industry size


    COVID-19 Impact on Condom Industry of Asia Pacific

    During the COVID-19 pandemic, many key players’ condom sales were down due to lockdowns and social distancing norms. As such as per the BBC news report, the sale of Reckitt saw a sharp drop for condoms as people not only in Asian Pacific regions but whole world had less sex. In India also the condom sales dipped due to increased inaccessibility during the three-month lockdown in 2020. However, once the lockdown was over and vaccination procedure has been implemented effectively worldwide, we have seen a surge in sales of condoms and sex related products.


    Renub Research new report “Asia-Pacific’s Condom Market by Materials (Latex & Non- Latex), Distribution Channels (Drugs Stores, Mass Merchandisers, E-commerce & Others), Regions {(Central Asia- Kyrgyzstan, Tajikistan, Turkmenistan, Uzbekistan), Region (Central Asia [Kyrgyzstan, Tajikistan, Turkmenistan, Uzbekistan], Eastern Asia [China, Democratic People's Republic of Korea], Southern Asia [Afghanistan, Bangladesh, India, Nepal, Pakistan], South-Eastern Asia [Cambodia, Indonesia, Lao People's Democratic Republic, Myanmar, Philippines, Vietnam], Western Asia [Azerbaijan, Iraq, Yemen]), Key Players (Church & Dwight Co. Inc., Reckitt Benckiser Group PLC., Ansell Ltd, HLL Life care Ltd)" provides complete insight on Asia-Pacific Condom Industry.


    Asia-Pacific Condom Analysis

    1.    Market
    2.    Users


    Material Types - Market breakup from 2 viewpoints

    1.    Latex
    2.    Non-Latex


    Distribution Channel - Market breakup from 4 viewpoints

    1.    Drug Stores
    2.    Mass Merchandisers
    3.    E-Commerce
    4.    Others


    Asia-Pacific Condom Market


    Region - Market & Volume breakup 5 Regions with 20 countries

    1.    Central Asia

    a.    Kyrgyzstan
    b.    Tajikistan
    c.    Turkmenistan
    d.    Uzbekistan

    2.    Eastern Asia

    a.    China
    b.    Democratic People's Republic of Korea

    3.    Southern Asia

    a.    Afghanistan
    b.    Bangladesh
    c.    India
    d.    Nepal
    e.    Pakistan

    4.    South-Eastern Asia

    a.    Cambodia
    b.    Indonesia
    c.    Lao People's Democratic Republic
    d.    Myanmar
    e.    Philippines
    f.    Vietnam

    5.    Western Asia

    a.    Azerbaijan
    b.    Iraq
    c.    Yemen


    All the Key players have been covered from 3 viewpoints

    •    Overviews
    •    Recent Developments
    •    Revenues


    Key Players

    1.    Church & Dwight Co. Inc.
    2.    Reckitt Benckiser Group PLC.
    3.    Ansell Ltd
    4.    HLL Life care Ltd


    Report Details:

    Report Features Details
    Base Year 2021
    Historical Period 2016 - 2021
    Forecast Period 2022-2030
    Market US$ Billion
    Segment Covered Material Types, Distribution Channel, Region
    Region Covered Central Asia, Eastern Asia , Southern Asia, South-Eastern Asia, Western Asia
    Companies Covered Church & Dwight Co. Inc., Reckitt Benckiser Group PLC., Ansell Ltd, HLL Life care Ltd
    Customization Scope 20% Free Customization
    Post-Sale Analyst Support 1 Year (52 Weeks)
    Delivery Format PDF and Excel through Email (We can also provide the editable version of the report in PPT/Word format on request)

    1.    Introduction

    2.    Research Methodology
    3.    Executive Summary

    4.    Market Dynamics

    4.1    Growth Drivers
    4.2    Challenges


    5.    Asia-Pacific Condom Analysis

    5.1    Market
    5.2    Users


    6.    Market Share – Asia-Pacific Condom Analysis

    6.1    Material
    6.2    Distribution Channel


    7.    Material – Asia-Pacific Condom Market

    7.1    Latex
    7.2    Non-Latex


    8.    Distribution Channel – Asia-Pacific Condom Market

    8.1    Drug Stores
    8.2    Mass Merchandisers
    8.3    E-Commerce
    8.4    Others


    9.    Central Asia – Condom Market & Volume

    9.1    Kyrgyzstan

    9.1.1    Market
    9.1.2    Volume

    9.2    Tajikistan

    9.2.1    Market
    9.2.2    Volume

    9.3    Turkmenistan

    9.3.1    Market
    9.3.2    Volume

    9.4    Uzbekistan

    9.4.1    Market
    9.4.2    Volume


    10.    Eastern Asia – Condom Market & Volume

    10.1    China

    10.1.1    Market
    10.1.2    Volume

    10.2    South Korea

    10.2.1    Market
    10.2.2    Volume

    10.3    Southern Asia

    10.3.1    Afghanistan
    10.3.2    Market
    10.3.3    Volume

    10.4    Bangladesh

    10.4.1    Market
    10.4.2    Volume

    10.5    India

    10.5.1    Market
    10.5.2    Volume

    10.6    Nepal

    10.6.1    Market
    10.6.2    Volume

    10.7    Pakistan

    10.7.1    Market
    10.7.2    Volume


    11.    South-Eastern Asia – Condom Market & Volume

    11.1    Cambodia

    11.1.1    Market
    11.1.2    Volume

    11.2    Indonesia

    11.2.1    Market
    11.2.2    Volume

    11.3    Lao People's Democratic Republic

    11.3.1    Market
    11.3.2    Volume

    11.4    Myanmar

    11.4.1    Market
    11.4.2    Volume

    11.5    Philippines

    11.5.1    Market
    11.5.2    Volume

    11.6    Vietnam

    11.6.1    Market
    11.6.2    Volume


    12.    Western Asia – Condom Market & Volume

    12.1    Azerbaijan

    12.1.1    Market
    12.1.2    Volume

    12.2    Iraq

    12.2.1    Market
    12.2.2    Volume

    12.3    Yemen

    12.3.1    Market
    12.3.2    Volume


    13.    Company Analysis

    13.1    Church & Dwight Co. Inc.

    13.1.1    Overviews
    13.1.2    Recent Developments
    13.1.3    Revenues

    13.2    Reckitt Benckiser Group PLC.

    13.2.1    Overviews
    13.2.2    Recent Developments
    13.2.3    Revenues

    13.3    Ansell Ltd

    13.3.1    Overviews
    13.3.2    Recent Developments
    13.3.3    Revenues

    13.4    HLL Life care Ltd

    13.4.1    Overviews
    13.4.2    Recent Developments
    13.4.3    Revenues


    List Of Figures:

    Figure-01:        Asia-Pacific Condom Market (Million US$), 2016 – 2021
    Figure-02:        Forecast for – Asia-Pacific Condom Market (Million US$), 2022 – 2030
    Figure-03:        Asia-Pacific Condom Pieces Sold (Million), 2016 – 2021
    Figure-04:        Forecast for – Asia-Pacific Condom Pieces Sold (Million), 2022 – 2030
    Figure-05:        Material – Latex Market (Million US$), 2016 – 2021
    Figure-06:        Material – Forecast for Latex Market (Million US$), 2022 – 2030
    Figure-07:        Material – Non-Latex Market (Million US$), 2016 – 2021
    Figure-08:        Material – Forecast for Non-Latex Market (Million US$), 2022 – 2030
    Figure-09:        Distribution Channel – Drug Stores Market (Million US$), 2016 – 2021
    Figure-10:        Distribution Channel – Forecast for Drug Stores Market (Million US$), 2022 – 2030
    Figure-11:        Distribution Channel – Mass Merchandisers Market (Million US$), 2016 – 2021
    Figure-12:        Distribution Channel – Forecast for Mass Merchandisers Market (Million US$), 2022 – 2030
    Figure-13:        Distribution Channel – E-Commerce Market (Million US$), 2016 – 2021
    Figure-14:        Distribution Channel – Forecast for E-Commerce Market (Million US$), 2022 – 2030
    Figure-15:        Distribution Channel – Others Market (Million US$), 2016 – 2021
    Figure-16:        Distribution Channel – Forecast for Others Market (Million US$), 2022 – 2030
    Figure-17:        Kyrgyzstan – Condom Market (Million US$), 2016 – 2021
    Figure-18:        Kyrgyzstan – Forecast for Condom Market (Million US$), 2022 – 2030
    Figure-19:        Kyrgyzstan – Condom Pieces Sold (Million), 2016 – 2021
    Figure-20:        Kyrgyzstan – Forecast for Condom Pieces Sold (Million), 2022 – 2030
    Figure-21:        Tajikistan – Condom Market (Million US$), 2016 – 2021
    Figure-22:        Tajikistan – Forecast for Condom Market (Million US$), 2022 – 2030
    Figure-23:        Tajikistan – Condom Pieces Sold (Million), 2016 – 2021
    Figure-24:        Tajikistan – Forecast for Condom Pieces Sold (Million), 2022 – 2030
    Figure-25:        Turkmenistan – Condom Market (Million US$), 2016 – 2021
    Figure-26:        Turkmenistan – Forecast for Condom Market (Million US$), 2022 – 2030
    Figure-27:        Turkmenistan – Condom Pieces Sold (Million), 2016 – 2021
    Figure-28:        Turkmenistan – Forecast for Condom Pieces Sold (Million), 2022 – 2030
    Figure-29:        Uzbekistan – Condom Market (Million US$), 2016 – 2021
    Figure-30:        Uzbekistan – Forecast for Condom Market (Million US$), 2022 – 2030
    Figure-31:        Uzbekistan – Condom Pieces Sold (Million), 2016 – 2021
    Figure-32:        Uzbekistan – Forecast for Condom Pieces Sold (Million), 2022 – 2030
    Figure-33:        China – Condom Market (Million US$), 2016 – 2021
    Figure-34:        China – Forecast for Condom Market (Million US$), 2022 – 2030
    Figure-35:        China – Condom Pieces Sold (Million), 2016 – 2021
    Figure-36:        China – Forecast for Condom Pieces Sold (Million), 2022 – 2030
    Figure-37:        Democratic People's Republic of Korea – Condom Market (Million US$), 2016 – 2021
    Figure-38:        Democratic People's Republic of Korea – Forecast for Condom Market (Million US$), 2022 – 2030
    Figure-39:        Democratic People's Republic of Korea – Condom Pieces Sold (Million), 2016 – 2021
    Figure-40:        Democratic People's Republic of Korea – Forecast for Condom Pieces Sold (Million), 2022 – 2030
    Figure-41:        Afghanistan – Condom Market (Million US$), 2016 – 2021
    Figure-42:        Afghanistan – Forecast for Condom Market (Million US$), 2022 – 2030
    Figure-43:        Afghanistan – Condom Pieces Sold (Million), 2016 – 2021
    Figure-44:        Afghanistan – Forecast for Condom Pieces Sold (Million), 2022 – 2030
    Figure-45:        Bangladesh – Condom Market (Million US$), 2016 – 2021
    Figure-46:        Bangladesh – Forecast for Condom Market (Million US$), 2022 – 2030
    Figure-47:        Bangladesh – Condom Pieces Sold (Million), 2016 – 2021
    Figure-48:        Bangladesh – Forecast for Condom Pieces Sold (Million), 2022 – 2030
    Figure-49:        India – Condom Market (Million US$), 2016 – 2021
    Figure-50:        India – Forecast for Condom Market (Million US$), 2022 – 2030
    Figure-51:        India – Condom Pieces Sold (Million), 2016 – 2021
    Figure-52:        India – Forecast for Condom Pieces Sold (Million), 2022 – 2030
    Figure-53:        Nepal – Condom Market (Million US$), 2016 – 2021
    Figure-54:        Nepal – Forecast for Condom Market (Million US$), 2022 – 2030
    Figure-55:        Nepal – Condom Pieces Sold (Million), 2016 – 2021
    Figure-56:        Nepal – Forecast for Condom Pieces Sold (Million), 2022 – 2030
    Figure-57:        Pakistan – Condom Market (Million US$), 2016 – 2021
    Figure-58:        Pakistan – Forecast for Condom Market (Million US$), 2022 – 2030
    Figure-59:        Pakistan – Condom Pieces Sold (Million), 2016 – 2021
    Figure-60:        Pakistan – Forecast for Condom Pieces Sold (Million), 2022 – 2030
    Figure-61:        Cambodia – Condom Market (Million US$), 2016 – 2021
    Figure-62:        Cambodia – Forecast for Condom Market (Million US$), 2022 – 2030
    Figure-63:        Cambodia – Condom Pieces Sold (Million), 2016 – 2021
    Figure-64:        Cambodia – Forecast for Condom Pieces Sold (Million), 2022 – 2030
    Figure-65:        Indonesia – Condom Market (Million US$), 2016 – 2021
    Figure-66:        Indonesia – Forecast for Condom Market (Million US$), 2022 – 2030
    Figure-67:        Indonesia – Condom Pieces Sold (Million), 2016 – 2021
    Figure-68:        Indonesia – Forecast for Condom Pieces Sold (Million), 2022 – 2030
    Figure-69:        Lao People's Democratic Republic – Condom Market (Million US$), 2016 – 2021
    Figure-70:        Lao People's Democratic Republic – Forecast for Condom Market (Million US$), 2022 – 2030
    Figure-71:        Lao People's Democratic Republic – Condom Pieces Sold (Million), 2016 – 2021
    Figure-72:        Lao People's Democratic Republic – Forecast for Condom Pieces Sold (Million), 2022 – 2030
    Figure-73:        Myanmar – Condom Market (Million US$), 2016 – 2021
    Figure-74:        Myanmar – Forecast for Condom Market (Million US$), 2022 – 2030
    Figure-75:        Myanmar – Condom Pieces Sold (Million), 2016 – 2021
    Figure-76:        Myanmar – Forecast for Condom Pieces Sold (Million), 2022 – 2030
    Figure-77:        Philippines – Condom Market (Million US$), 2016 – 2021
    Figure-78:        Philippines – Forecast for Condom Market (Million US$), 2022 – 2030
    Figure-79:        Philippines – Condom Pieces Sold (Million), 2016 – 2021
    Figure-80:        Philippines – Forecast for Condom Pieces Sold (Million), 2022 – 2030
    Figure-81:        Viet Nam – Condom Market (Million US$), 2016 – 2021
    Figure-82:        Viet Nam – Forecast for Condom Market (Million US$), 2022 – 2030
    Figure-83:        Viet Nam – Condom Pieces Sold (Million), 2016 – 2021
    Figure-84:        Viet Nam – Forecast for Condom Pieces Sold (Million), 2022 – 2030
    Figure-85:        Azerbaijan – Condom Market (Million US$), 2016 – 2021
    Figure-86:        Azerbaijan – Forecast for Condom Market (Million US$), 2022 – 2030
    Figure-87:        Azerbaijan – Condom Pieces Sold (Million), 2016 – 2021
    Figure-88:        Azerbaijan – Forecast for Condom Pieces Sold (Million), 2022 – 2030
    Figure-89:        Iraq – Condom Market (Million US$), 2016 – 2021
    Figure-90:        Iraq – Forecast for Condom Market (Million US$), 2022 – 2030
    Figure-91:        Iraq – Condom Pieces Sold (Million), 2016 – 2021
    Figure-92:        Iraq – Forecast for Condom Pieces Sold (Million), 2022 – 2030
    Figure-93:        Yemen – Condom Market (Million US$), 2016 – 2021
    Figure-94:        Yemen – Forecast for Condom Market (Million US$), 2022 – 2030
    Figure-95:        Yemen – Condom Pieces Sold (Million), 2016 – 2021
    Figure-96:        Yemen – Forecast for Condom Pieces Sold (Million), 2022 – 2030
    Figure-97:        Church & Dwight Co. Inc. – Global Revenue (Million US$), 2016 – 2021
    Figure-98:        Church & Dwight Co. Inc. – Forecast for Global Revenue (Million US$), 2022 – 2030
    Figure-99:        Reckitt Benckiser Group PLC. – Global Revenue (Million US$), 2016 – 2021
    Figure-100:      Reckitt Benckiser Group PLC. – Forecast for Global Revenue (Million US$), 2022 – 2030
    Figure-101:      Ansell Ltd – Global Revenue (Million US$), 2016 – 2021
    Figure-102:      Ansell Ltd – Forecast for Global Revenue (Million US$), 2022 – 2030
    Figure-103:      HLL Life care Ltd – Global Revenue (Million US$), 2016 – 2021
    Figure-104:      HLL Life care Ltd – Forecast for Global Revenue (Million US$), 2022 – 2030


    List Of Tables:

    Table-1:        Asia-Pacific Condom Market (Million US$), 2016 – 2021
    Table-2:        Forecast for – Asia-Pacific Condom Market (Million US$), 2022 – 2030
    Table-3:        Asia-Pacific Condom Pieces Sold (Million), 2016 – 2021
    Table-4:        Forecast for – Asia-Pacific Condom Pieces Sold (Million), 2022 – 2030

    • Description
      Price
    • Chapter 1, 2, 3, 4 & 5     Pages : 15
      $1,000
    • Chapter 6     Pages : 7
      $900
    • Chapter 7     Pages : 7
      $500
    • Chapter 8     Pages : 14
      $600
    • Chapter 9     Pages : 26
      $700
    • Chapter 10     Pages : 45
      $800
    • Chapter 12     Pages : 20
      $700
    • Chapter 13.1     Pages : 5
      $150
    • Chapter 13.2     Pages : 5
      $150
    • Chapter 13.3     Pages : 5
      $150
    • Chapter 13.4     Pages : 5
      $150

    Related Reports