1. Introduction
2. Research Methodology
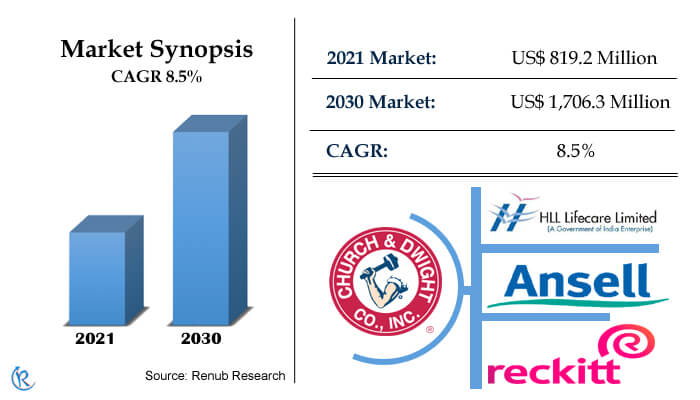
3. Executive Summary
4. Market Dynamics
4.1 Growth Drivers
4.2 Challenges
5. Africa Condom Analysis
5.1 Market
5.2 Users
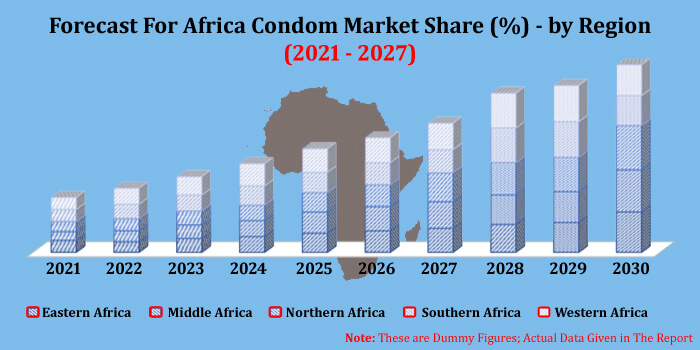
6. Market Share
6.1 Material
6.2 Distribution Channel
7. Eastern Africa – Condom Market & Volume
7.1 Burundi
7.1.1 Market
7.1.2 Volume
7.2 Comoros
7.2.1 Market
7.2.2 Volume
7.3 Eritrea
7.3.1 Market
7.3.2 Volume
7.4 Ethiopia
7.4.1 Market
7.4.2 Volume
7.5 Kenya
7.5.1 Market
7.5.2 Volume
7.6 Madagascar
7.6.1 Market
7.6.2 Volume
7.7 Malawi
7.7.1 Market
7.7.2 Volume
7.8 Mozambique
7.8.1 Market
7.8.2 Volume
7.9 Rwanda
7.9.1 Market
7.9.2 Volume
7.10 South Sudan
7.10.1 Market
7.10.2 Volume
7.11 Uganda
7.11.1 Market
7.11.2 Volume
7.12 United Republic of Tanzania
7.12.1 Market
7.12.2 Volume
7.13 Zambia
7.13.1 Market
7.13.2 Volume
7.14 Zimbabwe
7.14.1 Market
7.14.2 Volume
8. Middle Africa – Condom Market & Volume
8.1 Angola
8.1.1 Market
8.1.2 Volume
8.2 Cameroon
8.2.1 Market
8.2.2 Volume
8.3 Central African Republic
8.3.1 Market
8.3.2 Volume
8.4 Chad
8.4.1 Market
8.4.2 Volume
8.5 Congo
8.5.1 Market
8.5.2 Volume
8.6 Democratic Republic of the Congo
8.6.1 Market
8.6.2 Volume
8.7 Gabon
8.7.1 Market
8.7.2 Volume
9. Northern Africa – Condom Market & Volume
9.1 Egypt
9.1.1 Market
9.1.2 Volume
9.2 Morocco
9.2.1 Market
9.2.2 Volume
10. Southern Africa – Condom Market & Volume
10.1 Botswana
10.1.1 Market
10.1.2 Volume
10.2 Lesotho
10.2.1 Market
10.2.2 Volume
10.3 Namibia
10.3.1 Market
10.3.2 Volume
10.4 South Africa
10.4.1 Market
10.4.2 Volume
10.5 Swaziland
10.5.1 Market
10.5.2 Volume
11. Western Africa – Condom Market & Volume
11.1 Benin
11.1.1 Market
11.1.2 Volume
11.2 Burkina Faso
11.2.1 Market
11.2.2 Volume
11.3 Côte d'Ivoire
11.3.1 Market
11.3.2 Volume
11.4 Ghana
11.4.1 Market
11.4.2 Volume
11.5 Guinea
11.5.1 Market
11.5.2 Volume
11.6 Nigeria
11.6.1 Market
11.6.2 Volume
11.7 Senegal
11.7.1 Market
11.7.2 Volume
11.8 Togo
11.8.1 Market
11.8.2 Volume
12. Material – Africa Condom Market
12.1 Latex
12.2 Non-Latex
13. Distribution Channel – Africa Condom Market
13.1 Drug Stores
13.2 Mass Merchandisers
13.3 E-Commerce
13.4 Others
14. Porters Five Forces
14.1 Overview
14.2 Bargaining Power of Buyers
14.3 Bargaining Power of Suppliers
14.4 Degree of Competition
14.5 Threat of New Entrants
14.6 Threat of Substitutes
15. Company Analysis
15.1 Church & Dwight Co. Inc.
15.1.1 Overviews
15.1.2 Recent Developments
15.1.3 Revenues
15.2 Reckitt Benckiser Group PLC.
15.2.1 Overviews
15.2.2 Recent Developments
15.2.3 Revenues
15.3 Ansell Ltd
15.3.1 Overviews
15.3.2 Recent Developments
15.3.3 Revenues
15.4 HLL Life care Ltd
15.4.1 Overviews
15.4.2 Recent Developments
15.4.3 Revenues
List Of Figures:
Figure-01: Africa Condom Market (Million US$), 2016 – 2021
Figure-02: Forecast for – Africa Condom Market (Million US$), 2022 – 2030
Figure-03: Africa Condom Pieces Sold (Million), 2016 – 2021
Figure-04: Forecast for – Africa Condom Pieces Sold (Million), 2022 – 2030
Figure-05: Material – Latex Market (Million US$), 2016 – 2021
Figure-06: Material – Forecast for Latex Market (Million US$), 2022 – 2030
Figure-07: Material – Non-Latex Market (Million US$), 2016 – 2021
Figure-08: Material – Forecast for Non-Latex Market (Million US$), 2022 – 2030
Figure-09: Distribution Channel – Drug Stores Market (Million US$), 2016 – 2021
Figure-10: Distribution Channel – Forecast for Drug Stores Market (Million US$), 2022 – 2030
Figure-11: Distribution Channel – Mass Merchandisers Market (Million US$), 2016 – 2021
Figure-12: Distribution Channel – Forecast for Mass Merchandisers Market (Million US$), 2022 – 2030
Figure-13: Distribution Channel – E-Commerce Market (Million US$), 2016 – 2021
Figure-14: Distribution Channel – Forecast for E-Commerce Market (Million US$), 2022 – 2030
Figure-15: Distribution Channel – Others Market (Million US$), 2016 – 2021
Figure-16: Distribution Channel – Forecast for Others Market (Million US$), 2022 – 2030
Figure-17: Burundi – Condom Market (Million US$), 2016 – 2021
Figure-18: Burundi – Forecast for Condom Market (Million US$), 2022 – 2030
Figure-19: Burundi – Condom Pieces Sold (Million), 2016 – 2021
Figure-20: Burundi – Forecast for Condom Pieces Sold (Million), 2022 – 2030
Figure-21: Comoros – Condom Market (Million US$), 2016 – 2021
Figure-22: Comoros – Forecast for Condom Market (Million US$), 2022 – 2030
Figure-23: Comoros – Condom Pieces Sold (Million), 2016 – 2021
Figure-24: Comoros – Forecast for Condom Pieces Sold (Million), 2022 – 2030
Figure-25: Eritrea – Condom Market (Million US$), 2016 – 2021
Figure-26: Eritrea – Forecast for Condom Market (Million US$), 2022 – 2030
Figure-27: Eritrea – Condom Pieces Sold (Million), 2016 – 2021
Figure-28: Eritrea – Forecast for Condom Pieces Sold (Million), 2022 – 2030
Figure-29: Ethiopia – Condom Market (Million US$), 2016 – 2021
Figure-30: Ethiopia – Forecast for Condom Market (Million US$), 2022 – 2030
Figure-31: Ethiopia – Condom Pieces Sold (Million), 2016 – 2021
Figure-32: Ethiopia – Forecast for Condom Pieces Sold (Million), 2022 – 2030
Figure-33: Kenya – Condom Market (Million US$), 2016 – 2021
Figure-34: Kenya – Forecast for Condom Market (Million US$), 2022 – 2030
Figure-35: Kenya – Condom Pieces Sold (Million), 2016 – 2021
Figure-36: Kenya – Forecast for Condom Pieces Sold (Million), 2022 – 2030
Figure-37: Madagascar – Condom Market (Million US$), 2016 – 2021
Figure-38: Madagascar – Forecast for Condom Market (Million US$), 2022 – 2030
Figure-39: Madagascar – Condom Pieces Sold (Million), 2016 – 2021
Figure-40: Madagascar – Forecast for Condom Pieces Sold (Million), 2022 – 2030
Figure-41: Malawi – Condom Market (Million US$), 2016 – 2021
Figure-42: Malawi – Forecast for Condom Market (Million US$), 2022 – 2030
Figure-43: Malawi – Condom Pieces Sold (Million), 2016 – 2021
Figure-44: Malawi – Forecast for Condom Pieces Sold (Million), 2022 – 2030
Figure-45: Mozambique – Condom Market (Million US$), 2016 – 2021
Figure-46: Mozambique – Forecast for Condom Market (Million US$), 2022 – 2030
Figure-47: Mozambique – Condom Pieces Sold (Million), 2016 – 2021
Figure-48: Mozambique – Forecast for Condom Pieces Sold (Million), 2022 – 2030
Figure-49: Rwanda – Condom Market (Million US$), 2016 – 2021
Figure-50: Rwanda – Forecast for Condom Market (Million US$), 2022 – 2030
Figure-51: Rwanda – Condom Pieces Sold (Million), 2016 – 2021
Figure-52: Rwanda – Forecast for Condom Pieces Sold (Million), 2022 – 2030
Figure-53: South Sudan – Condom Market (Million US$), 2016 – 2021
Figure-54: South Sudan – Forecast for Condom Market (Million US$), 2022 – 2030
Figure-55: South Sudan – Condom Pieces Sold (Million), 2016 – 2021
Figure-56: South Sudan – Forecast for Condom Pieces Sold (Million), 2022 – 2030
Figure-57: Uganda – Condom Market (Million US$), 2016 – 2021
Figure-58: Uganda – Forecast for Condom Market (Million US$), 2022 – 2030
Figure-59: Uganda – Condom Pieces Sold (Million), 2016 – 2021
Figure-60: Uganda – Forecast for Condom Pieces Sold (Million), 2022 – 2030
Figure-61: United Republic of Tanzania – Condom Market (Million US$), 2016 – 2021
Figure-62: United Republic of Tanzania – Forecast for Condom Market (Million US$), 2022 – 2030
Figure-63: United Republic of Tanzania – Condom Pieces Sold (Million), 2016 – 2021
Figure-64: United Republic of Tanzania – Forecast for Condom Pieces Sold (Million), 2022 – 2030
Figure-65: Zambia – Condom Market (Million US$), 2016 – 2021
Figure-66: Zambia – Forecast for Condom Market (Million US$), 2022 – 2030
Figure-67: Zambia – Condom Pieces Sold (Million), 2016 – 2021
Figure-68: Zambia – Forecast for Condom Pieces Sold (Million), 2022 – 2030
Figure-69: Zimbabwe – Condom Market (Million US$), 2016 – 2021
Figure-70: Zimbabwe – Forecast for Condom Market (Million US$), 2022 – 2030
Figure-71: Zimbabwe – Condom Pieces Sold (Million), 2016 – 2021
Figure-72: Zimbabwe – Forecast for Condom Pieces Sold (Million), 2022 – 2030
Figure-73: Angola – Condom Market (Million US$), 2016 – 2021
Figure-74: Angola – Forecast for Condom Market (Million US$), 2022 – 2030
Figure-75: Angola – Condom Pieces Sold (Million), 2016 – 2021
Figure-76: Angola – Forecast for Condom Pieces Sold (Million), 2022 – 2030
Figure-77: Cameroon – Condom Market (Million US$), 2016 – 2021
Figure-78: Cameroon – Forecast for Condom Market (Million US$), 2022 – 2030
Figure-79: Cameroon – Condom Pieces Sold (Million), 2016 – 2021
Figure-80: Cameroon – Forecast for Condom Pieces Sold (Million), 2022 – 2030
Figure-81: Central African Republic – Condom Market (Million US$), 2016 – 2021
Figure-82: Central African Republic – Forecast for Condom Market (Million US$), 2022 – 2030
Figure-83: Central African Republic – Condom Pieces Sold (Million), 2016 – 2021
Figure-84: Central African Republic – Forecast for Condom Pieces Sold (Million), 2022 – 2030
Figure-85: Chad – Condom Market (Million US$), 2016 – 2021
Figure-86: Chad – Forecast for Condom Market (Million US$), 2022 – 2030
Figure-87: Chad – Condom Pieces Sold (Million), 2016 – 2021
Figure-88: Chad – Forecast for Condom Pieces Sold (Million), 2022 – 2030
Figure-89: Congo – Condom Market (Million US$), 2016 – 2021
Figure-90: Congo – Forecast for Condom Market (Million US$), 2022 – 2030
Figure-91: Congo – Condom Pieces Sold (Million), 2016 – 2021
Figure-92: Congo – Forecast for Condom Pieces Sold (Million), 2022 – 2030
Figure-93: Democratic Republic of the Congo – Condom Market (Million US$), 2016 – 2021
Figure-94: Democratic Republic of the Congo – Forecast for Condom Market (Million US$), 2022 – 2030
Figure-95: Democratic Republic of the Congo – Condom Pieces Sold (Million), 2016 – 2021
Figure-96: Democratic Republic of the Congo – Forecast for Condom Pieces Sold (Million), 2022 – 2030
Figure-97: Gabon – Condom Market (Million US$), 2016 – 2021
Figure-98: Gabon – Forecast for Condom Market (Million US$), 2022 – 2030
Figure-99: Gabon – Condom Pieces Sold (Million), 2016 – 2021
Figure-100: Gabon – Forecast for Condom Pieces Sold (Million), 2022 – 2030
Figure-101: Egypt – Condom Market (Million US$), 2016 – 2021
Figure-102: Egypt – Forecast for Condom Market (Million US$), 2022 – 2030
Figure-103: Egypt – Condom Pieces Sold (Million), 2016 – 2021
Figure-104: Egypt – Forecast for Condom Pieces Sold (Million), 2022 – 2030
Figure-105: Morocco – Condom Market (Million US$), 2016 – 2021
Figure-106: Morocco – Forecast for Condom Market (Million US$), 2022 – 2030
Figure-107: Morocco – Condom Pieces Sold (Million), 2016 – 2021
Figure-108: Morocco – Forecast for Condom Pieces Sold (Million), 2022 – 2030
Figure-109: Botswana – Condom Market (Million US$), 2016 – 2021
Figure-110: Botswana – Forecast for Condom Market (Million US$), 2022 – 2030
Figure-111: Botswana – Condom Pieces Sold (Million), 2016 – 2021
Figure-112: Botswana – Forecast for Condom Pieces Sold (Million), 2022 – 2030
Figure-113: Lesotho – Condom Market (Million US$), 2016 – 2021
Figure-114: Lesotho – Forecast for Condom Market (Million US$), 2022 – 2030
Figure-115: Lesotho – Condom Pieces Sold (Million), 2016 – 2021
Figure-116: Lesotho – Forecast for Condom Pieces Sold (Million), 2022 – 2030
Figure-117: Namibia – Condom Market (Million US$), 2016 – 2021
Figure-118: Namibia – Forecast for Condom Market (Million US$), 2022 – 2030
Figure-119: Namibia – Condom Pieces Sold (Million), 2016 – 2021
Figure-120: Namibia – Forecast for Condom Pieces Sold (Million), 2022 – 2030
Figure-121: South Africa – Condom Market (Million US$), 2016 – 2021
Figure-122: South Africa – Forecast for Condom Market (Million US$), 2022 – 2030
Figure-123: South Africa – Condom Pieces Sold (Million), 2016 – 2021
Figure-124: South Africa – Forecast for Condom Pieces Sold (Million), 2022 – 2030
Figure-125: Swaziland – Condom Market (Million US$), 2016 – 2021
Figure-126: Swaziland – Forecast for Condom Market (Million US$), 2022 – 2030
Figure-127: Swaziland – Condom Pieces Sold (Million), 2016 – 2021
Figure-128: Swaziland – Forecast for Condom Pieces Sold (Million), 2022 – 2030
Figure-129: Benin – Condom Market (Million US$), 2016 – 2021
Figure-130: Benin – Forecast for Condom Market (Million US$), 2022 – 2030
Figure-131: Benin – Condom Pieces Sold (Million), 2016 – 2021
Figure-132: Benin – Forecast for Condom Pieces Sold (Million), 2022 – 2030
Figure-133: Burkina Faso – Condom Market (Million US$), 2016 – 2021
Figure-134: Burkina Faso – Forecast for Condom Market (Million US$), 2022 – 2030
Figure-135: Burkina Faso – Condom Pieces Sold (Million), 2016 – 2021
Figure-136: Burkina Faso – Forecast for Condom Pieces Sold (Million), 2022 – 2030
Figure-137: Côte d'Ivoire – Condom Market (Million US$), 2016 – 2021
Figure-138: Côte d'Ivoire – Forecast for Condom Market (Million US$), 2022 – 2030
Figure-139: Côte d'Ivoire – Condom Pieces Sold (Million), 2016 – 2021
Figure-140: Côte d'Ivoire – Forecast for Condom Pieces Sold (Million), 2022 – 2030
Figure-141: Ghana – Condom Market (Million US$), 2016 – 2021
Figure-142: Ghana – Forecast for Condom Market (Million US$), 2022 – 2030
Figure-143: Ghana – Condom Pieces Sold (Million), 2016 – 2021
Figure-144: Ghana – Forecast for Condom Pieces Sold (Million), 2022 – 2030
Figure-145: Guinea – Condom Market (Million US$), 2016 – 2021
Figure-146: Guinea – Forecast for Condom Market (Million US$), 2022 – 2030
Figure-147: Guinea – Condom Pieces Sold (Million), 2016 – 2021
Figure-148: Guinea – Forecast for Condom Pieces Sold (Million), 2022 – 2030
Figure-149: Nigeria – Condom Market (Million US$), 2016 – 2021
Figure-150: Nigeria – Forecast for Condom Market (Million US$), 2022 – 2030
Figure-151: Nigeria – Condom Pieces Sold (Million), 2016 – 2021
Figure-152: Nigeria – Forecast for Condom Pieces Sold (Million), 2022 – 2030
Figure-153: Senegal – Condom Market (Million US$), 2016 – 2021
Figure-154: Senegal – Forecast for Condom Market (Million US$), 2022 – 2030
Figure-155: Senegal – Condom Pieces Sold (Million), 2016 – 2021
Figure-156: Senegal – Forecast for Condom Pieces Sold (Million), 2022 – 2030
Figure-157: Togo – Condom Market (Million US$), 2016 – 2021
Figure-158: Togo – Forecast for Condom Market (Million US$), 2022 – 2030
Figure-159: Togo – Condom Pieces Sold (Million), 2016 – 2021
Figure-160: Togo – Forecast for Condom Pieces Sold (Million), 2022 – 2030
Figure-161: Church & Dwight Co. Inc. – Global Revenue (Million US$), 2017 – 2021
Figure-162: Church & Dwight Co. Inc. – Forecast for Global Revenue (Million US$), 2022 – 2027
Figure-163: Reckitt Benckiser Group PLC. – Global Revenue (Million US$), 2017 – 2021
Figure-164: Reckitt Benckiser Group PLC. – Forecast for Global Revenue (Million US$), 2022 – 2027
Figure-165: Ansell Ltd – Global Revenue (Million US$), 2017 – 2021
Figure-166: Ansell Ltd – Forecast for Global Revenue (Million US$), 2022 – 2027
Figure-167: HLL Life care Ltd – Global Revenue (Million US$), 2017 – 2021
Figure-168: HLL Life care Ltd – Forecast for Global Revenue (Million US$), 2022 – 2027
List Of Tables:
Table-1: Africa – Condom Market Share by Material Type (Percent), 2016 – 2021
Table-2: Africa – Forecast for Condom Market Share by Material Type (Percent), 2022 – 2030
Table-3: Africa – Condom Market Share by Distribution Channel (Percent), 2016 – 2021
Table-4: Africa – Forecast for Condom Market Share by Distribution Channel (Percent), 2022 – 2030