
")
Spinal Muscular Atrophy Market, Global Forecast by Countries, Drugs (Spinraza, AVXS-101, CK2127107, RG7916, Olesoxime & LMI070) & Companies
Get Free Customization in This Report
Spinal muscular atrophy is a disease that causes muscle weakness which mostly appears in newborn children. Spinal muscular atrophy disease incidence of approximately 1 in 10,000 newborns and a prevalence of approximately 1 to 2 per 100,000 persons, globally. Spinal muscular atrophy is basically 4 types – Type 1, Type 2, Type 3 and Type 4. Most patients suffers with Spinal muscular atrophy type 1. According to Renub Research Global Spinal Muscular Atrophy (SMA) market is anticipated to grow at a CAGR of 14.29 percent in future. This double digit growth rate will happen due to expected launch of new drugs, better reimbursement options and decline in drugs prices.
Request a free sample copy of the report: https://www.renub.com/contactus.php
Spinal Muscular Atrophy (SMA) type 1 develop in less than 6 months of new born children in which patients are not in position to sit in their lifetime and normally they die within 6 months. In spinal muscular atrophy type 2, patients can sit but cannot walk. Type 2 is developed between 6-18 months of the new born children. Spinal muscular atrophy Type 3 patients can sit and walk and it developed when children age is less than 18 months. Spinal muscular atrophy Type 4 can develop during the adulthood.
Renub Research report titled “Spinal Muscular Atrophy Market Global Forecast by Countries (United States, United Kingdom, France, Germany, Spain, Italy & Japan), Drugs (Spinraza, AVXS-101, CK2127107, RG7916, Olesoxime & LMI070), Companies (Biogen Inc., Roche AG, Novartis AG, Cytokinetics Inc)” studies the global spinal muscular atrophy market and provides an all-encompassing analysis of the key growth drivers and challenges, market trends, key players and their projections for the future.
Spinal Muscular Atrophy Market New Drugs are expected to launch in recent years
At present only Biogen’s Spinraza is approved for the treatment of spinal muscular atrophy patients in the various parts of the globe such as United States, Europe, and Japan etc. Other companies are also working for new drugs development and they hope to enter in the market place very soon as their drugs are in Phase III clinical trials.
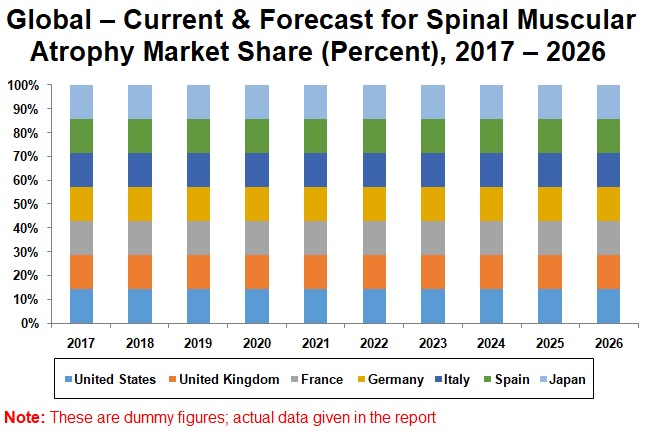
By Country - Market Segmentation
Spinal muscular atrophy market by country has been segmented into United States, United Kingdom, France, Germany, Spain, Italy and Japan. United States is a leading market place due to increasing number of treated Patients, favorable reimbursement policies and increase in healthcare expenditure.
By Total & Treated Patients - Population Segmentation
Spinal muscular atrophy Total & Treated Patients by country has been segmented into United States, United Kingdom, France, Germany, Spain, Italy and Japan. United States is dominating in the treated SMA patients globally.
By Drugs - Market Segmentation
The report by Renub Research studies the spinal muscular atrophy six drugs (Spinraza, AVXS-101, CK2127107, RG7916, Olesoxime & LMI070) details with present and estimated global sales.
The Report has been analyzed from 9 Major Viewpoints
1. Global Spinal Muscular Atrophy Market (Present & Forecast)
2. Global Spinal Muscular Atrophy Market Share, Patients Share, Treated Patients Share (Present & Forecast)
3. Country Spinal Muscular Atrophy Market (Present & Forecast)
4. Country Spinal Muscular Atrophy Patients Population (Present & Forecast)
5. Country Spinal Muscular Atrophy Treated Patients Population (Present & Forecast)
6. Spinal Muscular Atrophy Drugs Sales (Present & Forecast)
7. Global – Clinical Study on Spinal Muscular Atrophy & Drugs Pipeline
8. Growth Drivers and Challenges
9. Key Spinal Muscular Atrophy Companies Initiatives and Financial Insight
Client can purchase this report in sections through Purchase by Chapter Tab given above
Country Covered in this Report
• United States
• United Kingdom
• France
• Germany
• Italy
• Spain
• Japan
Drugs Details Covered in this Report
• Spinraza
• AVXS-101
• CK2127107
• RG7916
• Olesoxime
• LMI070
Company Covered in this Report
• Biogen Inc.
• Roche AG
• Novartis AG
• Cytokinetics Inc
If the information you seek is not included in the current scope of the study kindly share your specific requirements with our custom research team at info@renub.com
1. Introduction
1.1 Market Definition
1.2 Currency Conversion
2. Research Methodology
3. Executive Summary
4. Global Spinal Muscular Atrophy Market and Patients Analysis
4.1 Spinal Muscular Atrophy Market
4.2 Spinal Muscular Atrophy Patient Numbers
4.3 Spinal Muscular Atrophy Treated Patient Number
5. Share Analysis – Global Spinal Muscular Atrophy
5.1 Country Market Share
5.2 Patients Population Share
5.3 Treated Patients Share
6. United States
6.1 Spinal Muscular Atrophy Market
6.2 Spinal Muscular Atrophy Patient Numbers
6.3 Spinal Muscular Atrophy Treated Patients
7. United Kingdom
7.1 Spinal Muscular Atrophy Market
7.2 Spinal Muscular Atrophy Patient Numbers
7.3 Spinal Muscular Atrophy Treated Patient Numbers
8. Germany
8.1 Spinal Muscular Atrophy Market
8.2 Spinal Muscular Atrophy Patient Numbers
8.3 Spinal Muscular Atrophy Treated Patients
9. Italy – Spinal Muscular Atrophy
9.1 Spinal Muscular Atrophy Market
9.2 Spinal Muscular Atrophy Patient Numbers
9.3 Spinal Muscular Atrophy Treated Patient Numbers
10. France – Spinal Muscular Atrophy
10.1 Spinal Muscular Atrophy Market
10.2 Spinal Muscular Atrophy Patient Numbers
10.3 Spinal Muscular Atrophy Treated Patient Numbers
11. Spain
11.1 Spinal Muscular Atrophy Market
11.2 Spinal Muscular Atrophy Patient Numbers
11.3 Spinal Muscular Atrophy Treated Patient Numbers
12. Japan
12.1 Spinal Muscular Atrophy Market
12.2 Spinal Muscular Atrophy Patients
12.3 Spinal Muscular Atrophy Treated Patient Numbers
13. Drugs Sales – Spinal Muscular Atrophy
13.1 Spinraza
13.2 AVXS-101
13.3 CK2127107
13.4 RG7916
13.5 Olesoxime
13.6 LMI070
14. Spinal Muscular Atrophy Study Status Analysis
14.1 Spinal Muscular Atrophy Clinical Study
14.2 Spinal Muscular Atrophy Drugs Development Pipeline
15. Growth Drivers
15.1 Increasing Funding for Research & Development
15.2 Biogen Access Programs
16. Challenges
16.1 High Treatment Cost
16.2 Common Side Effects
17. Biogen Inc.
17.1 Business Overview
17.2 Initiatives/Strategies
17.2.1 Point 1
17.2.2 Point 2
17.2.3 Point 3
17.3 Financial Insight
18. Novartis AG
18.1 Business Overview
18.2 Initiatives/Strategies
18.2.1 Point 1
18.2.2 Point 2
18.3 Financial Insight
19. Roche Holding AG
19.1 Business Overview
19.2 Initiatives/Strategies
19.2.1 Point 1
19.2.2 Point 2
19.3 Financial Insight
20. Cytokinetics, Inc.
20.1 Business Overview
20.2 Initiatives/Strategies
20.2.1 Point 1
20.2.2 Point 2
20.3 Financial Insight
List of Figures:
Figure 4‑1: Global – Current & Forecast for Spinal Muscular Atrophy Market (Million US$), 2017 – 2026
Figure 4‑2: Global – Current & Forecast for Spinal Muscular Atrophy Patients (Number), 2017 – 2026
Figure 4‑3: Global – Current & Forecast for Spinal Muscular Atrophy Treated Patients (Number), 2017 – 2026
Figure 5‑1: Global – Current & Forecast for Spinal Muscular Atrophy Market Share (Percent), 2017 – 2026
Figure 5‑2: Global – Current & Forecast for Spinal Muscular Atrophy Patient Population Share (Percent), 2017 – 2026
Figure 5‑3: Global – Current & Forecast for Spinal Muscular Atrophy Treated Patients Share (Percent), 2017 – 2026
Figure 6‑1: United States – Current & Forecast for Spinal Muscular Atrophy Market (Million US$), 2017 – 2026
Figure 6‑2: United States – Current & Forecast for Spinal Muscular Atrophy Patients (Number), 2017 – 2026
Figure 6‑3: United States – Current & Forecast for Spinal Muscular Atrophy Treated Patients (Number), 2017 – 2026
Figure 7‑1: United Kingdom – Current & Forecast for Spinal Muscular Atrophy Market (Million US$), 2017 – 2026
Figure 7‑2: United Kingdom – Current & Forecast for Spinal Muscular Atrophy Patients (Number), 2017 – 2026
Figure 7‑3: United Kingdom – Current & Forecast for Spinal Muscular Atrophy Treated Patients (Number), 2017 – 2026
Figure 8‑1: Germany – Current & Forecast for Spinal Muscular Atrophy Market (Million US$), 2017 – 2026
Figure 8‑2: Germany – Current & Forecast for Spinal Muscular Atrophy Patients (Number), 2017 – 2026
Figure 8‑3: Germany – Current & Forecast for Spinal Muscular Atrophy Treated Patients (Number), 2017 – 2026
Figure 9‑1: Italy – Current & Forecast for Spinal Muscular Atrophy Market (Million US$), 2017 – 2026
Figure 9‑2: Italy – Current & Forecast for Spinal Muscular Atrophy Patients (Number), 2017 – 2026
Figure 9‑3: Italy – Current & Forecast for Spinal Muscular Atrophy Treated Patients (Number), 2017 – 2026
Figure 10‑1: France – Current & Forecast for Spinal Muscular Atrophy Market (Million US$), 2017 – 2026
Figure 10‑2: France – Current & Forecast for Spinal Muscular Atrophy Patients (Number), 2017 – 2026
Figure 10‑3: France – Current & Forecast for Spinal Muscular Atrophy Treated Patients (Number), 2017 – 2026
Figure 11‑1: Spain – Current & Forecast for Spinal Muscular Atrophy Market (Million US$), 2017 – 2026
Figure 11‑2: Spain – Current & Forecast for Spinal Muscular Atrophy Patients (Number), 2017 – 2026
Figure 11‑3: Spain – Current & Forecast for Spinal Muscular Atrophy Treated Patients (Number), 2017 – 2026
Figure 12‑1: Japan – Current & Forecast for Spinal Muscular Atrophy Market (Million US$), 2017 – 2026
Figure 12‑2: Japan – Current & Forecast for Spinal Muscular Atrophy Patients (Number), 2017 – 2026
Figure 12‑3: Japan – Current & Forecast for Spinal Muscular Atrophy Treated Patients (Number), 2017 – 2026
Figure 13‑1: Global – Current & Forecast for Spinraza Sales (Million US$), 2017 – 2026
Figure 13‑2: Global – Current & Forecast for AVXS-101 Sales (Million US$), 2017 – 2026
Figure 13‑3: Global – Current & Forecast for CK212710 Sales (Million US$), 2022 – 2026
Figure 13‑4: Global – Current & Forecast for RG7916 Sales (Million US$), 2024 – 2026
Figure 13‑5: Global – Current & Forecast for LMI070 Sales (Million US$), 2021 – 2026
Figure 14‑1: Spinal Muscular Atrophy Drugs Development Pipeline, September 2018
Figure 17‑1: Biogen – Global Sales (Million US$), 2013 – 2017
Figure 17‑2: Biogen – Forecast for Global Sales (Million US$), 2018 – 2026
Figure 18‑1: Novartis – Global Sales (Million US$), 2013 – 2017
Figure 18‑2: Novartis – Forecast for Global Sales (Million US$), 2018 – 2026
Figure 19‑1: Roche – Global Sales (Million US$), 2013 – 2017
Figure 19‑2: Roche – Forecast for Global Sales (Million US$), 2018 – 2026
Figure 20‑1: Cytokinetics – Global Sales (Thousand US$), 2013 – 2017
Figure 20‑2: Cytokinetics – Forecast for Global Sales (Million US$), 2018 – 2026
List of Tables:
Table 14-1: Global – Spinal Muscular Atrophy Clinical Study Status, 2018
Reach out to us
Call us on
USA: +1-678-302-0700
INDIA: +91-120-421-9822
Drop us an email at
info@renub.com