1. Research Findings
2. Pediatric (Infant) Vaccines Market (2011 – 2024)
3. Market & Numbers Share – Pediatric Vaccines
3.1 Pediatric Vaccine Market Share
3.2 Pediatric Vaccinated Population Share
3.3 Pediatric Doses of Vaccines Administered Share
3.4 Vaccine Companies Market Share
4. Pediatric Vaccinated Numbers
5. Pediatric Doses of Vaccines Administered
6. Disease wise – Pediatric (Infants) Vaccines Market (2011 – 2024)
6.1 Influenza
6.2 MMR (Measles, Mumps, and Rubella Vaccine)
6.3 Pneumococcal
6.4 Meningococcal
6.5 Hepatitis
6.6 DTaP
6.7 Haemophilus Influenzae Type B (HIB)
6.8 Combos (Combination)
6.9 Polio
6.10 Rotavirus
6.11 Varicella
7. Disease wise – Numbers of Vaccinated Pediatric (Infants) (2011 – 2024)
7.1 Influenza
7.2 MMR
7.3 Pneumococcal
7.4 Meningococcal
7.5 Hepatitis
7.6 DTaP
7.7 Hib (Haemophilus Influenzae Type B)
7.8 Combos (Combination Vaccines)
7.9 Polio
7.10 Rotavirus
7.11 Varicella
8. Disease wise – Doses of Vaccines Administered in Pediatric (Infants) (2011 – 2024)
8.1 Influenza
8.2 MMR
8.3 Pneumococcal
8.4 Meningococcal
8.5 Hepatitis
8.6 DTaP
8.7 Hib (Haemophilus Influenzae Type B)
8.8 Polio
8.9 Rotavirus
8.10 Varicella
9. Disease wise - Immunization Profile
9.1 Immunization Coverage (%) in Infants
9.2 Global Immunization Profile
9.3 Regional Immunization Profile
9.3.1 Measles – Number of Reported Cases
9.3.2 Mumps – Number of Reported Cases
9.3.3 Rubella – Number of Reported Cases
9.3.4 Rubella (CRS) – Number of Reported Cases
9.3.5 Diphtheria – Number of Reported Cases
9.3.6 Tetanus (Neonatal) – Number of Reported Cases
9.3.7 Tetanus (Total) – Number of Reported Cases
9.3.8 Pertussis – Number of Reported Cases
9.3.9 Polio – Number of Reported Cases
9.3.10 Yellow Fever – Number of Reported Cases
9.3.11 Japanese encephalitis – Number of Reported Cases
10. Vaccines Key Players Sales (2011 – 2024)
10.1 GlaxoSmithKline, plc.’s Vaccines Sales
10.2 Merck & Co. Vaccines Sales
10.3 Sanofi Pasteur’s Vaccines Sales
10.4 Pfizer, Inc.’s Vaccines Sales
10.5 Global – Other Companies Vaccines Sales
11. Vaccines – Products and Pipeline
11.1 GSK Vaccine Product Pipeline
11.2 Merck Vaccine Product Pipeline
11.3 Sanofi Vaccine Product Pipeline
11.4 Pfizer Vaccine Product Pipeline
12. Top Mergers and Acquisitions in the Vaccine Industry
13. Vaccines and Regulator’s Interventions
13.1 Making and Meeting Standards of Quality and Safety
13.2 Vaccine Funding
14. Vaccine Market Drivers
14.1 Inclusion in National Immunization Schedule
14.2 Growing Immunization Coverage for HPV Vaccines
14.3 Increase in Prevalence of Infectious Diseases
14.4 Global Immunization Vision and Strategy (GIVS)
14.5 GAVI Model Fuelling Vaccine Manufacturers
14.5.1 The Partnership Model
14.5.2 The Business Model
14.6 Increasing Vaccine Availability in United States
14.7 The Vaccine Safety Data link Project
14.8 The Vaccine Injury Compensation Program
14.9 Transforming of Vaccine Technologies
14.10 Global Vaccine Action Plan by WHO (2011 - 2020)
14.11 Continuous Focus on Effective Communication Strategies
15. Vaccines Market Challenges
15.1 Hurdles to Optimal use of Licensed Vaccines
15.1.1 Technical Obstacles
15.1.2 Economic Obstacles
15.1.3 Cultural Obstacles
15.2 Complexity of Vaccine Development & Approval System Thwarts Product Development
15.2.1 Legal Obstacles
15.2.2 General Technical Barriers
15.2.3 Economic Barriers
15.2.4 Regulatory Barriers
15.3 Shortening the Timeline for Vaccine Development
15.4 Refusal/Resistance to Vaccination
15.4.1 Vaccine Adverse Event Reporting System
15.5 Vaccine Shortages and Delays
15.6 Obstacles in Vaccine Research & Development
15.7 Barriers to New Entrants in the Vaccines Market
Lists of Figures:
Figure 2‑1: Global – Pediatric (Infant) Vaccines Market (Billion US$), 2011 – 2017
Figure 2‑2: Global – Forecast for Pediatric (Infant) Vaccines Market (Billion US$), 2018 – 2024
Figure 3‑1: Global – Pediatric (Infant) Vaccines Market Share (Percent), 2011 - 2017
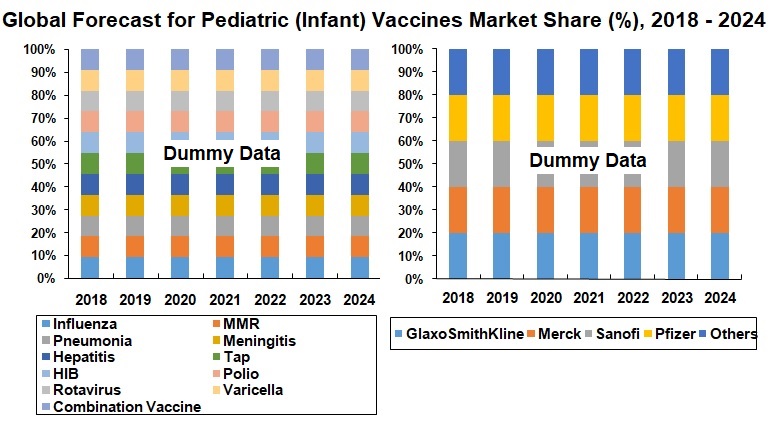
Figure 3‑2: Global – Forecast for Pediatric (Infant) Vaccines Market Share (Percent), 2018 - 2024
Figure 3‑3: Global – Vaccinated Infant (Pediatric) Share (Percent), 2011 – 2017
Figure 3‑4: Global – Forecast for Vaccinated Infant (Pediatric) Share (Percent), 2018 – 2024
Figure 3‑5: Global – Doses of Vaccines Administered to Pediatric (Infant) Share (Percent), 2011 - 2017
Figure 3‑6: Global – Forecast for Doses of Vaccines Administered to Pediatric (Infant) Share (Percent), 2018 - 2024
Figure 3‑7: Global – Key Players Vaccines Market Share (Percent), 2011 - 2017
Figure 3‑8: Global – Forecast for Key Players Vaccines Market Share (Percent), 2018 - 2024
Figure 4‑1: Global – Number of Vaccinated Infant (Pediatric) (Million), 2011 - 2017
Figure 4‑2: Global – Forecast for Number of Vaccinated Infant (Pediatric) (Million), 2018 – 2024
Figure 5‑1: Global – Doses of Pediatric (Infant) Vaccines Administered (Million), 2011 - 2017
Figure 5‑2: Global – Forecast for Doses of Pediatric (Infant) Vaccines Administered (Million), 2018 - 2024
Figure 6‑1: Influenza – Pediatric (Infant) Vaccines Market (Million US$), 2011 - 2017
Figure 6‑2: Influenza – Forecast for Pediatric (Infant) Vaccines Market (Million US$), 2018 - 2024
Figure 6‑3: MMR – Pediatric (Infant) Vaccines Market (Million US$), 2011 – 2017
Figure 6‑4: MMR – Forecast for Pediatric (Infant) Vaccines Market (Million US$), 2018 - 2024
Figure 6‑5: Pneumococcal – Pediatric (Infant) Vaccines Market (Billion US$), 2011 - 2017
Figure 6‑6: Pneumococcal – Forecast for Pediatric (Infant) Vaccines Market (Billion US$), 2018 - 2024
Figure 6‑7: Areas with frequent epidemics of meningococcal meningitis
Figure 6‑8: Meningococcal – Pediatric (Infant) Vaccines Market (Million US$), 2011 - 2017
Figure 6‑9: Meningococcal – Forecast for Pediatric (Infant) Vaccines Market (Million US$), 2018 - 2024
Figure 6‑10: Hepatitis – Pediatric (Infant) Vaccines Market (Million US$), 2011 - 2017
Figure 6‑11: Hepatitis – Forecast for Pediatric (Infant) Vaccines Market (Million US$), 2018 - 2024
Figure 6‑12: DTaP – Pediatric (Infant) Vaccines Market (Million US$), 2011 - 2017
Figure 6‑13: DTaP – Forecast for Pediatric (Infant) Vaccines Market (Million US$), 2018 - 2024
Figure 6‑14: Haemophilus Influenzae Type B (HIB) – Vaccines Market (Million US$), 2011 - 2017
Figure 6‑15: Haemophilus Influenzae Type B (HIB) – Forecast for Vaccines Market (Million US$), 2018 - 2024
Figure 6‑16: Combos (Combination) – Vaccines Market (Billion US$), 2011 - 2017
Figure 6‑17: Combos (Combination) – Forecast for Vaccines Market (Billion US$), 2018 - 2024
Figure 6‑18: Polio – Vaccines Market (Million US$), 2011 - 2017
Figure 6‑19: Polio – Forecast for Vaccines Market (Million US$), 2018 - 2024
Figure 6‑20: Rotavirus Deaths Under Five Years of Age per 100 000 Population <5 Years of Age, 2013
Figure 6‑21: Ten Countries Accounting for Almost Two Thirds of All Deaths, 2013
Figure 6‑22: Rotavirus – Vaccines Market (Million US$), 2011 - 2017
Figure 6‑23: Rotavirus – Forecast for Vaccines Market (Million US$), 2018 - 2024
Figure 6‑24: Varicella – Pediatric (Infant) Vaccines Market (Million US$), 2011 - 2017
Figure 6‑25: Varicella – Forecast for Pediatric (Infant) Vaccines Market (Million US$), 2018 - 2024
Figure 7‑1: Influenza – Number of Vaccinated Infants (Million), 2011 - 2017
Figure 7‑2: Influenza – Forecast for Number of Vaccinated Infants (Million), 2018 - 2024
Figure 7‑3: MMR – Number of Vaccinated Infants (Pediatric) (Million), 2011 - 2017
Figure 7‑4: MMR – Forecast for Number of Vaccinated Infants (Pediatric) (Million), 2018 - 2024
Figure 7‑5: Pneumococcal – Number of Vaccinated Infants (Million), 2011 - 2017
Figure 7‑6: Pneumococcal – Forecast for Number of Vaccinated Infants (Million), 2018 - 2024
Figure 7‑7: Meningococcal – Number of Vaccinated Infants (Million), 2011 - 2017
Figure 7‑8: Meningococcal – Forecast for Number of Vaccinated Infants (Million), 2018 - 2024
Figure 7‑9: Hepatitis – Number of Vaccinated Infants (Million), 2011 - 2017
Figure 7‑10: Hepatitis – Forecast for Number of Vaccinated Infants (Million), 2018 - 2024
Figure 7‑11: DTaP – Number of Vaccinated Infants (Million), 2011 - 2017
Figure 7‑12: DTaP – Forecast for Number of Vaccinated Infants (Million), 2018 - 2024
Figure 7‑13: Hib (Haemophilus Influenzae Type B) – Number of Vaccinated Infants (Million), 2011 - 2017
Figure 7‑14: Hib (Haemophilus Influenzae Type B) – Forecast for Number of Vaccinated Infants (Million), 2018 - 2024
Figure 7‑15: Combos (Combination Vaccines) – Number of Vaccinated Infants (Million), 2011 - 2017
Figure 7‑16: Combos (Combination Vaccines) – Forecast for Number of Vaccinated Infants (Million), 2018 - 2024
Figure 7‑17: Polio – Number of Infants Immunized (Million), 2011 - 2017
Figure 7‑18: Polio – Forecast for Number of Vaccinated Infants (Million), 2018 - 2024
Figure 7‑19: Rotavirus – Number of Infants Immunized (Million), 2011 - 2017
Figure 7‑20: Rotavirus – Forecast for Number of Infants Immunized (Million), 2018 - 2024
Figure 7‑21: Varicella – Number of Vaccinated Infants (Million), 2011 - 2017
Figure 7‑22: Varicella – Forecast for Number of Vaccinated Infants (Million), 2018 - 2024
Figure 8‑1: Influenza – Doses of Infant Vaccines Administered (Million), 2011 - 2017
Figure 8‑2: Influenza – Forecast for Doses of Infant Vaccines Administered (Million), 2018 - 2024
Figure 8‑3: MMR – Doses of Infant Vaccines Administered (Million), 2011 - 2017
Figure 8‑4: MMR – Forecast for Doses of Infant Vaccines Administered (Million), 2018 - 2024
Figure 8‑5: Pneumococcal – Doses of Infant Vaccines Administered (Million), 2011 - 2017
Figure 8‑6: Pneumococcal – Forecast for Doses of Infant Vaccines Administered (Million), 2018 - 2024
Figure 8‑7: Meningococcal – Doses of Infant Vaccines Administered (Million), 2011 - 2017
Figure 8‑8: Meningococcal – Forecast for Doses of Infant Vaccines Administered (Million), 2018 - 2024
Figure 8‑9: Hepatitis – Doses of Infant Vaccines Administered (Million), 2011 - 2017
Figure 8‑10: Hepatitis – Forecast for Doses of Infant Vaccines Administered (Million), 2018 - 2024
Figure 8‑11: DTaP – Doses of Infant Vaccines Administered (Million), 2011 - 2017
Figure 8‑12: DTaP – Forecast for Doses of Infant Vaccines Administered (Million), 2018 - 2024
Figure 8‑13: Hib (Haemophilus Influenzae Type B) – Doses of Infant Vaccines Administered (Million), 2011 - 2017
Figure 8‑14: Hib (Haemophilus Influenzae Type B) – Forecast for Doses of Infant Vaccines Administered (Million), 2018 - 2024
Figure 8‑15: Polio – Doses of Infant Vaccines Administered (Million), 2011 - 2017
Figure 8‑16: Polio – Forecast for Doses of Infant Vaccines Administered (Million), 2018 - 2024
Figure 8‑17: Rotavirus – Doses of Infant Vaccines Administered (Million), 2011 - 2017
Figure 8‑18: Rotavirus – Forecast for Doses of Infant Vaccines Administered (Million), 2018 - 2024
Figure 8‑19: Varicella – Doses of Infant Vaccines Administered (Million), 2011 - 2017
Figure 8‑20: Varicella – Forecast for Doses of Infant Vaccines Administered (Million), 2018 - 2024
Figure 10‑1: Global - GlaxoSmithKline, plc.’s Vaccines Sales (Billion US$), 2011 - 2017
Figure 10‑2: Global – Forecast for GlaxoSmithKline, plc.’s Vaccines Sales (Billion US$), 2018 - 2024
Figure 10‑3: Global - Merck & Co. Vaccines Sales (Billion US$), 2011 - 2017
Figure 10‑4: Global – Forecast for Merck & Co. Vaccines Sales (Billion US$), 2018 - 2024
Figure 10‑5: Global - Sanofi Pasteur’s Vaccines Sales (Billion US$), 2011 - 2017
Figure 10‑6: Global – Forecast for Sanofi Pasteur’s Vaccines Sales (Billion US$), 2018 - 2024
Figure 10‑7: Global - Pfizer, Inc.’s Vaccines Sales (Billion US$), 2011 - 2017
Figure 10‑8: Global – Forecast for Pfizer, Inc.’s Vaccines Sales (Billion US$), 2018 - 2024
Figure 10‑9: Global – Other Companies Vaccines Sales (Billion US$), 2011 - 2017
Figure 10‑10: Global – Forecast for Other Companies Vaccines Sales (Billion US$), 2018 - 2024
Figure 11‑1: GSK Vaccine Product Pipeline
Figure 14‑1: Countries with HPV Vaccination Program listed on their National Immunization Program (NIP) Schedule
Figure 14‑2: Number of Cases of Diphtheria, Pertussis, Tetnaus & Measles by Major Region Worldwide, 2013
Figure 14‑3: Vaccines Procured by UNICEF: Industrialized and Emerging Market Country Manufacturers
Figure 14‑4: Vaccines procured by UNICEF: Industrialized and Emerging Market Country Manufacturers
Figure 14‑5: US Retail Clinics Expected to Surge by 2017
Lists of Tables:
Table 9‑1: Worldwide Immunization Coverage (%) in Infants, 2005- 2010
Table 9‑2: Worldwide Immunization Coverage (%) in Infants, 2011- 2016
Table 9‑3: Vaccines – Number of Reported Cases, 2011 – 2017
Table 9‑4: Measles – Number of Reported Cases, 2001 – 2016
Table 9‑5: Mumps – Number of Reported Cases, 2001 - 2016
Table 9‑6: Rubella – Number of Reported Cases, 2001 - 2016
Table 9‑7: Rubella (CRS) – Number of Reported Cases, 2001 - 2016
Table 9‑8: Diphtheria – Number of Reported Cases, 2001 - 2016
Table 9‑9: Tetanus (Neonatal) – Number of Reported Cases, 2001 – 2016
Table 9‑10: Tetanus (Total) – Number of Reported Cases, 2001 - 2016
Table 9‑11: Pertussis – Number of Reported Cases, 2001 - 2016
Table 9‑12: Polio – Number of Reported Cases, 2001 - 2016
Table 9‑13: Yellow Fever – Number of Reported Cases, 2001 - 2016
Table 9‑14: Japanese Encephalitis – Number of Reported Cases Reported, 2006 - 2016
Table 11‑1: Merck Vaccine Product Pipeline
Table 11‑2: Sanofi Vaccine Product Pipeline
Table 11‑3: Pfizer Vaccine Product Pipeline
Table 12‑1: Vaccine Mergers & Acquisitions
Table 14‑1: United States Immunization Schedule
Table 14‑2: Afghanistan Immunization Schedule
Table 14‑3: Norway Immunization Schedule
Table 14‑4: India Immunization Schedule
Table 14‑5: Vietnam Immunization Schedule
Table 14‑6: Worldwide – Total Future Deaths Averted through Vaccination (Million), 2011 – 2020
Table 14‑7: Goal-Level Indicators, 2015 & 2020
Table 14‑8: Improvement Strategies or Requirements – the Joint Commission and the Project’s Collaborating Organizations