1. Introduction
2. Research & Methodology
3. Executive Summary
4. Market Dynamics
4.1 Growth Drivers
4.2 Challenges
5. United States Vaccine Analysis
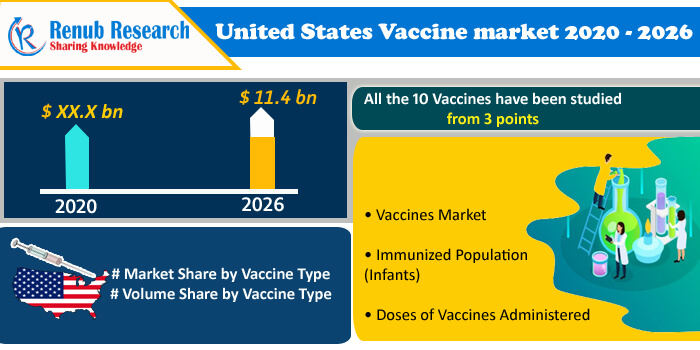
5.1 Vaccine Market
5.2 Immunized Population
5.3 Doses of Vaccines Administered
6. Share Analysis
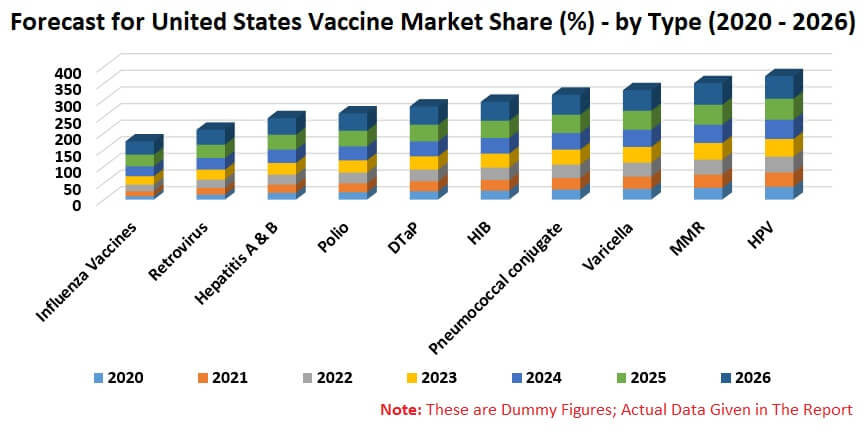
6.1 Market Share by Vaccine Type
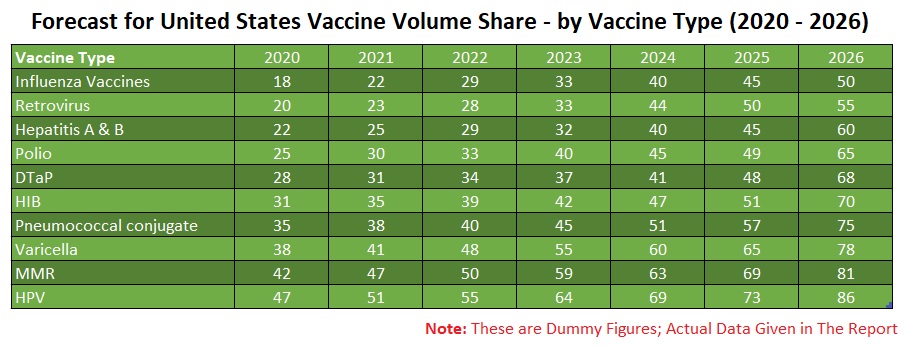
6.2 Volume Share by Vaccine Type
7. Disease wise – Vaccines Market& Volume and Forecast
7.1 Influenza Vaccines Market & Types
7.1.1 Trivalent Flu Vaccine
7.1.2 Quadrivalent Flu Vaccine
7.1.3 Administered Doses
7.2 Rotavirus
7.2.1 Vaccines Market
7.2.2 Immunized Population (Infants)
7.2.3 Administered Doses
7.3 Hepatitis B
7.3.1 Vaccines Market
7.3.2 Immunized Population (Infants)
7.3.3 Administered Doses
7.3.4 Hepatitis A
7.4 Polio
7.4.1 Vaccines Market
7.4.2 Immunized Population (Infants + Children)
7.4.3 Administered Doses
7.5 DTaP
7.5.1 Vaccines Market
7.5.2 Immunized Population
7.5.3 Administered Doses
7.6 HIB
7.6.1 Vaccines Market
7.6.2 Immunized Population (Infants)
7.6.3 Administered Doses
7.7 Pneumococcal conjugate
7.7.1 Vaccines Market
7.7.2 Immunized Population (Infants)
7.7.3 Administered Doses
7.8 Varicella
7.8.1 Vaccines Market
7.8.2 Immunized Population (Infants + 4-6 years old)
7.8.3 Administered Doses
7.9 MMR
7.9.1 Vaccines Market
7.9.2 Immunized Population (Infants + 4-6 years old)
7.9.3 Administered Doses
7.10 HPV
7.10.1 Vaccines Market
7.10.2 Immunized Population (Immunized Girl)
7.10.3 Administered Doses
8. Vaccines – Products and Pipeline
8.1 GlaxoSmithKline, plc
8.2 Merck & Co
8.3 Sanofi Pasteur
8.4 Pfizer, Inc.
9. Top Mergers and Acquisitions in the Vaccine Industry
10. Key Players
10.1 GlaxoSmithKline, plc.’s Vaccines Sales
10.2 Merck & Co. Vaccines Sales
10.3 Sanofi Pasteur’s Vaccines Sales
10.4 Pfizer, Inc.’s Vaccines Sales
List of Figures:
Figure-01: United States – Vaccine Market (Million US$), 2016 – 2019
Figure-02: United States – Forecast For Vaccine Market (Million US$), 2020 – 2026
Figure-03: United States – Immunized Population (Million), 2016 – 2019
Figure-04: United States – Vaccine Market (Million US$), 2016 – 2019
Figure-05: United States – Forecast For Vaccine Market (Million US$), 2020 – 2026
Figure-06: United States – Immunized Population (Million), 2016 – 2019
Figure-07: United States – Forecast for Immunized Population (Million) - 2020-2026
Figure-08: United States – Doses of Vaccines Administered (Million), 2016 – 2019
Figure-09: United States – Forecast For Doses of Vaccines Administered (Million), 2020 – 2026
Figure-10: United States – Influenza Vaccines Market (Million US$), 2015 – 2019
Figure-11: United States – Forecast For Influenza Vaccines Market (Million US$), 2020 – 2026
Figure-12: United States – Trivalent flu Vaccines (Million US$), 2014 – 2019
Figure-13: United States – Forecast For Trivalent flu Vaccine (Million US$), 2020 – 2026
Figure-14: United States – Quadrivalent flu Vaccine (Million US$), 2017– 2019
Figure-15: United States – Forecast For Quadrivalent flu Vaccine (Million US$), 2020 – 2026
Figure-16: United States – Administered Doses (Million), 2017 – 2019
Figure-17: United States – Forecast For Administered Doses (Million), 2020 – 2026
Figure-18: United States – Rotavirus Vaccines Market (Million US$), 2015 – 2019
Figure-19: United States – Forecast For Rotavirus Vaccines Market (Million Pound), 2020 – 2026
Figure-20: United States – Rotavirus Immunized Infants (Million), 2015 – 2019
Figure-21: United States – Forecast For Rotavirus Immunized Infants (Million), 2020 – 2026
Figure-22: United States – Rotavirus Administered Doses (Million), 2015 – 2019
Figure-23: United States – Forecast For Rotavirus Administered Doses (Million), 2020 – 2026
Figure-24: United States – Hepatitis B Vaccines Market (Million US$), 2015 – 2019
Figure-25: United States – Forecast For Hepatitis B Vaccines Market (Million US$), 2020 – 2026
Figure-26: United States – Hepatitis B Immunized Population (Million), 2015 – 2019
Figure-27: United States – Forecast For Hepatitis B Immunized Population (Million), 2020 – 2026
Figure-28: United States – Hepatitis B Administered Doses (Million), 2015 – 2019
Figure-29: United States – Forecast For Hepatitis B Administered Doses (Million), 2020 – 2026
Figure-30: United States – Hepatitis A Vaccines Market (Million US$), 2015 – 2019
Figure-31: United States – Forecast For Hepatitis A Vaccines Market (Million US$), 2020 – 2026
Figure-32: United States – Hepatitis A Immunized Infants (Million), 2015 – 2019
Figure-33: United States – Forecast For Hepatitis A Immunized Infants (Million), 2020 – 2026
Figure-34: United States – Hepatitis B Administered Doses (Million), 2015 – 2019
Figure-35: United States – Forecast For Hepatitis B Administered Doses (Million), 2020 – 2026
Figure-36: United States – Polio Vaccine Market (Million US$), 2015 – 2019
Figure-37: United States – Forecast For Polio Vaccine Market (Million US$), 2020 – 2026
Figure-38: United States – Polio Immunized Infants (Million), 2015 – 2019
Figure-39: United States – Forecast For Polio Immunized Infants (Million), 2020 – 2026
Figure-40: United States – Polio Administered Doses (Million), 2015 – 2019
Figure-41: United States – Forecast for Polio Administered Doses (Million), 2020 – 2026
Figure-42: United States – DTaP Vaccines Market (Million US$), 2015 – 2019
Figure-43: United States – Forecast For DTaP Vaccines Market (Million US$), 2020 – 2026
Figure-44: United States – DTaP Immunized Population (Million), 2015 – 2019
Figure-45: United States – Forecast For DTaP Immunized Population (Million), 2020 – 2026
Figure-46: United States – DTaP Administered Doses (Million), 2015 – 2019
Figure-47: United States – Forecast For DTaP Administered Doses (Million), 2020 – 2026
Figure-48: United States – HIB Vaccine Market (Million US$), 2015 – 2019
Figure-49: United States – Forecast For – HIB Vaccine Market (Million US$), 2020 – 2026
Figure-50: United States – HIB Immunized Infants (Million), 2015 – 2019
Figure-51: United States – Forecast For HIB Immunized Infants (Million ), 2020 – 2026
Figure-52: United States – HIB Administered Doses (Million), 2015 – 2019
Figure-53: United States – Forecast For HIB Administered Doses (Million), , 2020 – 2026
Figure-54: United States – Pneumococcal conjugate Vaccines Market (Million US$), 2015 – 2019
Figure-55: United States – Pneumococcal conjugate Vaccines Market (Million US$), 2020 – 2026
Figure-56: United States – Pneumococcal conjugate Immunized Population (Million), 2015 – 2019
Figure-57: United States – Forecast For Pneumococcal conjugate Immunized Population (Million), 2020 – 2026
Figure-58: United States – Pneumococcal conjugate Administered Doses (Million), 2015 – 2019
Figure-59: United States – Forecast For Pneumococcal conjugate Administered Doses (Million), 2020 – 2026
Figure-60: United States – Varicella Vaccines Market (Million US$), 2015 – 2019
Figure-61: United States – Forecast For Varicella Vaccines Market (Million US$), 2020 – 2026
Figure-62: United States – Varicella Immunized Infants (Million), 2015 – 2019
Figure-63: United States – Forecast For Varicella Immunized Infants (Million), 2020 – 2026
Figure-64: United States – Varicella Administered Doses (Million), 2015 – 2019
Figure-65: United States – Forecast For Varicella Administered Doses (Million), 2020 – 2026
Figure-66: United States – MMR Vaccine Market (Million US$), 2015 – 2019
Figure-67: United States – Forecast For MMR Vaccine Market (Million US$), 2020 – 2026
Figure-68: United States – MMR Immunized Population (Million), 2015 – 2019
Figure-69: United States – Forecast For MMR Immunized Population (Million ), 2020 – 2026
Figure-70: United States – Administered Doses (Million), 2015 – 2019
Figure-71: United States – Forecast For Administered Doses (Million), 2020 – 2026
Figure-72: United States – HPV Vaccine Market (Million US$), 2015 – 2019
Figure-73: United States – Forecast For HPV Vaccine Market (Million), 2020 – 2026
Figure-74: United States – HPV Immunized Girl (Million), 2015 – 2019
Figure-75: United States – Forecast For HPV Immunized Girl (Million), 2020 – 2026
Figure-76: United States – HPV Administered Doses (Million), 2015 – 2019
Figure-77: United States – Forecast For HPV Administered Doses (Million ), 2020 – 2026
Figure-78: Global – GlaxoSmithKline, plc.'s Vaccine Revenue (Million US$), 2015 – 2019
Figure-79: Global – Forecast For GlaxoSmithKline plc.'s Vaccine Revenue (Million US$), 2020 – 2026
Figure-80: Global – Merck & Co. Vaccine Revenue (Million US$), 2015 – 2019
Figure-81: Global – Forecast For Merck & Co. Vaccine Revenue (Million US$), 2020 – 2026
Figure-82: Global – Sanofi Pasteur’s Vaccines Revenue (Million US$), 2015 – 2019
Figure-83: Global – Forecast For Sanofi Pasteur’s Vaccines Revenue ( Million US$) 2020 – 2026
Figure-84: Global – Pfizer, Inc.’s Vaccine Revenue (Million US$), 2015 – 2020
Figure-85: Global – Forecast For Pfizer, Inc.’s Vaccine Revenue (Million US$), 2020 – 2026
List of Tables:
Table-01: United States – Market Share by Vaccine Type (Percentage), 2017 – 2020
Table-02: United States – Forecast For Market Share by Vaccine Type (Percentage), 2020 – 2026
Table-03: United States – Volume Share by Vaccine Type (Percentage), 2017 – 2020
Table-04: United States – Forecast For Volume Share by Vaccine Type (Percentage), 2020 – 2026
Table-05: GlaxoSmithKline, plc. Products & Pipelines
Table-06: Sanofi Pasteur Products & Pipelines
Table-07: Pfizer Products & Pipelines