
")
India Home Automation Market, Size, Forecast 2023-2030, Industry Trends, Growth, Share, Outlook, Impact of Inflation, Opportunity Company Analysis
India Home Automation Market Outlook
India Home Automation Market will reach US$ 25.64 Billion in 2030 compared to US$ 4.83 Billion in 2022 according to Renub Research. Home automation integrates electronic and smart devices in a home, allowing remote control and management of lighting, HVAC, security, entertainment, and appliances. It offers convenience, energy efficiency, safety, and comfort. Standard technologies include smart thermostats, lighting systems, locks, security cameras, and voice assistants.
The benefits of home automation encompass safety, convenience, cost savings, and time efficiency. In India, the primary focus of implementing home automation centers on security and energy efficiency. Utilizing home automation technology allows individuals to control their heating and cooling systems, leading to significant energy savings. Additionally, lights can be automatically adjusted based on factors like sunrise, sunset, or occupancy.
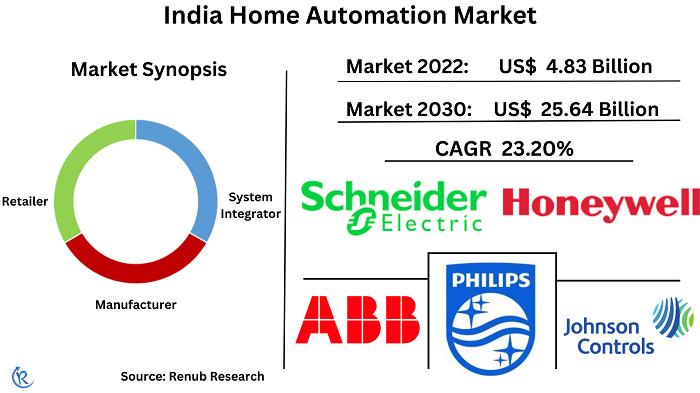
India Home Automation Market shall grow at a CAGR of 23.20% from 2022-2030
The cost-effectiveness of home automation is a significant driving factor in India home automation market. Cities such as Pune and Mumbai are experiencing substantial growth in adopting smart home systems, supported by various competitors offering affordable home automation solutions. This trend expands the scope of India home automation market. Furthermore, developing intelligent kitchen appliances like smart coffeemakers, ovens, cookers, and grills has also contributed to developing the IoT-based smart home industry, creating profitable opportunities for players in India home automation market.
However, limited connectivity and lower average bandwidth in India hinder the market penetration of home automation systems, setting it behind other developing nations. Additionally, the lack of standardization of products and components in smart homes poses challenges and can result in system failures, impeding the growth of India's home automation market.
Wireless segment of India home automation market holds significant potential for substantial growth
The network type segments in India home automation market include Wired, Wireless, and Power line-based technologies. Wireless networks play a pivotal role in the thriving India home automation market, thanks to their widespread adoption and numerous advantages. Their easy installation, scalability, flexibility, and cost-effectiveness make them the preferred choice for homeowners. By eliminating the need for intricate wiring, wireless networks enable devices to be placed anywhere in the home without constraints. They are highly accessible and compatible with a diverse array of devices, offering multiple connectivity options. Additionally, the increasing prevalence of smartphones allows homeowners to effortlessly control their home automation systems through intuitive mobile applications, further enhancing the convenience and accessibility of wireless network-based automation solutions in India.
In India home automation market, there is a growing popularity of comfort and lighting solutions
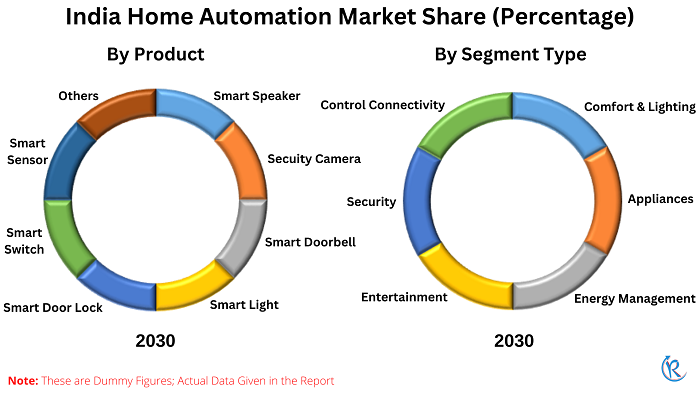
India home automation market offers diverse segments, encompassing Comfort & Lighting, Appliances, Energy Management, Entertainment, Security, and Control Connectivity. In India home automation industry, the appliance market is growing steadily as manufacturers offer diverse smart appliances to meet consumer needs and budgets. Smart appliances are in demand for their convenience, automated features, and cost savings, with advanced functionalities like remote control, scheduling, and energy monitoring. As technology advances and consumer awareness increases, the market is expected to expand further, driving innovation and meeting evolving demands. This growth contributes to the overall development of the home automation industry in India.
Homeowners in India seek convenience and ease in managing their living spaces, leading to a growing demand for comfort and lighting solutions in home automation. These solutions provide several benefits, including energy efficiency, enhanced ambiance, mood-setting, smart device integration, and technological advancements. Additionally, increasing consumer awareness about the potential advantages of home automation contributes to the growth of comfort and lighting solutions in India home automation market.
Security camera products market is flourishing in India home automation industry
India home automation market encompasses a wide range of essential products, such as the Smart speaker, Security cameras, Smart doorbells, Smart lights, Smart door locks, Smart switches, Smart sensors, and other related devices. Security cameras dominate India home automation market due to the increasing need for security, technological advancements, integration with smart home systems, cost-effectiveness, remote monitoring, and growing awareness among homeowners. They provide protection and peace of mind, while technological advancements make them more effective. In addition, integration with other smart devices, remote monitoring capabilities, and affordability contribute to their widespread adoption in India.
System integrators dominate the distribution channel in India home automation market due to their expertise, industry partnerships, and service integration
Various channels are utilized in distributing India home automation market, including system integrators, manufacturers, and retailers. System integrators dominate the distribution channel in India home automation market due to their expertise and technical knowledge in designing and configuring home automation systems. They offer comprehensive solutions that cover various aspects like security, lighting, energy management, entertainment, and control systems, ensuring seamless integration.
By working closely with homeowners, they provide personalized and customized solutions that meet individual needs. System integrators also handle project management, providing support throughout the entire process. Their industry partnerships grant access to a wide range of products and technologies, while their ability to integrate with other services enhances the overall home automation experience.
Customer spending on home automation products in the range of 45,001 to 60,000 is gaining popularity in India home automation market
India home automation market offers a wide range of customer spending options on home automation products, spanning less than 15000, 15001-30000, 30001-45000, 45001-60000, and exceeding 60001. The India home automation market is experiencing a significant increase in customer spending on home automation products between the ranges of 45,001 to 60,000 in upcoming years. This surge is driven by consumers' growing interest in investing in home automation solutions to enhance their living spaces with advanced automation features.
Several factors contribute to this growth, including the affordability of home automation products in this price range, the expanding middle-class population, and the increasing awareness of the benefits and convenience that come with home automation. To meet the demand, manufacturers and service providers are actively targeting this segment by offering more cost-effective and feature-rich products within the specified price range. This approach provides consumers with greater accessibility and a wider range of options, leading to an additional boost in customer spending.
The less than 15,000 spending on smart appliances commands the largest market share in India home automation market. This range is favored by budget-conscious consumers who prioritize accessibility and affordability. The compatibility of these products with home automation systems and their ability to seamlessly integrate with other smart devices enhance their appeal among consumers seeking budget-friendly home automation solutions. This combination of affordability and functionality has propelled the sub-15,000 spending range to its prominent position in the India home automation market.
By end user, residential segment is growing steadily in India
Residential and commercial are the two segments covered by end user in India Home Automation Market. An increasing number of Indian homeowners are embracing smart home technology to improve their quality of life due to the increased affordability of smart gadgets, rising disposable incomes, and a growing population of tech-savvy people. Homeowners can automate a number of features with the help of smart home technology, including lighting, temperature control, security systems, entertainment systems, and appliances. This automation is made possible by a network of linked devices that can be easily remotely controlled or set up to carry out tasks in response to triggers or schedules. As a result, adoption of smart homes for residential use in India will continue to grow steadily during the forecast period. Additionally, the adoption of smart home technology in commercial spaces, such as offices, hotels, retail stores, and healthcare facilities, is driven by the increasing demand for automation, energy efficiency, and enhanced security.
North India home automation market in is on the verge of significant growth in the coming years
Based on region, India home automation market division is in four parts North India, East India, South India, and West India. The home automation market in North India is poised for substantial growth in the forthcoming years. This growth can be attributed to various factors, including the increasing urbanization and rising disposable income of the region's population. As more people migrate to urban areas and experience an improvement in their financial capabilities, the demand for home automation solutions is expected to surge. Additionally, there is a growing awareness among consumers about the benefits of home automation, such as increased convenience, energy efficiency, and enhanced security. This heightened awareness, coupled with the availability of affordable home automation products and solutions, further fuels the market growth.
The west region of India holds the top position in the home automation market. Several factors contribute to its leadership, including a strong consumer base with higher purchasing power, a progressive mindset towards technology adoption, and robust economic growth accompanied by infrastructure development and urbanization. Both residential and commercial customers in this region actively embrace and invest in home automation solutions, further solidifying its position as the leading market for home automation in India.
Growing awareness and adoption of smart home technologies have contributed to the rapid expansion of the home automation industry in Bangalore
Pune, Delhi-NCR, Mumbai, Hyderabad, Ahmadabad, Bangalore, Chennai, Jaipur, Kolkata, Ludhiana, Chandigarh, Cochin, Coimbatore, and Others are the major cities present in India home automation market. Known as the "Silicon Valley of India," Bangalore thriving IT sector and technological advancements have fostered the emergence of a robust home automation industry in the city. This industry comprises a diverse array of innovative companies, startups, and technology-driven service providers, offering a wide range of home automation products and solutions to cater the varied needs and preferences of consumers.
Bangalore's tech-savvy population, combined with a growing middle class and their increasing disposable income, has fueled a strong demand for home automation solutions. Residents of the city are embracing smart home technologies to transform their living spaces, enhancing convenience and improving energy efficiency.
As one of the most urbanized regions in India, Delhi NCR is experiencing a growing awareness among its residents about the numerous benefits that home automation offers, including convenience, security, and energy efficiency. Companies are actively innovating to meet the evolving needs of consumers, making the market highly competitive. With the expected entry of new players, the market is poised for further expansion and development in the future.
Key Players
In India's home automation market, notable companies such as Koninklijke Philips, Schneider Electric, Johnson Controls, Honeywell, ABB, Amazon (ECHO), Alphabet, and Larsen &Tubros have established a prominent presence.
Renub Research latest Report "India Home Automation Market by Network Type (Wired, Wireless, and Power line-based), Segment Type (Comfort & Lighting, Appliances, Energy Management, Entertainment, Security, and Control Connectivity), Product (Smart speaker, Security cameras, Smart doorbells, Smart lights, Smart door locks, Smart switches, Smart sensors, and other), Distribution Channel (system integrators, manufacturers, and retailers), Customer Spending (less than 15000, 15001-30000, 30001-45000, 45001-60000, and exceeding 60001), End User (Residential, Commercial) Regions (North India, East India, South India, and West India), Cities (Pune, Delhi-NCR, Mumbai, Hyderabad, Ahmadabad, Bangalore, Chennai, Jaipur, Kolkata, Ludhiana, Chandigarh, Cochin, Coimbatore, and Others), and by Company Analysis (Koninklijke Philips, Schneider Electric, Johnson Controls, Honeywell, ABB, Amazon (ECHO), Alphabet, and Larsen &Tubros)" provides complete details on India Home Automation Industry.
Network Type – Market has been covered from 3 viewpoints
1. Wired
2. Wireless
3. Power line-based
Segment – Market has been covered from 6 viewpoints
1. Comfort & Lighting
2. Appliances
3. Energy Management
4. Entertainment
5. Security
6. Control Connectivity
Product – Market has been covered into 8 viewpoints
1. Smart Speaker
2. Security Cameras
3. Smart Doorbells
4. Smart Lights
5. Smart Door Locks
6. Smart Switches
7. Smart Sensors
8. Other
Distribution Channel – Market has been covered into 3 viewpoints
1. System Integrators
2. Manufacturers
3. Retailers
Customer spending on home automation products – Market has been covered into 5 viewpoints
1. less than 15000
2. 15001-30000
3. 30001-45000
4. 45001-60000
5. exceeding 60001
End User – Market has been covered into 2 viewpoints
1. Residential
2. Commercial
Region – Market has been covered into 4 viewpoints
1. North India
2. East India
3. South India
4. West India
Cities – Market has been covered into14 viewpoints
1. Pune
2. Delhi-NCR
3. Mumbai
4. Hyderabad
5. Ahmadabad
6. Bangalore
7. Chennai
8. Jaipur
9. Kolkata
10. Ludhiana
11. Chandigarh
12. Cochin
13. Coimbatore
14. Others
Company has been covered from 3 Viewpoints:
• Overview
• Recent development
• Revenue
Company Analysis:
1. Koninklijke Philips
2. Schneider Electric
3. Johnson Controls
4. Honeywell
5. ABB
6. Amazon (ECHO)
7. Alphabet
8. Larsen &Tubros
Report Details:
| Report Features | Details |
| Base Year | 2022 |
| Historical Period | 2018 - 2022 |
| Forecast Period | 2023 - 2030 |
| Market | US$ Billion |
| Segment Covered | Network Type, Segment, Product, Distribution Channel, End User, Region, and Cities |
| Companies Covered | Koninklijke Philips, Schneider Electric, Johnson Controls, Honeywell, ABB, Amazon (ECHO), Alphabet, and Larsen &Tubros |
| Customization Scope | 20% Free Customization |
| Post-Sale Analyst Support | 1 Year (52 Weeks) |
| Delivery Format | PDF and Excel through Email (We can also provide the editable version of the report in PPT/Word format on request) |
1. Introduction
2. Research & Methodology
3. Executive Summary
4. Market Dynamics
4.1 Growth Drivers
4.2 Challenges
5. Porter’s Five Forces
5.1 Bargaining Power of Buyers
5.2 Bargaining Power of Suppliers
5.3 Degree of Competition
5.4 Threat of New Entrants
5.5 Threat of Substitutes
6. SWOT Analysis – India Home Automation Market
6.1 Strength
6.2 Weakness
6.3 Opportunity
6.4 Threat
7. India Home Automation Market
8. Market Share – India Home Automation Analysis
8.1 By Network Type
8.2 By Segment Type
8.3 By Product
8.4 By Distribution Channel
8.5 By Customer Spending
8.6 By Region
8.7 By Cities
9. Network Type – India Home Automation Market
9.1 Wired
9.2 Wireless
9.3 Power Line Based
10. Segment Type – India Home Automation Market
10.1 Comfort & Lighting
10.2 Appliances
10.3 Energy Management
10.4 Entertainment
10.5 Security
10.6 Control Connectivity
11. Product – India Home Automation Market
11.1 Smart Speaker Market
11.2 Secuity Camera
11.3 Smart Doorbell
11.4 Smart light
11.5 Smart Door lock
11.6 Smart Switch
11.7 Smart Sensor
11.8 Others
12. Distribution Channel – India Home Automation Market
12.1 System Integrator
12.2 Manufacturer
12.3 Retailer
13. Customer Spending on Home Automation – India Home Automation Market
13.1 Less than 15000
13.2 15001-30000
13.3 30001-45000
13.4 45001-60000
13.5 More than 60001
14. End User – India Home Automation Market
14.1 Residental
14.2 Commercial
15. Region – India Home Automation Market
15.1 North India
15.2 East India
15.3 South India
15.4 West India
16. Cities – India Home Automation Market
16.1 Pune
16.2 Delhi NCR
16.3 Mumbai
16.4 Hydrabad
16.5 Ahemdabad
16.6 Bengluru
16.7 Chennei
16.8 Jaipur
16.9 Kolkata
16.10 Ludhina
16.11 Chandigarh
16.12 Cochin
16.13 Coimbatore
16.14 Others
17. Key Players Analysis
17.1 Koninklijke Philips
17.1.1 Company overview
17.1.2 Sales Analysis
17.1.3 Recent Development
17.2 Schneider Electric
17.2.1 Company overview
17.2.2 Sales Analysis
17.2.3 Recent Development
17.3 Johnson Controls
17.3.1 Company overview
17.3.2 Sales Analysis
17.3.3 Recent Development
17.4 Honeywell
17.4.1 Company overview
17.4.2 Sales Analysis
17.4.3 Recent Development
17.5 ABB
17.5.1 Company overview
17.5.2 Sales Analysis
17.5.3 Recent Development
17.6 Amazon (ECHO)
17.6.1 Company overview
17.6.2 Sales Analysis
17.6.3 Recent Development
17.7 Alphabet
17.7.1 Company overview
17.7.2 Sales Analysis
17.7.3 Recent Development
17.8 Larsen & Tubros
17.8.1 Company overview
17.8.2 Sales Analysis
17.8.3 Recent Development
List of Figures:
Figure-01: India – Home Automation Market (Billion US$), 2018 – 2022
Figure-02: India – Forecast for Home Automation Market (Billion US$), 2023 – 2030
Figure-03: Network Type – Wired Market (Million US$), 2018 – 2022
Figure-04: Network Type – Forecast for Wired Market (Million US$), 2023 – 2030
Figure-05: Network Type – Wireless Market (Million US$), 2018 – 2022
Figure-06: Network Type – Forecast for Wireless Market (Million US$), 2023 – 2030
Figure-07: Network Type – Power Line Based Market (Million US$), 2018 – 2022
Figure-08: Network Type – Forecast for Power Line Based Market (Million US$), 2023 – 2030
Figure-09: Segment Type – Comfort & Lighting Market (Million US$), 2018 – 2022
Figure-10: Segment Type – Forecast for Comfort & Lighting Market (Million US$), 2023 – 2030
Figure-11: Segment Type – Appliances Market (Million US$), 2018 – 2022
Figure-12: Segment Type – Forecast for Appliances Market (Million US$), 2023 – 2030
Figure-13: Segment Type – Energy Management Market (Million US$), 2018 – 2022
Figure-14: Segment Type – Forecast for Energy Management Market (Million US$), 2023 – 2030
Figure-15: Segment Type – Entertainment Market (Million US$), 2018 – 2022
Figure-16: Segment Type – Forecast for Entertainment Market (Million US$), 2023 – 2030
Figure-17: Segment Type – Security Market (Million US$), 2018 – 2022
Figure-18: Segment Type – Forecast for Security Market (Million US$), 2023 – 2030
Figure-19: Segment Type – Control Connectivity Market (Million US$), 2018 – 2022
Figure-20: Segment Type – Forecast for Control Connectivity Market (Million US$), 2023 – 2030
Figure-21: Product – Smart Speaker Market (Million US$), 2018 – 2022
Figure-22: Product – Forecast for Smart Speaker Market (Million US$), 2023 – 2030
Figure-23: Product – Secuity Camera Market (Million US$), 2018 – 2022
Figure-24: Product – Forecast for Secuity Camera Market (Million US$), 2023 – 2030
Figure-25: Product – Smart Doorbell Market (Million US$), 2018 – 2022
Figure-26: Product – Forecast for Smart Doorbell Market (Million US$), 2023 – 2030
Figure-27: Product – Smart light Market (Million US$), 2018 – 2022
Figure-28: Product – Forecast for Smart light Market (Million US$), 2023 – 2030
Figure-29: Product – Smart Door lock Market (Million US$), 2018 – 2022
Figure-30: Product – Forecast for Smart Door lock Market (Million US$), 2023 – 2030
Figure-31: Product – Smart Switch Market (Million US$), 2018 – 2022
Figure-32: Product – Forecast for Smart Switch Market (Million US$), 2023 – 2030
Figure-33: Product – Smart Sensor Market (Million US$), 2018 – 2022
Figure-34: Product – Forecast for Smart Sensor Market (Million US$), 2023 – 2030
Figure-35: Product – Others Market (Million US$), 2018 – 2022
Figure-36: Product – Forecast for Others Market (Million US$), 2023 – 2030
Figure-37: Distribution Channel – System Integrator Market (Million US$), 2018 – 2022
Figure-38: Distribution Channel – Forecast for System Integrator Market (Million US$), 2023 – 2030
Figure-39: Distribution Channel – Manufacturer Market (Million US$), 2018 – 2022
Figure-40: Distribution Channel – Forecast for Manufacturer Market (Million US$), 2023 – 2030
Figure-41: Distribution Channel – Retailer Market (Million US$), 2018 – 2022
Figure-42: Distribution Channel – Forecast for Retailer Market (Million US$), 2023 – 2030
Figure-43: Customer Spending – Home Automation Less than 15000 Market (Million US$), 2018 – 2022
Figure-44: Customer Spending – Forecast for Home Automation Less than 15000 Market (Million US$), 2023 – 2030
Figure-45: Customer Spending – Home Automation 15001-30000 Market (Million US$), 2018 – 2022
Figure-46: Customer Spending – Forecast for Home Automation 15001-30000 Market (Million US$), 2023 – 2030
Figure-47: Customer Spending – Home Automation 30001-45000 Market (Million US$), 2018 – 2022
Figure-48: Customer Spending – Forecast for Home Automation 30001-45000 Market (Million US$), 2023 – 2030
Figure-49: Customer Spending – Home Automation 45001-60000 Market (Million US$), 2018 – 2022
Figure-50: Customer Spending – Forecast for Home Automation 45001-60000 Market (Million US$), 2023 – 2030
Figure-51: Customer Spending – Home Automation More than 60001 Market (Million US$), 2018 – 2022
Figure-52: Customer Spending – Forecast for Home Automation More than 60001 Market (Million US$), 2023 – 2030
Figure-53: End User – Residental Automation Market (Million US$), 2018 – 2022
Figure-54: End User – Forecast for Residental Automation Market (Million US$), 2023 – 2030
Figure-55: End User – Commercial Automation Market (Million US$), 2018 – 2022
Figure-56: End User – Forecast for Commercial Automation Market (Million US$), 2023 – 2030
Figure-57: North India – Home Automation Market (Million US$), 2018 – 2022
Figure-58: North India – Forecast for Home Automation Market (Million US$), 2023 – 2030
Figure-59: East India – Home Automation Market (Million US$), 2018 – 2022
Figure-60: East India – Forecast for Home Automation Market (Million US$), 2023 – 2030
Figure-61: South India – Home Automation Market (Million US$), 2018 – 2022
Figure-62: South India – Forecast for Home Automation Market (Million US$), 2023 – 2030
Figure-63: West India – Home Automation Market (Million US$), 2018 – 2022
Figure-64: West India – Forecast for Home Automation Market (Million US$), 2023 – 2030
Figure-65: Pune – Home Automation Market (Million US$), 2018 – 2022
Figure-66: Pune – Forecast for Home Automation Market (Million US$), 2023 – 2030
Figure-67: Delhi NCR – Home Automation Market (Million US$), 2018 – 2022
Figure-68: Delhi NCR – Forecast for Home Automation Market (Million US$), 2023 – 2030
Figure-69: Mumbai – Home Automation Market (Million US$), 2018 – 2022
Figure-70: Mumbai – Forecast for Home Automation Market (Million US$), 2023 – 2030
Figure-71: Hydrabad – Home Automation Market (Million US$), 2018 – 2022
Figure-72: Hydrabad – Forecast for Home Automation Market (Million US$), 2023 – 2030
Figure-73: Ahemdabad – Home Automation Market (Million US$), 2018 – 2022
Figure-74: Ahemdabad – Forecast for Home Automation Market (Million US$), 2023 – 2030
Figure-75: Bengluru – Home Automation Market (Million US$), 2018 – 2022
Figure-76: Bengluru – Forecast for Home Automation Market (Million US$), 2023 – 2030
Figure-77: Chennei – Home Automation Market (Million US$), 2018 – 2022
Figure-78: Chennei – Forecast for Home Automation Market (Million US$), 2023 – 2030
Figure-79: Jaipur – Home Automation Market (Million US$), 2018 – 2022
Figure-80: Jaipur – Forecast for Home Automation Market (Million US$), 2023 – 2030
Figure-81: Kolkata – Home Automation Market (Million US$), 2018 – 2022
Figure-82: Kolkata – Forecast for Home Automation Market (Million US$), 2023 – 2030
Figure-83: Ludhina – Home Automation Market (Million US$), 2018 – 2022
Figure-84: Ludhina – Forecast for Home Automation Market (Million US$), 2023 – 2030
Figure-85: Chandigarh – Home Automation Market (Million US$), 2018 – 2022
Figure-86: Chandigarh – Forecast for Home Automation Market (Million US$), 2023 – 2030
Figure-87: Cochin – Home Automation Market (Million US$), 2018 – 2022
Figure-88: Cochin – Forecast for Home Automation Market (Million US$), 2023 – 2030
Figure-89: Coimbatore – Home Automation Market (Million US$), 2018 – 2022
Figure-90: Coimbatore – Forecast for Home Automation Market (Million US$), 2023 – 2030
Figure-91: Others – Cities Home Automation Market (Million US$), 2018 – 2022
Figure-92: Others – Forecast for Cities Home Automation Market (Million US$), 2023 – 2030
Figure-93: Koninklijke Philips – Global Revenue (Billion US$), 2018 – 2022
Figure-94: Koninklijke Philips – Forecast for Global Revenue (Billion US$), 2023 – 2030
Figure-95: Schneider Electric – Global Revenue (Billion US$), 2018 – 2022
Figure-96: Schneider Electric – Forecast for Global Revenue (Billion US$), 2023 – 2030
Figure-97: Johnson Controls – Global Revenue (Billion US$), 2018 – 2022
Figure-98: Johnson Controls – Forecast for Global Revenue (Billion US$), 2023 – 2030
Figure-99: Honeywell – Global Revenue (Billion US$), 2018 – 2022
Figure-100: Honeywell – Forecast for Global Revenue (Billion US$), 2023 – 2030
Figure-101: ABB – Global Revenue (Billion US$), 2018 – 2022
Figure-102: ABB – Forecast for Global Revenue (Billion US$), 2023 – 2030
Figure-103: Amazon(ECHO) – Global Revenue (Billion US$), 2018 – 2022
Figure-104: Amazon(ECHO) – Forecast for Global Revenue (Billion US$), 2023 – 2030
Figure-105: Alphabet – Global Revenue (Billion US$), 2018 – 2022
Figure-106: Alphabet – Forecast for Global Revenue (Billion US$), 2023 – 2030
Figure-107: Larsen &Tubros – Global Revenue (Billion US$), 2018 – 2022
Figure-108: Larsen &Tubros – Forecast for Global Revenue (Billion US$), 2023 – 2030
List of Tables:
Table-01: India – Home Automation Market Share by Network Type (Percent), 2018 – 2022
Table-02: India – Forecast for Home Automation Market Share by Network Type (Percent), 2023 – 2030
Table-03: India – Home Automation Market Share by Segment Type (Percent), 2018 – 2022
Table-04: India – Forecast for Home Automation Market Share by Segment Type (Percent), 2023 – 2030
Table-05: India – Home Automation Market Share by Product (Percent), 2018 – 2022
Table-06: India – Forecast for Home Automation Market Share by Product (Percent), 2023 – 2030
Table-07: India – Home Automation Market Share by Distribution Channel (Percent), 2018 – 2022
Table-08: India – Forecast for Home Automation Market Share by Distribution Channel (Percent), 2023 – 2030
Table-09: India – Home Automation Market Share by Customer Spending (Percent), 2018 – 2022
Table-10: India – Forecast for Home Automation Market Share by Customer Spending (Percent), 2023 – 2030
Table-11: India – Home Automation Market Share by End User (Percent), 2018 – 2022
Table-12: India – Forecast for Home Automation Market Share by End User (Percent), 2023 – 2030
Table-13: India – Home Automation Market Share by Region (Percent), 2018 – 2022
Table-14: India – Forecast for Home Automation Market Share by Region (Percent), 2023 – 2030
Table-15: India – Home Automation Market Share by Cities (Percent), 2018 – 2022
Table-16: India – Forecast for Home Automation Market Share by Cities (Percent), 2023 – 2030
Reach out to us
Call us on
USA: +1-678-302-0700
INDIA: +91-120-421-9822
Drop us an email at
info@renub.com