United States Milk Powder Market Report by Type, Application, State and Company Analysis 2026-2034
Buy NowUnited States Milk Powder Market Size and Forecast 2026-2034
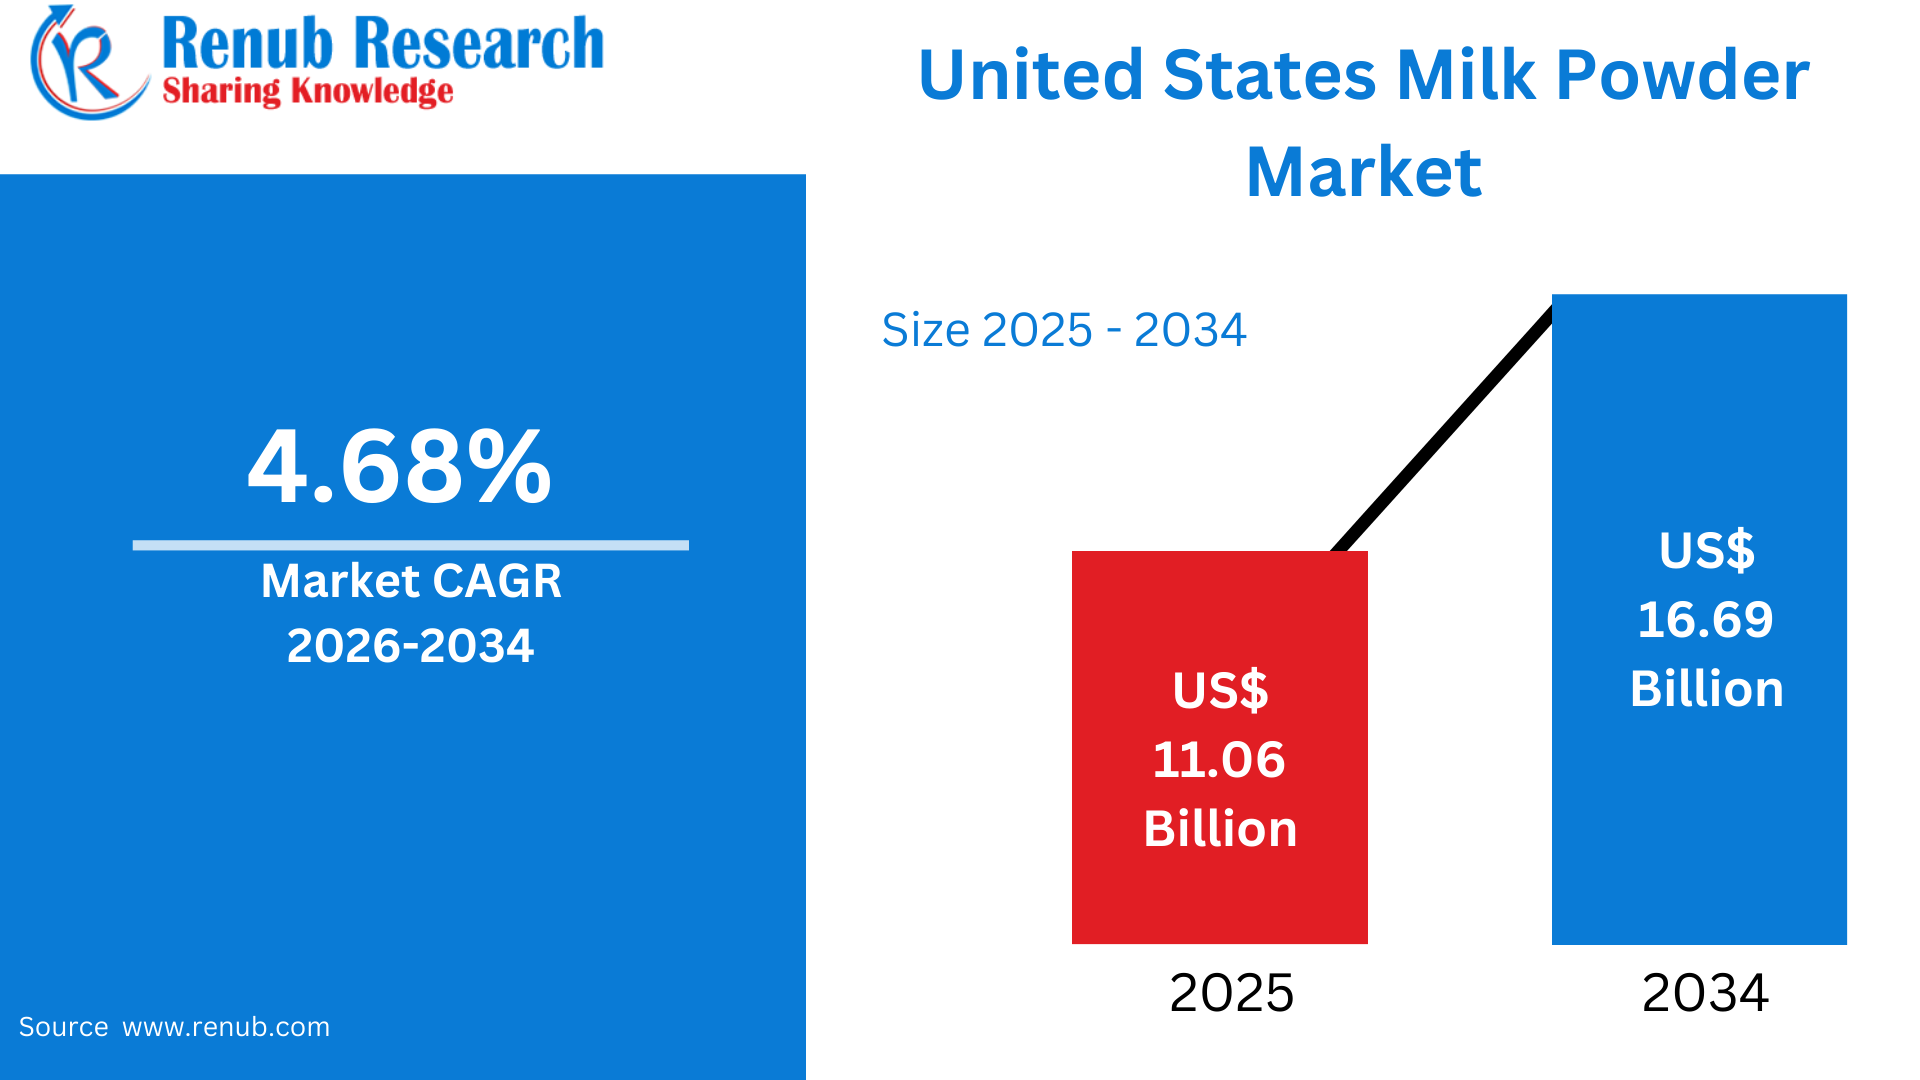
United States Milk Powder Market is expected to reach US$ 16.69 billion by 2034 from US$ 11.06 billion in 2025, with a CAGR of 4.68% from 2026 to 2034. Rising demand for convenient, shelf-stable dairy ingredients, expanding use in infant nutrition, sports nutrition, and bakery products, along with improved processing technologies and strong export activity, is driving steady growth in the United States milk powder market.
United States Milk Powder Industry Overview
Milk powder is a dehydrated dairy product created by removing water from liquid milk through evaporation and spray-drying. This process significantly extends shelf life without requiring refrigeration, making it ideal for regions with limited cold-chain infrastructure. Milk powder retains most of the nutritional components of fresh milk, including proteins, carbohydrates, calcium, vitamins, and essential minerals. It is widely used in infant formulas, bakery items, confectionery, beverages, ready-to-eat foods, and nutritional supplements. Its long shelf stability, ease of transportation, lightweight form, and versatile applications contribute to its extensive demand across consumer, industrial, and foodservice sectors.
The United States milk powder market is expanding due to rising demand for high-protein, shelf-stable dairy ingredients used in packaged foods, sports nutrition, beverages, and infant formula. Growth in bakery and confectionery manufacturing, along with increased consumption of ready-to-eat products, drives strong industry uptake. Improved dairy processing technologies such as low-heat and instantization techniques enhance product quality, digestibility, and reconstitution. Additionally, U.S. dairy exporters benefit from strong international demand for skim and whole milk powder, especially in Asia and the Middle East. Expanding e-commerce distribution and growing adoption in household cooking further contribute to market momentum.
Growth Drivers for the United States Milk Powder Market
Expanding Use in Infant Nutrition and Specialty Formulations
The United States milk powder market is significantly driven by its rising use in infant formula, toddler nutrition, and medical nutrition products. Parents are increasingly seeking high-quality, stable, and nutrient-dense dairy inputs, and milk powder offers consistent composition, safe handling, and reliable availability. Infant formula manufacturers depend heavily on skim milk powder, whole milk powder, casein, and whey-based derivatives for product formulation. Growth in specialty formulas—such as lactose-reduced, organic, A2-based, and hypoallergenic products—further increases demand for advanced milk powder varieties. The premiumization trend in baby food, coupled with higher birth rates among select demographic groups, continues to support long-term consumption. Additionally, U.S. dairy processors supply large volumes of high-specification powders for global infant nutrition markets, strengthening export revenues. With improving dairy safety regulations and expanding technological capabilities in powder standardization, the segment is expected to remain a core driver of the U.S. market for at least the next decade.
Growing Demand from Bakery, Confectionery, and Ready-to-Eat Food Manufacturing
A major growth catalyst for the U.S. milk powder market is its widespread adoption across bakery, confectionery, and ready-to-eat (RTE) food sectors. Manufacturers rely on milk powder for consistent flavor, texture enhancement, browning properties, and moisture control—qualities that fresh liquid milk cannot provide due to its perishability. As consumers increasingly purchase packaged snacks, cakes, chocolates, biscuits, and desserts, food producers boost milk powder usage to maintain product uniformity and extend shelf stability. The rise of meal kits, instant foods, and on-the-go snacks also strengthens demand for milk-based ingredients that support long storage and easy transport. Moreover, clean-label and high-protein trends motivate companies to incorporate skim milk powder and whole milk powder into reformulated recipes. With continued growth in industrial food production and strong demand from large bakery clusters in states like California and Illinois, this segment remains a dominant driver of the U.S. milk powder industry.
Rising Demand in Sports Nutrition, Protein Foods & International Exports
Milk powder demand is increasing rapidly due to the expanding sports nutrition, protein-fortified foods, and dietary supplement industries. Athletes and health-conscious consumers prefer milk-derived proteins such as casein and whey because they provide superior absorption, muscle-building properties, and balanced amino-acid profiles. Powdered dairy ingredients serve as core components in protein shakes, bars, meal replacements, and nutritional beverages. Additionally, the United States is a leading global exporter of milk powder, supplying markets in China, Southeast Asia, the Middle East, and Africa. Strong global demand—driven by food manufacturing growth and increasing dairy imports in emerging economies—continues to boost U.S. production. Technological advancements such as membrane filtration, microencapsulation, and instantization enhance solubility and product performance, strengthening the competitiveness of U.S. dairy powders internationally. As fitness lifestyles gain popularity and export markets expand, this driver remains vital to long-term market growth.
Challenges in the United States Milk Powder Market
Price Volatility in Dairy Supply and Input Costs
One major challenge for the U.S. milk powder market is high price volatility driven by fluctuations in raw milk supply. Factors such as feed prices, drought conditions, transportation costs, and changing farm economics influence the cost of milk production. Additionally, global dairy trade dynamics—including export restrictions, currency shifts, and geopolitical uncertainties—impact demand for U.S. milk powder abroad, creating unpredictable revenue cycles for producers. Inflationary pressures on labor, packaging, and energy further raise operating costs, squeezing processor margins. This volatility complicates long-term planning for manufacturers and distributors, who must constantly adjust contract pricing and supply chain strategies to remain competitive and maintain profitability.
Competition from Alternatives and Shift Toward Plant-Based Products
The rising popularity of plant-based alternatives—such as soy, almond, oat, and coconut powders—poses a challenge to the traditional milk powder industry. Consumers seeking vegan, lactose-free, or allergen-friendly options increasingly choose plant-based products in beverages, bakery items, and infant-appropriate formulations. Foodservice chains and packaged food producers are also expanding their non-dairy offerings, reducing reliance on traditional dairy ingredients. Additionally, environmental concerns around greenhouse gas emissions, water usage, and animal welfare issues contribute to a shift toward non-dairy categories. Although dairy remains nutritionally superior in many applications, this competitive pressure requires milk powder producers to innovate, improve sustainability practices, and adopt premium positioning to retain consumer and industrial demand.
California Milk Powder Market
The California milk powder market benefits from its status as the nation’s largest dairy producer, supplying extensive volumes of liquid milk for powder processing. The state’s strong food and beverage manufacturing sector—including bakery, confectionery, and nutritional supplement companies—drives consistent industrial demand. California also hosts major export hubs, enabling efficient shipment of skim and whole milk powder to Asia-Pacific markets. Growing interest in sports nutrition and protein-fortified foods further supports consumption across urban centers like Los Angeles and San Francisco. However, water scarcity, strict environmental regulations, and increasing production costs challenge growth. Despite these constraints, California remains one of the most influential contributors to the overall U.S. milk powder supply chain.
Texas Milk Powder Market
The Texas milk powder market is expanding due to rising dairy production, strong transportation infrastructure, and growing food manufacturing activity. Texas is one of the fastest-growing dairy states, providing a reliable raw-milk base for powder processing facilities. Demand is supported by increasing consumption of packaged foods, sports nutrition products, and ready-to-eat items across major metropolitan areas such as Dallas, Houston, and Austin. The state’s proximity to Mexico also strengthens cross-border demand for U.S. dairy powders. Investments in advanced dairy processing plants and agricultural modernization further improve efficiency. While challenges such as heat-related stress on livestock and volatile feed costs persist, Texas remains a key growth engine for milk powder production and distribution.
New York Milk Powder Market
The New York milk powder market is supported by the state’s long-established dairy farming base and strong presence in yogurt, cheese, and food manufacturing industries. Skim milk powder is widely used in bakery, confectionery, and specialty food production across New York City and upstate manufacturing hubs. Additionally, demand from nutrition companies, meal-replacement brands, and protein beverage producers continues to grow. The state's proximity to major ports facilitates export shipments to Europe and the Middle East. However, New York faces challenges such as high operational costs, stringent regulations, and declining small dairy farms. Despite these pressures, the state remains an important contributor to value-added dairy production, including powder-based ingredients.
Florida Milk Powder Market
The Florida milk powder market is driven primarily by strong consumer demand for packaged foods, nutritional supplements, and bakery products rather than large-scale local dairy production. Florida relies heavily on imported milk powder from other states to support its extensive foodservice and tourism-driven hospitality sectors. The bakery and confectionery industries in cities like Miami, Orlando, and Tampa incorporate powdered milk in large volumes due to its stability in warm climates. Additionally, Florida’s booming sports and fitness culture increases consumption of protein powders and dairy-based supplements. Despite limited dairy farming and higher logistics costs, the state remains a high-consumption market for milk powder-based products, supported by steady population growth and year-round tourism demand.
Recent Developments in United States Milk Powder Market
- In March 2023, Dairy Farmers of America partnered with Good Culture to broaden its range of probiotic milk offerings, aiming to strengthen its presence in the functional dairy category.
- In January 2023, Dairy Farmers of America (DFA) expanded its processing capabilities by acquiring two extended shelf-life (ESL) manufacturing facilities from SmithFoods, enhancing its capacity to meet rising demand for long-lasting dairy beverages.
- Also in January 2023, Royal FrieslandCampina N.V. introduced a new line of fortified milk powder products under one of its established global brands. The range, enriched with essential vitamins and minerals, is designed to support the nutritional requirements of targeted consumer groups such as older adults and athletes.
Market Segmentation
Type
- Whole Milk Powder
- Skimmed Milk Powder
- Dairy Whitener Powder
- Buttermilk Powder
- Fat-Filled Milk Powder
- Other Milk Powder
Application
- Nutritional Food
- Infant Formulas
- Confectionaries
- Baked Sweets
- Savories
- Others
Top States
- California
- Texas
- New York
- Florida
- Illinois
- Pennsylvania
- Ohio
- Georgia
- New Jersey
- Washington
- North Carolina
- Massachusetts
- Virginia
- Michigan
- Maryland
- Colorado
- Tennessee
- Indiana
- Arizona
- Minnesota
- Wisconsin
- Missouri
- Connecticut
- South Carolina
- Oregon
- Louisiana
- Alabama
- Kentucky
- Rest of United States
All the Key players have been covered from 5 Viewpoints:
- Overviews
- Key Person
- Recent Developments
- SWOT Analysis
- Revenue Analysis
Company Analysis:
- Dairy Farmers of America Inc.
- Darigold
- Cargill Corporation
- The Kraft Heinz Company (U.S)
- Conagra Brands Inc.
- Land O'Lakes, Inc.
- Schreiber Foods Inc.
- California Dairies Inc
Report Details:
| Report Features | Details |
| Base Year |
2025 |
| Historical Period |
2022 - 2025 |
| Forecast Period |
2026 - 2034 |
| Market |
US$ Billion |
| Segment Covered |
Type, Application and Countries |
| Countries Covered |
|
| Companies Covered |
|
| Customization Scope |
20% Free Customization |
| Post-Sale Analyst Support |
1 Year (52 Weeks) |
| Delivery Format |
PDF and Excel through Email (We can also provide the editable version of the report in PPT/Word format on request) |
Customization Services available
- Analysis of Market Size and Its Segments
- More Company Profiles (Upto 10 without any additional cost):
- Additional Countries (Other than mentioned Countries):
- Region/Country Specific Reports:
- Market Entry Strategy:
- Region-Specific Market Dynamics:
- Regional Market Share Analysis:
- Trade Analysis:
- Production Insights:
- Others Customized Requests:
For more information contact our analysts.
Need More Assistance?
- Talk to our analysts to get more precious information on the current market trends.
- Include more countries and segments and customize the report based on the final requirement.
- Get a competitive advantage in your industry by knowing the report findings and making a positive impact on your revenues and operations.
- Our analysts are always ready to provide more help and pertinent information if you need any additional assistance.