United States Home Infusion Market Size and Share Analysis - Growth Trends and Forecast Report 2025-2033
Buy NowUnited States Home Infusion Therapy Market Trends & Summary
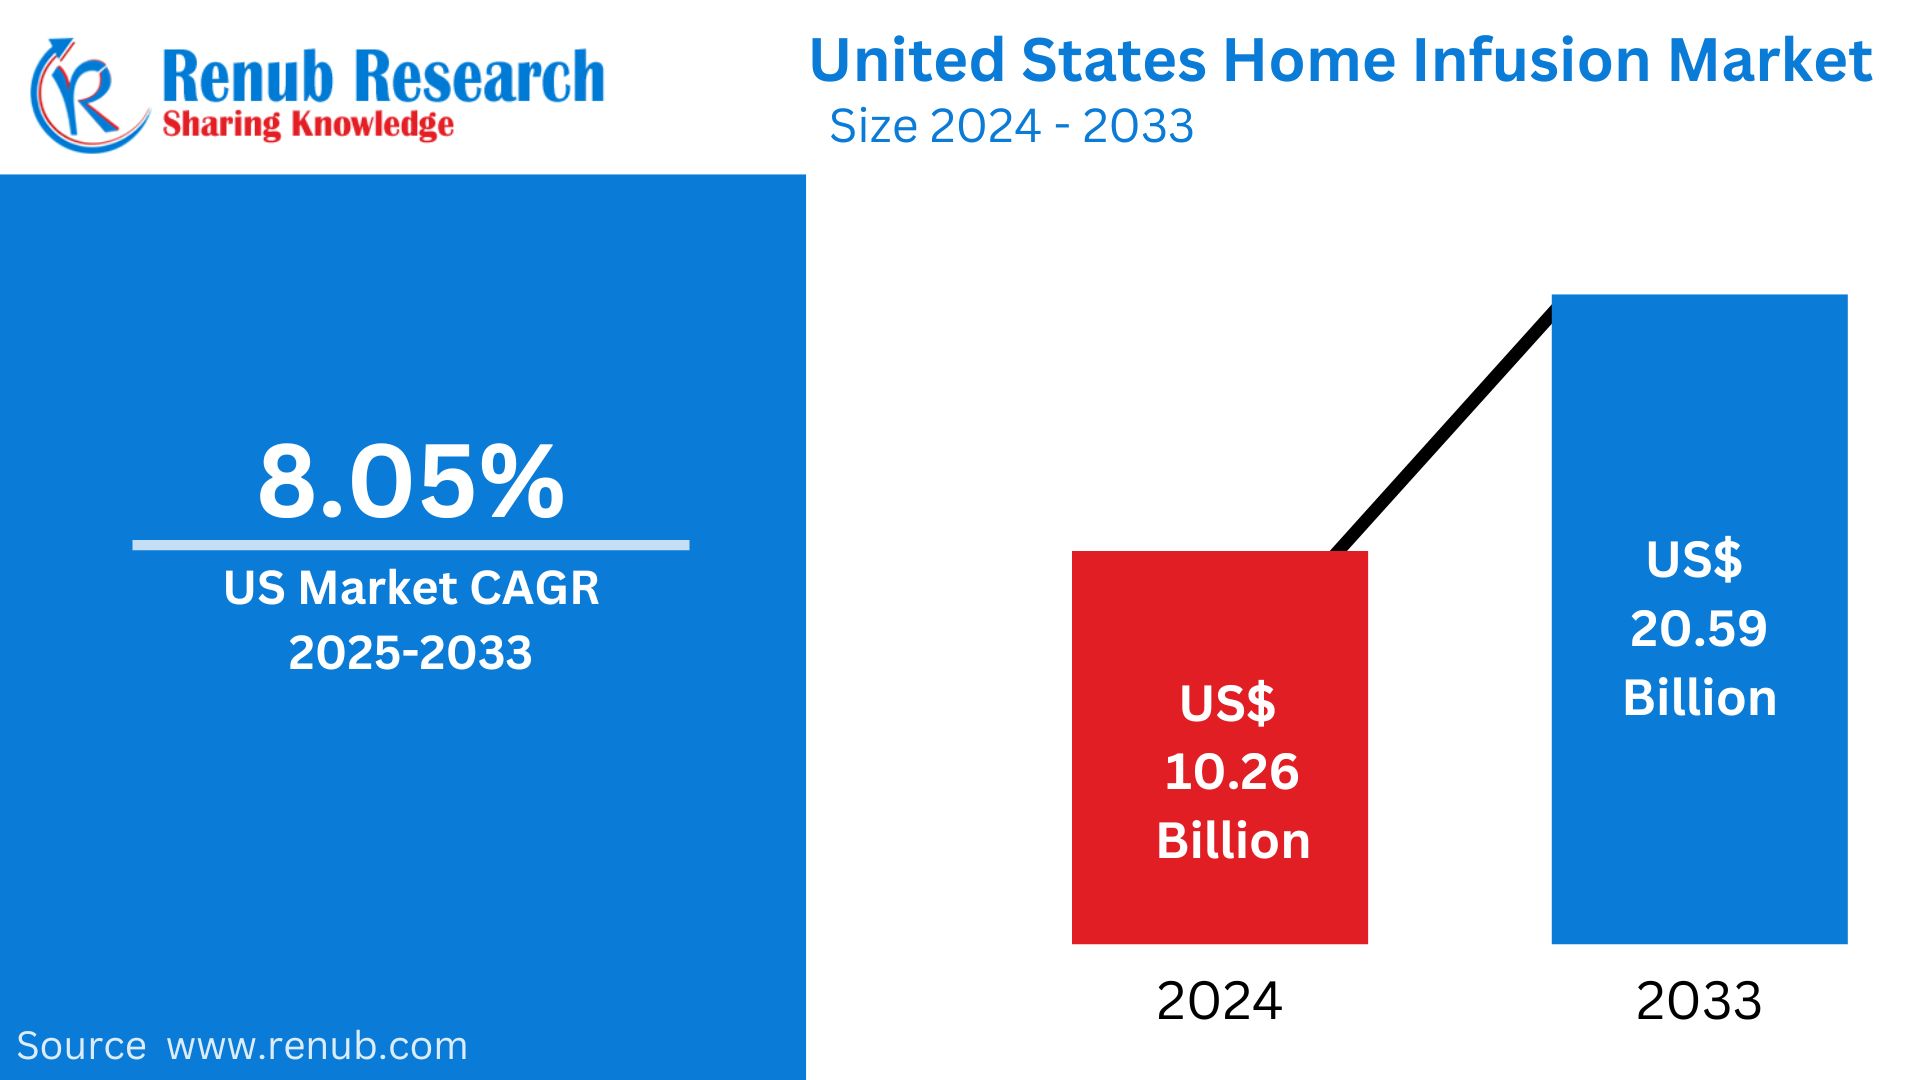
The United States home infusion therapy market is projected to reach approximately US$ 20.59 billion by 2033, up from US$ 10.26 billion in 2024, with a compound annual growth rate (CAGR) of 8.05% from 2025 to 2033. This growth is driven by the increasing prevalence of chronic diseases, advancements in home healthcare technology, and a rising preference for cost-effective, patient-centric treatment options.
The report United States Home Infusion Therapy Market & Forecast covers by Application (Anti-Infective, Endocrinology, Hydration Therapy, Chemotherapy, Enteral Nutrition, Parenteral Nutrition, Specialty Pharmaceuticals, and Others), Product (Infusion Pumps, Intravenous Sets, IV Cannulas, Needleless Connectors), States and Company Analysis 2025-2033.
United States Home Infusion Therapy Market Outlooks
Home infusion therapy is a healthcare service where patients receive intravenous (IV) or injectable medications at home rather than in a hospital or clinic. This therapy allows individuals to receive treatments such as antibiotics, chemotherapy, pain management, and nutrition support in the comfort of their own homes. Home infusion therapy has gained popularity in the United States due to its convenience, improved patient comfort, and cost-effectiveness.
In the U.S., home infusion therapy is used for various medical conditions, including chronic illnesses, infections, cancer, autoimmune diseases, and postoperative care. It allows patients to receive specialized treatments while maintaining their independence and reducing hospital stays. Healthcare providers, including nurses and pharmacists, administer these therapies, ensuring the safety and effectiveness of the treatments. Factors such as the rising prevalence of chronic diseases, increased technological advancements, and a patient-centric approach in the United States are driving the growth of home infusion therapy in the country. Further, personalized care and better outcomes for patients have led to increased adoption across the country.
Growth Drivers in the United States Home Infusion Therapy Market
Growing Prevalence of Chronic Diseases
The increasing prevalence of chronic illnesses, including diabetes, cancer, and cardiovascular diseases, is significantly fueling the demand for home infusion therapy. These long-term medical conditions often necessitate ongoing treatment and management, which can be effectively administered in the comfort of the patient's own home. This approach not only minimizes the need for extended hospital stays—thus alleviating the financial burden on healthcare systems—but also enhances patient comfort and quality of life. Home infusion therapy offers a practical solution that empowers patients to manage their health more conveniently and with greater autonomy. The U.S. Census Bureau projects that the population aged 65 and older will double from 52 million in 2018 to 95 million by 2060, representing 23% of the total population. This demographic shift is expected to drive market growth. Additionally, the CDC reports that 70% of individuals receiving home care are 65 and older. The Medicare Payment Advisory Commission forecasts that Medicare enrollment will increase by over 50% in the next 15 years, exceeding 80 million beneficiaries by 2030, up from 54 million in 2015.
Technological Advancements in Infusion Devices
Recent advancements in infusion devices, particularly the development of portable infusion pumps and sophisticated monitoring systems, have significantly improved the safety and effectiveness of home infusion therapy. All the cutting-edge advanced technologies enable their treatment providers with precision in dealing with treatments they offer to assure patients receive them in the recommended dosages to be administered timely. This explains why these products do not merely advance patient care and outcomes, but also explain the growth growth of the entire market in that vital area in healthcare. According to a related announcement in November 2023, Omnix Medical said U.S. FDA had approved. FDA had sanctioned the planned phase II study for its innovative anti-infective drug, OMN6.
Patient Centered Care on the Rise
This trend of the personalized healthcare practice is driving a wave of infusion therapy at homes across the U.S. because this new paradigm allows patients to receive critical and life-altering medical treatments under the comfort of their own homes thereby creating a much more familiar, reassuring environment. Both patients and healthcare providers appreciate the numerous benefits of this method, including the high-quality care it offers. As a result, patients tend to report greater satisfaction and show improved adherence to their therapy regimens, positively influencing their health outcomes. For example, data from BioMatrix Specialty Pharmacy as of March 2023 indicated that home infusion therapy is beneficial because it carries less risk of infection and is beneficial to the patient's physical and mental health. Furthermore, home infusion is likely to be cheaper for both patients and payers in the short run by avoiding more expensive facilities.
Difficulties Facing the US Home Infusion Therapy Market
High Costs of Infusion Equipment and Therapies
Home infusion therapy offers a more cost-effective alternative to traditional hospital care, but it comes with its own set of challenges, particularly concerning the initial expenses. The upfront costs associated with infusion devices and the necessary medications can be quite significant, creating financial hurdles for many patients. Additionally, the complexities surrounding reimbursement processes often complicate matters, making it even more difficult for a broader range of patients to access and benefit from this valuable treatment option.
Limited Skilled Workforce Availability
The increasing need for home infusion therapy is becoming increasingly urgent, yet it is hindered by a significant shortage of skilled healthcare professionals, including nurses and pharmacists, who are essential for delivering safe and effective care. This scarcity challenges both the quality of services provided and the accessibility of these vital treatments in various regions, especially those already underserved. As the demand continues to rise, the strain on existing healthcare resources becomes more pronounced, impacting patient outcomes and the overall efficiency of home healthcare systems.
United States Anti-Infective Home Infusion Therapy Market
The U.S. market for anti-infective home infusion therapy is experiencing robust growth, largely fueled by the rising incidence of infections such as sepsis and osteomyelitis, which necessitate extended courses of antibiotic treatment. Home infusion therapy offers a significant advantage by allowing patients to receive these critical therapies in the comfort of their own homes, rather than enduring extended hospital stays. This approach not only helps to alleviate the strain on healthcare facilities but also contributes to lower overall treatment costs and enhances the recovery experience for patients, promoting greater independence and a better quality of life during their healing process.
United States Chemotherapy Home Infusion Therapy Market
The chemotherapy home infusion therapy market in the United States is experiencing significant growth, fueled by advancements in portable infusion devices that offer convenience and flexibility for patients. As the number of individuals battling cancer continues to rise, more patients are opting to receive their treatments in the comfort of their own homes. This approach not only helps to minimize the need for frequent hospital visits but also contributes positively to the patients’ emotional well-being, allowing them to maintain a sense of normalcy and comfort during a challenging time in their lives.
United States Infusion Pumps Market
The U.S. infusion pump market is experiencing significant growth, driven by the emergence of advanced smart pumps that feature wireless connectivity and real-time monitoring capabilities. These innovative devices not only enhance the precision of medication delivery but also prioritize patient safety by minimizing the risk of errors. Furthermore, their design and functionality align with the increasing trend towards home healthcare, allowing patients to receive necessary treatments in the comfort of their own homes while maintaining optimal oversight and care. For instance, in January 2024, Infuzamed, a medical devices company, launched a wearable infusion pump with advanced remote monitoring capabilities in the U.S. market.
United States Intravenous Sets Market
The market for intravenous (IV) sets in the United States is experiencing significant growth, driven by an increasing demand for home healthcare solutions. These IV sets play a crucial role in the safe and effective administration of medications, making them essential for home infusion therapy. They provide vital support for patients managing chronic illnesses and those recovering from surgeries, ensuring that they receive the necessary treatment in the comfort of their own homes. With an increasingly accessible and patient-centered delivery system of healthcare, the need for IV sets at home is critical.
California Home Infusion Therapy Market
There is a growth trend in the home infusion therapy market of California as well, caused by a mix of its highly diverse and massive population with its strong healthcare setup. High prevalence of chronic diseases and continuous medical care is required across the state. Furthermore, state-led initiatives and policies aimed at promoting and expanding home healthcare services are playing a crucial role in facilitating this market expansion. As more patients seek convenient and effective treatment options within the comfort of their homes, the demand for home infusion therapy continues to rise, reflecting a shift towards more personalized and accessible healthcare solutions.
New York Home Infusion Therapy Market
The home infusion therapy market in New York is experiencing significant growth, fueled by the rising healthcare demands in both urban and rural communities. As the state prioritizes alleviating hospital overcrowding, there is a concerted effort to improve patient care through the expansion of home-based medical services. This focus not only addresses the immediate needs of patients who require ongoing treatment but also promotes a more personalized and convenient approach to healthcare that benefits a diverse population.
Texas Home Infusion Therapy Market
Texas is currently experiencing a significant increase in the adoption of home infusion therapy, driven by its expansive population and the growing incidence of chronic health conditions among its residents. This trend is further bolstered by state initiatives aimed at enhancing healthcare access, particularly in rural communities, which are often underserved. These efforts not only facilitate the delivery of vital medical treatments directly to patients' homes but also promote a more comprehensive approach to managing long-term health issues, ultimately contributing to the overall growth of the home infusion therapy market in the state.
Florida Home Infusion Therapy Market
The home infusion therapy market in Florida is experiencing notable expansion, driven largely by the state’s increasingly aging population and the growing preference for home-based healthcare services. This demographic shift has created a significant demand for therapies that allow patients to receive medical treatments in the comfort of their own homes. Additionally, Florida's strong focus on cost-effective, patient-centered care is playing a crucial role in shaping the market’s growth, as healthcare providers and patients alike seek alternatives that enhance quality of life while managing healthcare costs. This evolving landscape presents both challenges and opportunities in delivering advanced medical therapies directly to patients’ residences.
United States Home Infusion Market Segments
By Application – Market is broken up into 8 viewpoints.
1. Anti-Infective
2. Endocrinology
3. Hydration Therapy
4. Chemotherapy
5. Enteral Nutrition
6. Parenteral Nutrition
7. Specialty Pharmaceuticals
8. Others
By Product – Market is broken up into 4 viewpoints.
1. Infusion Pumps
2. Intravenous Sets
3. IV Cannulas
4. Needleless Connectors
By States – Market is broken up into 29 viewpoints.
1. California
2. Texas
3. New York
4. Florida
5. Illinois
6. Pennsylvania
7. Ohio
8. Georgia
9. New Jersey
10. Washington
11. North Carolina
12. Massachusetts
13. Virginia
14. Michigan
15. Maryland
16. Colorado
17. Tennessee
18. Indiana
19. Arizona
20. Minnesota
21. Wisconsin
22. Missouri
23. Connecticut
24. South Carolina
25. Oregon
26. Louisiana
27. Alabama
28. Kentucky
29. Rest of United States
All companies have been covered from 3 viewpoints:
• Overview
• Recent Development
• Revenue
Company Analysis:
1. Baxter International Inc.
2. Becton Dickinson and Company
3. Eli Lilly & Company
4. Fresenius SE & Co. KGaA
5. ICU Medical Inc.
6. Option Care Health Inc.
7. Terumo Corporation
Report Details:
| Report Features | Details |
| Base Year |
2024 |
| Historical Period |
2020 - 2024 |
| Forecast Period |
2025 - 2033 |
| Market |
US$ Billion |
| Segment Covered |
Application, Product and States |
| States Covered |
1. California |
| Companies Covered |
1. Baxter International Inc. |
| Customization Scope |
20% Free Customization |
| Post-Sale Analyst Support |
1 Year (52 Weeks) |
| Delivery Format |
PDF and Excel through Email (We can also provide the editable version of the report in PPT/Word format on request) |
Key Questions Answered in This Report:
-
What is the projected market size of the U.S. home infusion therapy market by 2033?
-
What is the expected CAGR of the U.S. home infusion therapy market from 2025 to 2033?
-
Which factors are driving the growth of home infusion therapy in the U.S.?
-
What are the main challenges facing the U.S. home infusion therapy market?
-
How does home infusion therapy benefit patients compared to hospital-based treatments?
-
Which application segments are included in the U.S. home infusion therapy market analysis?
-
What technological advancements are influencing the growth of home infusion therapy?
-
Which states have been analyzed in the U.S. home infusion therapy market report?
-
What role does the aging population play in the demand for home infusion therapy?
-
Which companies are leading the U.S. home infusion therapy market?
Customization Services available
- Analysis of Market Size and Its Segments
- More Company Profiles (Upto 10 without any additional cost):
- Additional Countries (Other than mentioned Countries):
- Region/Country Specific Reports:
- Market Entry Strategy:
- Region-Specific Market Dynamics:
- Regional Market Share Analysis:
- Trade Analysis:
- Production Insights:
- Others Customized Requests:
For more information contact our analysts.
Need More Assistance?
- Talk to our analysts to get more precious information on the current market trends.
- Include more countries and segments and customize the report based on the final requirement.
- Get a competitive advantage in your industry by knowing the report findings and making a positive impact on your revenues and operations.
- Our analysts are always ready to provide more help and pertinent information if you need any additional assistance.