1. Introduction
2. Research & Methodology
3. Executive Summary
4. Market Dynamics
4.1 Growth Drivers
4.2 Challenges
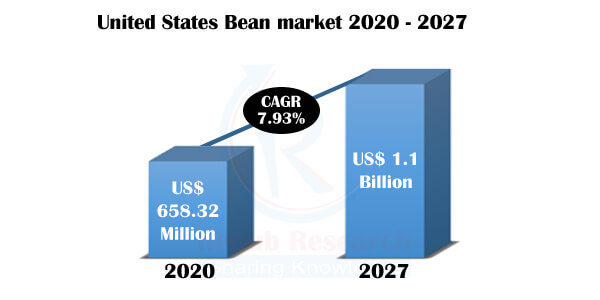
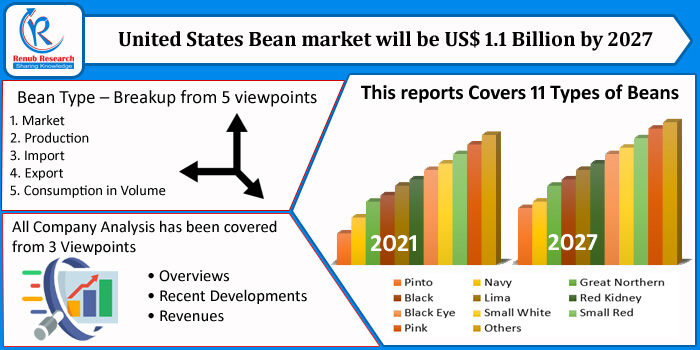
5. Market Analysis – United States Beans
6. Volume Analysis - United States Beans
6.1 Production
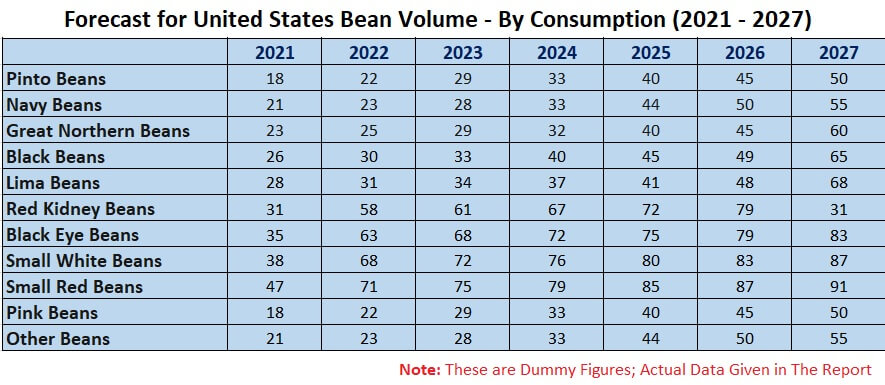
6.2 Consumption
6.3 Import
6.4 Export
7. Share Analysis
7.1 Market Share
7.1.1 By Consumption
7.2 Volume Share
7.2.1 By Production
7.2.2 By Import
7.2.3 By Export
8. Market & Volume Analysis – By Bean Type
8.1 Pinto Beans
8.1.1 Market
8.2 Volume
8.2.1 Production
8.2.2 Consumption
8.2.3 Import
8.2.4 Export
8.3 Navy Beans
8.3.1 Market
8.4 Volume
8.4.1 Production
8.4.2 Consumption
8.4.3 Import
8.4.4 Export
8.5 Great Northern Beans
8.5.1 Market
8.6 Volume
8.6.1 Production
8.6.2 Consumption
8.6.3 Import
8.6.4 Export
8.7 Black Beans
8.7.1 Market
8.8 Volume
8.8.1 Production
8.8.2 Consumption
8.8.3 Import
8.8.4 Export
8.9 Lima Beans
8.9.1 Market
8.10 Volume
8.10.1 Production
8.10.2 Consumption
8.10.3 Import
8.10.4 Export
8.11 Red Kidney Beans
8.11.1 Market
8.12 Volume
8.12.1 Production
8.12.2 Consumption
8.12.3 Import
8.12.4 Export
8.13 Black Eye Beans
8.13.1 Market
8.14 Volume
8.14.1 Production
8.14.2 Consumption
8.14.3 Import
8.14.4 Export
8.15 Small White Beans
8.15.1 Market
8.16 Volume
8.16.1 Production
8.16.2 Consumption
8.16.3 Import
8.16.4 Export
8.17 Small Red Beans
8.17.1 Market
8.18 Volume
8.18.1 Production
8.18.2 Consumption
8.18.3 Import
8.18.4 Export
8.19 Pink Beans
8.19.1 Market
8.20 Volume
8.20.1 Production
8.20.2 Consumption
8.20.3 Import
8.20.4 Export
8.21 Others
8.21.1 Market
8.22 Volume
8.22.1 Production
8.22.2 Consumption
8.22.3 Import
8.22.4 Export
9. Company Analysis
9.1 RoquetteFreres
9.1.1 Overview
9.1.2 Recent Development
9.1.3 Revenues
9.2 ADM
9.2.1 Overview
9.2.2 Recent Development
9.2.3 Revenues
9.3 Bunge Ltd.
9.3.1 Overview
9.3.2 Recent Development
9.3.3 Revenues
9.4 SunOpta
9.4.1 Overview
9.4.2 Recent Development
9.4.3 Revenues
9.5 Ingredion
9.5.1 Overview
9.5.2 Recent Development
9.5.3 Revenues
List of Figures:
Figure-01: United States – Beans Market (Million US$), 2016 – 2020
Figure-02: United States – Forecast for Beans Market (Million US$), 2021 – 2027
Figure-03: United States – Beans Production Volume (Million Pound), 2016 – 2020
Figure-04: United States – Forecast for Beans Production Volume (Million Pound), 2021 – 2027
Figure-05: United States – Beans Consumption Volume (Million Pound), 2016 – 2020
Figure-06: United States – Forecast for Beans Consumption Volume (Million Pound), 2021 – 2027
Figure-07: United States – Beans Import Volume (Million Pound), 2016 – 2020
Figure-08: United States – Forecast for Beans Import Volume (Million Pound), 2021 – 2027
Figure-09: United States – Beans Export Volume (Million Pound), 2016 – 2020
Figure-10: United States – Forecast for Beans Export Volume (Million Pound), 2021 – 2027
Figure-11: United States – Pinto Beans Production Volume (Million Pound), 2016 – 2020
Figure-12: United States – Forecast for Pinto Beans Production Volume (Million Pound), 2021 – 2027
Figure-13: United States – Pinto Beans Import Volume (Million Pound), 2016 – 2020
Figure-14: United States – Forecast for Pinto Beans Import Volume (Million Pound), 2021 – 2027
Figure-15: United States – Pinto Beans Export Volume (Million Pound), 2016 – 2020
Figure-16: United States – Forecast for Pinto Beans Export Volume (Million Pound), 2021 – 2027
Figure-17: United States – Pinto Beans Consumption Volume (Million Pound), 2016 – 2020
Figure-18: United States – Forecast for Pinto Beans Consumption Volume (Million Pound), 2021 – 2027
Figure-19: United States – Pinto Beans Consumption Value (Million US$), 2016 – 2020
Figure-20: United States – Forecast for Pinto Beans Consumption Value (Million US$), 2021 – 2027
Figure-21: United States – Navy Beans Production Volume (Million Pound), 2016 – 2020
Figure-22: United States – Forecast for Navy Beans Production Volume (Million Pound), 2021 – 2027
Figure-23: United States – Navy Beans Import Volume (Million Pound), 2016 – 2020
Figure-24: United States – Forecast for Navy Beans Import Volume (Million Pound), 2021 – 2027
Figure-25: United States – Navy Beans Export Volume (Million Pound), 2016 – 2020
Figure-26: United States – Forecast for Navy Beans Export Volume (Million Pound), 2021 – 2027
Figure-27: United States – Navy Beans Consumption Volume (Million Pound), 2016 – 2020
Figure-28: United States – Forecast for Navy Beans Consumption Volume (Million Pound), 2021 – 2027
Figure-29: United States – Navy Beans Consumption Value (Million US$), 2016 – 2020
Figure-30: United States – Forecast for Navy Beans Consumption Value (Million US$), 2021 – 2027
Figure-31: United States – Great Northern Beans Production Volume (Million Pound), 2016 – 2020
Figure-32: United States – Forecast for Great Northern Beans Production Volume (Million Pound), 2021 – 2027
Figure-33: United States – Great Northern Beans Import Volume (Million Pound), 2016 – 2020
Figure-34: United States – Forecast for Great Northern Beans Import Volume (Million Pound), 2021 – 2027
Figure-35: United States – Great Northern Beans Export Volume (Million Pound), 2016 – 2020
Figure-36: United States – Forecast for Great Northern Beans Export Volume (Million Pound), 2021 – 2027
Figure-37: United States – Great Northern Beans Consumption Volume (Million Pound), 2016 – 2020
Figure-38: United States – Forecast for Great Northern Beans Consumption Volume (Million Pound), 2021 – 2027
Figure-39: United States – Great Northern Beans Consumption Value (Million US$), 2016 – 2020
Figure-40: United States – Forecast for Great Northern Beans Consumption Value (Million US$), 2021 – 2027
Figure-41: United States – Black Beans Production Volume (Million Pound), 2016 – 2020
Figure-42: United States – Forecast for Black Beans Production Volume (Million Pound), 2021 – 2027
Figure-43: United States – Black Beans Import Volume (Million Pound), 2016 – 2020
Figure-44: United States – Forecast for Black Beans Import Volume (Million Pound), 2021 – 2027
Figure-45: United States – Black Beans Export Volume (Million Pound), 2016 – 2020
Figure-46: United States – Forecast for Black Beans Export Volume (Million Pound), 2021 – 2027
Figure-47: United States – Black Beans Export Volume (Million Pound), 2016 – 2020
Figure-48: United States – Forecast for Black Beans Export Volume (Million Pound), 2021 – 2027
Figure-49: United States – Black Beans Consumption in Value (Million US$), 2016 – 2020
Figure-50: United States – Forecast for Black Beans Consumption in Value (Million US$), 2021 – 2027
Figure-51: United States – Lima Beans Production Volume (Million Pound), 2016 – 2020
Figure-52: United States – Forecast for Lima Beans Production Volume (Million Pound), 2021 – 2027
Figure-53: United States – Lima Beans Import Volume (Million Pound), 2016 – 2020
Figure-54: United States – Forecast for Lima Beans Import Volume (Million Pound), 2021 – 2027
Figure-55: United States – Lima Beans Export Volume (Million Pound), 2016 – 2020
Figure-56: United States – Forecast for Lima Beans Export Volume (Million Pound), 2021 – 2027
Figure-57: United States – Lima Beans Consumption Volume (Million Pound), 2016 – 2020
Figure-58: United States – Forecast for Lima Beans Consumption Volume (Million Pound), 2021 – 2027
Figure-59: United States – Lima Beans Consumption Value (Million US$), 2016 – 2020
Figure-60: United States – Forecast for Lima Beans Consumption Value (Million US$), 2021 – 2027
Figure-61: United States – Red Kidney Beans Production Volume (Million Pound), 2016 – 2020
Figure-62: United States – Forecast for Red Kidney Beans Production Volume (Million Pound), 2021 – 2027
Figure-63: United States – Red Kidney Beans Import Volume (Million Pound), 2016 – 2020
Figure-64: United States – Forecast for Red Kidney Beans Import Volume (Million Pound), 2021 – 2027
Figure-65: United States – Red Kidney Beans Export Volume (Million Pound), 2016 – 2020
Figure-66: United States – Forecast for Red Kidney Beans Export Volume (Million Pound), 2021 – 2027
Figure-67: United States – Red Kidney Beans Consumption Volume (Million Pound), 2016 – 2020
Figure-68: United States – Forecast for Red Kidney Beans Consumption Volume (Million Pound), 2021 – 2027
Figure-69: United States – Red Kidney Beans Consumption in Value (Million US$), 2016 – 2020
Figure-70: United States – Forecast for Red Kidney Beans Consumption in Value (Million US$), 2021 – 2027
Figure-71: United States – Black Eye Beans Production Volume (Million Pound), 2016 – 2020
Figure-72: United States – Forecast for Black Eye Beans Production Volume (Million Pound), 2021 – 2027
Figure-73: United States – Black Eye Beans Import Volume (Million Pound), 2016 – 2020
Figure-74: United States – Forecast for Black Eye Beans Import Volume (Million Pound), 2021 – 2027
Figure-75: United States – Black Eye Beans Export Volume (Million Pound), 2016 – 2020
Figure-76: United States – Forecast for Black Eye Beans Export Volume (Million Pound), 2021 – 2027
Figure-77: United States – Black Eye Beans Consumption Volume (Million Pound), 2016 – 2020
Figure-78: United States – Forecast for Black Eye Beans Consumption Volume (Million Pound), 2021 – 2027
Figure-79: United States – Black Eye Beans Consumption Value (Million US$), 2016 – 2020
Figure-80: United States – Forecast for Black Eye Beans Consumption Value (Million US$), 2021 – 2027
Figure-81: United States – Small whites Beans Production Volume (Million Pound), 2017 – 2020
Figure-82: United States – Forecast for Small whites Beans Production Volume (Million Pound), 2021 – 2027
Figure-83: United States – Small White Beans Import Volume (Million Pound), 2016 – 2020
Figure-84: United States – Forecast for Small White Beans Import Volume (Million Pound), 2021 – 2027
Figure-85: United States – Small White Beans Export Volume (Million Pound), 2016 – 2020
Figure-86: United States – Forecast for Small White Beans Export Volume (Million Pound), 2021 – 2027
Figure-87: United States – Small whites Beans Consumption Volume (Million Pound), 2016 – 2020
Figure-88: United States – Forecast for Small whites Beans Consumption Volume (Million Pound), 2021 – 2027
Figure-89: United States – Small whites Beans Consumption Value (Million US$), 2016 – 2020
Figure-90: United States – Forecast for Small whites Beans Consumption Value (Million US$), 2021 – 2027
Figure-91: United States – Small Red Beans Production Volume (Million Pound), 2016 – 2020
Figure-92: United States – Forecast for Small Red Beans Production Volume (Million Pound), 2021 – 2027
Figure-93: United States – Small Red Beans Import Volume (Million Pound), 2016 – 2020
Figure-94: United States – Forecast for Small Red Beans Import Volume (Million Pound), 2021 – 2027
Figure-95: United States – Small Red Beans Export Volume (Million Pound), 2016 – 2020
Figure-96: United States – Forecast for Small Red Beans Export Volume (Million Pound), 2021 – 2027
Figure-97: United States – Small Red Beans Consumption Volume (Million Pound), 2016 – 2020
Figure-98: United States – Forecast for Small Red Beans Consumption Volume (Million Pound), 2021 – 2027
Figure-99: United States – Small Red Beans Consumption Value (Million US$), 2016 – 2020
Figure-100: United States – Forecast for Small Red Beans Consumption in Value (Million US$), 2021 – 2027
Figure-101: United States – Pink Beans Production Volume (Million Pound), 2016 – 2020
Figure-102: United States – Forecast for Pink Beans Production Volume (Million Pound), 2021 – 2027
Figure-103: United States – Pink Beans Export Volume (Million Pound), 2016 – 2020
Figure-104: United States – Forecast for Pink Beans Export Volume (Million Pound), 2021 – 2027
Figure-105: United States – Pink Beans Consumption in Volume (Million Pound), 2016 – 2020
Figure-106: United States – Forecast for Pink Beans Consumption in Volume (Million Pound), 2021 – 2027
Figure-107: United States – Pink Beans Consumption Value (Million US$), 2016 – 2020
Figure-108: United States – Forecast for Pink Beans Consumption Value (Million US$), 2021 – 2027
Figure-109: United States – Other Beans Production Volume (Million Pound), 2016 – 2020
Figure-110: United States – Forecast for Other Beans Production Volume (Million Pound), 2020 – 2026
Figure-111: United States – Other Beans Import Volume (Million Pound), 2016 – 2020
Figure-112: United States – Forecast for Other Beans Import Volume (Million Pound), 2021 – 2027
Figure-113: United States – Other Beans Export Volume (Million Pound), 2016 – 2020
Figure-114: United States – Forecast for Other Beans Export Volume (Million Pound), 2021 – 2027
Figure-115: United States – Other Beans Consumption in Volume Million Pound), 2016 – 2020
Figure-116: United States – Forecast for Other Beans Consumption in Volume (Million Pound), 2020 – 2026
Figure-117: United States – Other Beans Consumption in Value (Million US$), 2021 – 2027
Figure-118: United States – Forecast for Other Beans Consumption in Value (Million US$), 2021 – 2027
Figure-119: Roquette Frères – Global Revenue (Billion US$), 2016 – 2020
Figure-120: Roquette Frères – Forecast for Global Revenue (Billion US$), 2021 – 2027
Figure-121: ADM – Global Revenue (Billion US$), 2016 – 2020
Figure-122: ADM – Forecast for Global Revenue (Billion US$), 2021 – 2027
Figure-123: Bunge Ltd. – Global Revenue (Billion US$), 2016 – 2020
Figure-124: Bunge Ltd. – Forecast For Global Revenue (Billion US$), 2021 – 2027
Figure-125: SunOpta – Global Revenue (Billion US$), 2016 – 2020
Figure-126: SunOpta – Forecast for Global Revenue (Billion US$), 2021 – 2027
Figure-127: Ingredion – Global Revenue (Billion US$), 2016 – 2020
Figure-128: Ingredion – Forecast for Global Revenue (Billion US$), 2021 – 2027
List of Tables:
Table-01: United States – Beans Market Share Consumption (Percent), 2016 – 2020
Table-02: United States – Forecast for Beans Market Share Consumption (Percent), 2021 – 2027
Table-03: United States – Beans Production Volume Share (Percent), 2016 – 2020
Table-04: United States – Forecast for Beans Production Volume Share (Percent), 2021 – 2027
Table-05: United States – Beans Import Volume Share (Percent), 2016 – 2020
Table-06: United States – Forecast for Beans Import Volume Share (Percent), 2021 – 2027
Table-07: United States – Beans Export Volume Share (Percent), 2016 – 2020
Table-08: United States – Forecast for Beans Export Volume Share (Percent), 2021 – 2027