Renub

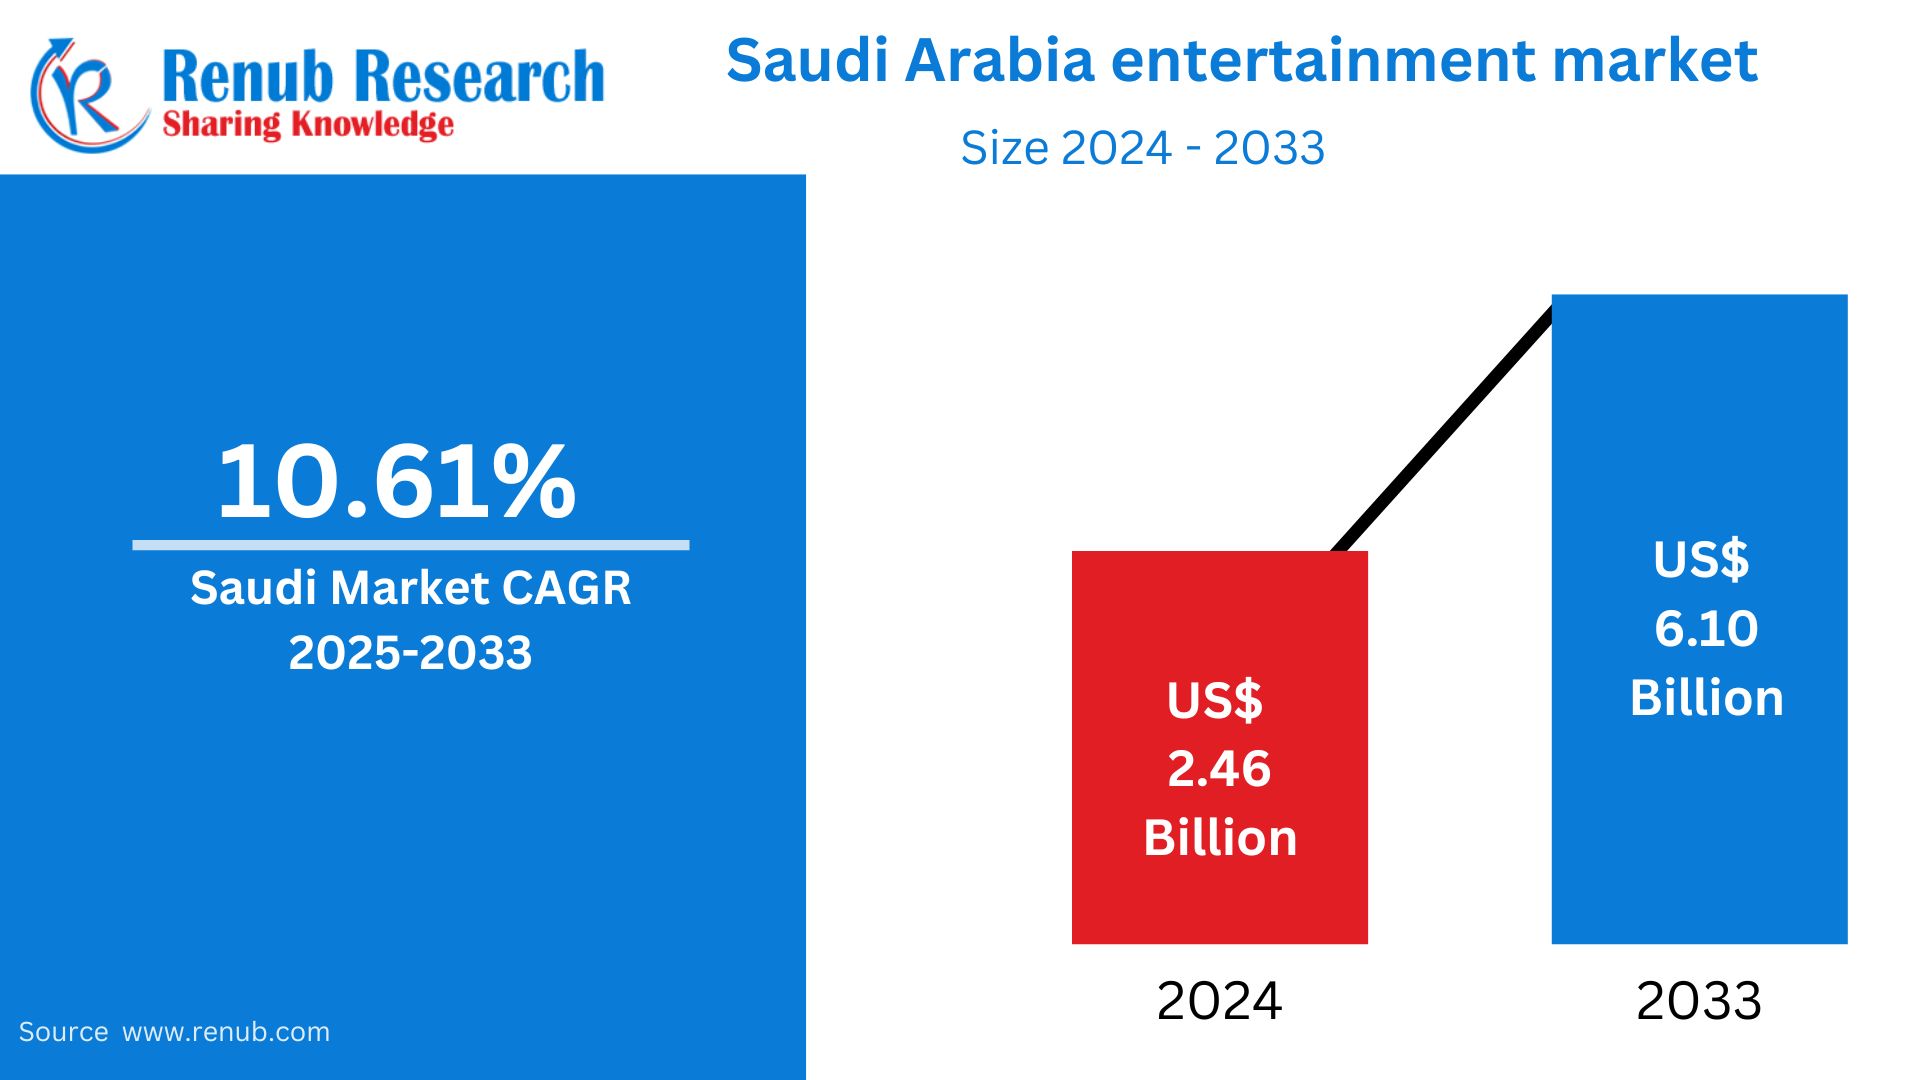
    Saudi Arabia Entertainment and Amusement Market, Size, Forecast 2023-2030, Industry Trends, Growth, Impact of Inflation, Opportunity Company Analysis

    Excel: 8 Hours
    PDF: 24 Hours
    Jul 2023
    Pages: 320

    Saudi Arabia Entertainment Market Outlook

    Saudi Arabia Entertainment & Amusement Market is estimated to reach US$ 1,371.30 Million by 2030, according to Renub Research. The Arabian society is undergoing rapid transformation, with the country implementing a range of initiatives aimed at establishing itself as a global entertainment hub. These efforts include attracting both local and international filmmakers, nurturing musical talent, and establishing theme parks and entertainment centers. This strategic approach is driving the diversification of the region's economy and promoting cultural exchange. By embracing various forms of entertainment, Arabian society is fostering a vibrant creative industry while simultaneously appealing to a global audience. These initiatives reflect the country's commitment to embracing cultural evolution and positioning itself as a destination that offers diverse and immersive entertainment experiences. February 2023 as Abdullah Al Othaim Investment Co. unveiled its ambitious plans for a groundbreaking $1.9 billion (SR7bn) entertainment project in Riyadh, Saudi Arabia.


    The Entertainment & Amusement market in Saudi Arabia is projected to grow at a remarkable rate of 20.01% from 2022 to 2030, reflecting significant opportunities and potential for the industry.

    In pursuit of its ambitious Vision 2030, Saudi Arabia has embarked on a remarkable journey of economic diversification, notably with the implementation of a groundbreaking entertainment policy. In January 2023, Saudi Arabia's General Entertainment Authority made substantial strides in advancing the country's entertainment industry. Over 24 theme parks and 421 entertainment centers were granted licenses, showcasing the commitment to diversifying the economy in alignment with the objectives of Vision 2030. Moreover, the GEA issued 4,198 permits for entertainment events and 3,370 permits for live performances in restaurants and cafes. These initiatives reflect the Kingdom's dedication to fostering a vibrant and diverse entertainment sector, offering a wide array of options for residents and visitors to enjoy enriching experiences and contribute to the overall growth of the industry. This strategic move involves the establishment of the General Entertainment Authority (GEA) and a planned investment of USD 64 billion. The Kingdom's Vision 2030 aims to transform Saudi Arabia into a thriving society and a premier global destination for both residents and tourists alike. By channeling substantial investments into the entertainment and cultural sectors, Saudi Arabia is steadily transforming its aspirations into tangible realities. These efforts are propelling the Kingdom toward its vision of creating a vibrant society and positioning itself among the world's most sought-after places to live and visit. Saudi Arabia Entertainment & Amusement Market was valued at US$ 318.63 Million in 2022.


    In the Saudi Arabia Entertainment & Amusement industry, nationals hold the highest market share.

    By Nationality, Saudi Arabia Entertainment & Amusement Market is segmented into Nationals and Others. The nationals of Saudi Arabia hold the highest market share in the country's Entertainment & Amusement industry. This indicates that local residents play a significant role in driving the demand for entertainment and amusement offerings within the country. The preferences, cultural values, and aspirations of Saudi nationals strongly influence the types of entertainment experiences sought after and enjoyed. As the industry continues to grow and diversify, it is crucial for businesses to understand and cater to the specific needs and interests of the local population in order to effectively capture and retain their market share.


    In the upcoming years, park admission is projected to hold the highest market in the Saudi Arabia Entertainment & Amusement industry.

    By Segment, Saudi Arabia Entertainment & Amusement Market is classified into Games, Food and Beverages, Merchandise, Sponsorship, Parking, etc and Park Admission. As visitors seek immersive experiences and access to a diverse range of attractions, park admission plays a crucial role. The demand for entry tickets and passes to various entertainment parks, including theme parks, water parks, and amusement centers, is expected to soar. With investments in new park developments and expanding existing offerings, park admission will continue to dominate the market, providing visitors with exciting and memorable experiences in the Saudi Arabian entertainment landscape.

    Food and beverages is the fastest-growing segment in the Saudi Arabia Entertainment & Amusement industry. With the emphasis on providing exceptional dining experiences, the industry is witnessing a surge in innovative culinary offerings and diverse beverage options to enhance the overall entertainment experience.


    Males hold the highest market share in the Saudi Arabia Entertainment & Amusement industry.

    By Gender, Saudi Arabia Entertainment & Amusement Market is sub segmented into Male and Female. As key participants and consumers, Saudi male individuals play a significant role in shaping the industry's growth. Their preferences, interests, and participation in various entertainment activities contribute to the dominant market share. The industry continues to cater to their diverse tastes, providing engaging experiences and entertainment offerings tailored to their preferences. Females are poised to capture a significant share in the Saudi Arabia Entertainment & Amusement industry. With a growing emphasis on inclusivity and catering to diverse audiences, the industry is actively expanding offerings to appeal to female consumers. By providing engaging and culturally appropriate entertainment options, the industry aims to create inclusive spaces that cater to the preferences and interests of female visitors, unlocking new opportunities for growth and development in the Saudi Arabian entertainment landscape.


    The Jeddah Entertainment & Amusement industry is experiencing a vibrant transformation, becoming a key hub for entertainment and leisure in Saudi Arabia.

    By Region, Saudi Arabia Entertainment & Amusement Market is break up into Riyadh, Jeddah, Dammam/Khobar, Mekkah and Madina and Others (Jizan, Tabouk, Taif and Al Baha, etc). Jeddah, the vibrant city of Saudi Arabia, is experiencing a flourishing Entertainment & Amusement industry. With its cosmopolitan atmosphere and growing population, Jeddah has become a hotspot for entertainment and leisure activities. The city boasts a diverse range of offerings, including amusement parks, water parks, family entertainment centers, and cultural events. Jeddah's Entertainment & Amusement industry is continuously evolving, attracting both local residents and tourists alike. As the demand for immersive experiences and quality entertainment grows, Jeddah remains at the forefront, providing a dynamic and engaging entertainment landscape that reflects the city's modern and forward-thinking spirit.


    Key Company

    Al Hokair Group, AL Othaim, Fakieh Group, Jungle Land, Saudi Aramco Amusement Park, E-Plus (Event Plus), Time Entertainment, First Entertainment Company and Belle Gate are the some companies working in Entertainment & Amusement industry of Saudi Arabia.


    Renub Research report titled "Saudi Arabia Entertainment & Amusement Market, by Nationality (Nationals and Others), by Park Type (Indoor Family Entertainment Centres & Outdoor Amusement Parks), by Segment (Games, Food and Beverages, Merchandise, Sponsorship, Parking, etc.& Park Admission), by Gender (Male & Female), By Age Group (15-24, 25-34, 35-44, 45-54 & 55 Plus), by End User (With Family, With Spouse, With Friends, Alone & Othe (Corporate Colleagues,Coworkers, Team Members)) by Monthly Income (Less than 1200, 1201-3200, 3201-5400 & 5401 Plus), by Regions (Riyadh, Jeddah, Dammam/Khobar, Mekkah and Madina Others (Jizan, Tabouk, Taif and Al Baha, etc)), Company (Al Hokair Group, AL Othaim, Fakieh Group, Jungle Land, Saudi Aramco Amusement Park, E-Plus (Event Plus), Time Entertainment, First Entertainment Company and Belle Gate)" provides a detailed analysis of Kingdom’s Entertainment & Amusement Industry.

    saudi-arabia-entertainment-and-amusement-market-share

    By Nationality – Saudi Arabia Entertainment & Amusement Market is break up into 2 Parts 

    1.    Nationals
    2.    Others


    By Park Type – Market is break up into 2 Parts

    1.    Indoor Family Entertainment Centres
    2.    Outdoor Amusement Parks


    By Segment – Market is break up into 4 Parts

    1.    Games
    2.    Food and Beverages
    3.    Merchandise
    4.    Sponsorship Parking, etc.
    5.    Park Admission


    By Gender – Market is break up into 2 Parts

    1.    Male 
    2.    Female


    By Age Group – Market is break up into 5 Parts

    1.    15-24
    2.    25-34
    3.    35-44
    4.    45-54
    5.    55 Plus


    By End User – Market is break up into 5 Parts

    1.    With Family
    2.    With Spouse
    3.    With Friends
    4.    Alone
    5.    Other (Corporate Colleagues, Coworkers, Team Members)


    By Monthly Income – Market is break up into 4 Parts

    1.    Less than 1200
    2.    1201-3200
    3.    3201-5400
    4.    5401 Plus


    By Region – Market is break up into 5 Parts

    1.    Riyadh
    2.    Jeddah
    3.    Dammam/Khobar
    4.    Mekkah and Madina
    5.    Others (Jizan, Tabouk, Taif and Al Baha, etc)


    Company Analysis have been covered from 2 viewpoints

    •    Overview
    •    Recent Development


    Theme Park/Amusements Park Companies

    1.    Al Hokair Group 
    2.    AL Othaim
    3.    Fakieh Group
    4.    Jungle Land 
    5.    Saudi Aramco Amusement Park


    Festivals and Concerts Companies

    1.    E-Plus (Event Plus)
    2.    Time Entertainment
    3.    First Entertainment Company 
    4.    Belle Gate


    Report Details:

    Report Features Details
    Base Year 2022
    Historical Period 2018 - 2022
    Forecast Period 2023 - 2030
    Market US$ Million
    Segment Covered Nationality, Park Type, Segment, Gender, Age Group, End User, Monthly Income, and Region
    Region Covered Riyadh, Jeddah, Dammam/Khobar, Mekkah and Madina and Others (Jizan, Tabouk, Taif and Al Baha, etc)
    Companies Covered Al Hokair Group, AL Othaim, Fakieh Group, Jungle Land, Saudi Aramco Amusement Park, E-Plus (Event Plus), Time Entertainment, First Entertainment Company and Belle Gate
    Customization Scope 20% Free Customization
    Post-Sale Analyst Support 1 Year (52 Weeks)
    Delivery Format PDF and Excel through Email (We can also provide the editable version of the report in PPT/Word format on request)

    1.    Introduction

    2.    Research Methodology

    3.    Executive Summary

    4.    Market Dynamics

    4.1    Growth Driver
    4.2    Challenges


    5.    Saudi Arabia Entertainment Survey

    5.1    By Nationality
    5.2    By Region
    5.3    By Gender
    5.4    By Age Group
    5.5    By Monthly Income
    5.6    By End User


    6.    Saudi Arabia Entertainment Market

    6.1    Theme Park/Amusument Park
    6.2    Festivals and Concerts
    6.3    Other Sources


    7.    Market Share Analysis – Saudi Arabia Entertainment & Amusement

    7.1    Nationality
    7.2    Park Type
    7.3    Segment
    7.4    Gender
    7.5    Age Group
    7.6    End User
    7.7    Monthly Income
    7.8    Region


    8.    Theme Park/Amusement Park Market

    8.1    Revenue

    8.1.1    Indoor Family Entertainment Centres (FEC’s) Market
    8.1.2    Outdoor Amusement Parks Market

    8.2    Nationality

    8.2.1    Nationals    
    8.2.2    Others

    8.3    Gender

    8.3.1    Male
    8.3.2    Female


    8.4    Age Group

    8.4.1    15-24
    8.4.2    25-34
    8.4.3    35-44
    8.4.4    45-54
    8.4.5    55 Plus

    8.5    Monthly Income

    8.5.1    Less than 1200
    8.5.2    1201-3200
    8.5.3    3201-5400
    8.5.4    5401 Plus    

    8.6    Region

    8.6.1    Riyadh
    8.6.2    Jeddah
    8.6.3    Dammam/Khobar
    8.6.4    Mekkah and Madina
    8.6.5    Others (Jizan, Tabouk, Taif and Al Bahaetc)

    8.7    End Users

    8.7.1    With Family
    8.7.2    With Spouse
    8.7.3    With Friends
    8.7.4    Alone
    8.7.5    Other (Corporate Colleagues,Coworkers, Team Members)


    9.    Festivals and Concerts Market

    9.1    Nationality

    9.1.1    Nationals
    9.1.2    Arabs

    9.2    Gender

    9.2.1    Male
    9.2.2    Female

    9.3    Age Group

    9.3.1    15-24
    9.3.2    25-34
    9.3.3    35-44
    9.3.4    45-54
    9.3.5    55 Plus

    9.4    Monthly Income

    9.4.1    Less than 1200
    9.4.2    1201-3200
    9.4.3    3201-5400
    9.4.4    5401 Plus

    9.5    Region

    9.5.1    Riyadh
    9.5.2    Jeddah
    9.5.3    Dammam/Khobar
    9.5.4    Mekkah and Madina
    9.5.5    Others (Jizan, Tabouk, Taif and Al Bahaetc)

    9.6    End Users

    9.6.1    With Family
    9.6.2    With Spouse
    9.6.3    With Friends
    9.6.4    Alone
    9.6.5    Other (Corporate Colleagues,Coworkers, Team Members)


    10.    Other Events Market

    10.1    Nationality

    10.1.1    Nationals
    10.1.2    Arabs

    10.2    Gender

    10.2.1    Male
    10.2.2    Female

    10.3    Age Group

    10.3.1    15-24
    10.3.2    25-34
    10.3.3    35-44
    10.3.4    45-54
    10.3.5    55 Plus

    10.4    Monthly Income

    10.4.1    Less than 1200
    10.4.2    1201-3200
    10.4.3    3201-5400
    10.4.4    5401 Plus

    10.5    Region

    10.5.1    Riyadh
    10.5.2    Jeddah
    10.5.3    Dammam/Khobar
    10.5.4    Others (Jizan, Tabouk, Taif and Al Bahaetc)

    10.6    End User

    10.6.1    With Family
    10.6.2    With Spouse
    10.6.3    With Friends
    10.6.4    Alone
    10.6.5    Other (Corporate Colleagues,Coworkers, Team Members)


    11.    Company Analysis

    11.1    Theme Park/Amusement Park Companies

    11.1.1    Al Hokair Group

    11.1.1.1    Overview
    11.1.1.2    Recent Development

    11.1.2    Al Othaim

    11.1.2.1    Overview
    11.1.2.2    Recent Development

    11.1.3    Fakieh Group

    11.1.3.1    Overview
    11.1.3.2    Recent Development

    11.1.4    Jungle Land

    11.1.4.1    Overview
    11.1.4.2    Recent Development

    11.1.5    Saudi Aramco Amusement Park

    11.1.5.1    Overview
    11.1.5.2    Recent Development

    11.2    Festivals and Concerts Companies

    11.2.1    E-PLUS (Event Plus)

    11.2.1.1    Overview
    11.2.1.2    Recent Development

    11.2.2    Time Entertainment

    11.2.2.1    Overview
    11.2.2.2    Recent Developments

    11.2.3    First Entertainment Company

    11.2.3.1    Overview
    11.2.3.2    Recent Development

    11.2.4    Belle Gate

    11.2.4.1    Overview
    11.2.4.2    Recent Development


    List of Figures:

    Figure-01:    Saudi Arabia – Entertainment Market (Million US$), 2018 – 2022
    Figure-02:    Saudi Arabia – Forecast for Entertainment Market (Million US$), 2023 – 2030
    Figure-03:    Saudi Arabia – Theme Park/Amusument Park Market (Million US$), 2018 – 2022
    Figure-04:    Saudi Arabia – Forecast for Theme Park/Amusument Park Market (Million US$), 2023 – 2030
    Figure-05:    Saudi Arabia – Festivals and Concerts Market (Million US$), 2018 – 2022
    Figure-06:    Saudi Arabia – Forecast for Festivals and Concerts Market (Million US$), 2023 – 2030
    Figure-07:    Saudi Arabia Entertainment – Other Sources Market (Million US$), 2018 – 2022
    Figure-08:    Saudi Arabia Entertainment – Forecast for Other Sources Market (Million US$), 2023 – 2030
    Figure-09:    Theme Park/Amusement Park – Indoor Family Entertainment Centres (FEC’s) Market Revenue Market (Million US$), 2018 – 2022
    Figure-10:    Theme Park/Amusement Park – Forecast for Indoor Family Entertainment Centres (FEC’s) Market Revenue Market (Million US$), 2023 – 2030
    Figure-11:    Theme Park/Amusement Park – Outdoor Amusement Parks Market Revenue Market (Million US$), 2018 – 2022
    Figure-12:    Theme Park/Amusement Park – Forecast for Outdoor Amusement Parks Market Revenue Market (Million US$), 2023 – 2030
    Figure-13:    Theme Park/Amusement Park – Nationals Nationality Market (Million US$), 2018 – 2022
    Figure-14:    Theme Park/Amusement Park – Forecast for Nationals Nationality Market (Million US$), 2023 – 2030
    Figure-15:    Theme Park/Amusement Park – Others Nationality Market (Million US$), 2018 – 2022
    Figure-16:    Theme Park/Amusement Park – Forecast for Others Nationality Market (Million US$), 2023 – 2030
    Figure-17:    Theme Park/Amusement Park – Male Gender Market (Million US$), 2018 – 2022
    Figure-18:    Theme Park/Amusement Park – Forecast for Male Gender Market (Million US$), 2023 – 2030
    Figure-19:    Theme Park/Amusement Park – Female Gender Market (Million US$), 2018 – 2022
    Figure-20:    Theme Park/Amusement Park – Forecast for Female Gender Market (Million US$), 2023 – 2030
    Figure-21:    Theme Park/Amusement Park – 15-24 Age Group Market (Million US$), 2018 – 2022
    Figure-22:    Theme Park/Amusement Park – Forecast for 15-24 Age Group Market (Million US$), 2023 – 2030
    Figure-23:    Theme Park/Amusement Park – 25-34 Age Group Market (Million US$), 2018 – 2022
    Figure-24:    Theme Park/Amusement Park – Forecast for 25-34 Age Group Market (Million US$), 2023 – 2030
    Figure-25:    Theme Park/Amusement Park – 35-44 Age Group Market (Million US$), 2018 – 2022
    Figure-26:    Theme Park/Amusement Park – Forecast for 35-44 Age Group Market (Million US$), 2023 – 2030
    Figure-27:    Theme Park/Amusement Park – 45-54 Age Group Market (Million US$), 2018 – 2022
    Figure-28:    Theme Park/Amusement Park – Forecast for 45-54 Age Group Market (Million US$), 2023 – 2030
    Figure-29:    Theme Park/Amusement Park – 55 Plus Age Group Market (Million US$), 2018 – 2022
    Figure-30:    Theme Park/Amusement Park – Forecast for 55 Plus Age Group Market (Million US$), 2023 – 2030
    Figure-31:    Theme Park/Amusement Park – Less than 1200 Monthly Income Market (Million US$), 2018 – 2022
    Figure-32:    Theme Park/Amusement Park – Forecast for Less than 1200 Monthly Income Market (Million US$), 2023 – 2030
    Figure-33:    Theme Park/Amusement Park – 1201-3200 Monthly Income Market (Million US$), 2018 – 2022
    Figure-34:    Theme Park/Amusement Park – Forecast for 1201-3200 Monthly Income Market (Million US$), 2023 – 2030
    Figure-35:    Theme Park/Amusement Park – 3201-5400 Monthly Income Market (Million US$), 2018 – 2022
    Figure-36:    Theme Park/Amusement Park – Forecast for 3201-5400 Monthly Income Market (Million US$), 2023 – 2030
    Figure-37:    Theme Park/Amusement Park – 5401 Plus Monthly Income Market (Million US$), 2018 – 2022
    Figure-38:    Theme Park/Amusement Park – Forecast for 5401 Plus Monthly Income Market (Million US$), 2023 – 2030
    Figure-39:    Theme Park/Amusement Park – Riyadh Riyadh Market (Million US$), 2018 – 2022
    Figure-40:    Theme Park/Amusement Park – Forecast for Riyadh Riyadh Market (Million US$), 2023 – 2030
    Figure-41:    Theme Park/Amusement Park – Jeddah Jeddah Market (Million US$), 2018 – 2022
    Figure-42:    Theme Park/Amusement Park – Forecast for Jeddah Jeddah Market (Million US$), 2023 – 2030
    Figure-43:    Theme Park/Amusement Park – Dammam/Khobar Dammam/Khobar Market (Million US$), 2018 – 2022
    Figure-44:    Theme Park/Amusement Park – Forecast for Dammam/Khobar Dammam/Khobar Market (Million US$), 2023 – 2030
    Figure-45:    Theme Park/Amusement Park – Mekkah and Madina Mekkah and Madina Market (Million US$), 2018 – 2022
    Figure-46:    Theme Park/Amusement Park – Forecast for Mekkah and Madina Mekkah and Madina Market (Million US$), 2023 – 2030
    Figure-47:    Theme Park/Amusement Park – Others (Jizan, Tabouk, Taif and Al Bahaetc) Others (Jizan, Tabouk, Taif and Al Bahaetc) Market (Million US$), 2018 – 2022
    Figure-48:    Theme Park/Amusement Park – Forecast for Others (Jizan, Tabouk, Taif and Al Bahaetc) Others (Jizan, Tabouk, Taif and Al Bahaetc) Market (Million US$), 2023 – 2030
    Figure-49:    Theme Park/Amusement Park – With Family End Users Market (Million US$), 2018 – 2022
    Figure-50:    Theme Park/Amusement Park – Forecast for With Family End Users Market (Million US$), 2023 – 2030
    Figure-51:    Theme Park/Amusement Park – With Spouse End Users Market (Million US$), 2018 – 2022
    Figure-52:    Theme Park/Amusement Park – Forecast for With Spouse End Users Market (Million US$), 2023 – 2030
    Figure-53:    Theme Park/Amusement Park – With Friends End Users Market (Million US$), 2018 – 2022
    Figure-54:    Theme Park/Amusement Park – Forecast for With Friends End Users Market (Million US$), 2023 – 2030
    Figure-55:    Theme Park/Amusement Park – Alone End Users Market (Million US$), 2018 – 2022
    Figure-56:    Theme Park/Amusement Park – Forecast for Alone End Users Market (Million US$), 2023 – 2030
    Figure-57:    Theme Park/Amusement Park – Other (Corporate Colleagues,Coworkers, Team Members) End Users Market (Million US$), 2018 – 2022
    Figure-58:    Theme Park/Amusement Park – Forecast for Other (Corporate Colleagues,Coworkers, Team Members) End Users Market (Million US$), 2023 – 2030
    Figure-59:    Festivals and Concerts – Nationals Nationality Market (Million US$), 2018 – 2022
    Figure-60:    Festivals and Concerts – Forecast for Nationals Nationality Market (Million US$), 2023 – 2030
    Figure-61:    Festivals and Concerts – Arabs Nationality Market (Million US$), 2018 – 2022
    Figure-62:    Festivals and Concerts – Forecast for Arabs Nationality Market (Million US$), 2023 – 2030
    Figure-63:    Festivals and Concerts – Male Gender Market (Million US$), 2018 – 2022
    Figure-64:    Festivals and Concerts – Forecast for Male Gender Market (Million US$), 2023 – 2030
    Figure-65:    Festivals and Concerts – Female Gender Market (Million US$), 2018 – 2022
    Figure-66:    Festivals and Concerts – Forecast for Female Gender Market (Million US$), 2023 – 2030
    Figure-67:    Festivals and Concerts – 15-24 Age Group Market (Million US$), 2018 – 2022
    Figure-68:    Festivals and Concerts – Forecast for 15-24 Age Group Market (Million US$), 2023 – 2030
    Figure-69:    Festivals and Concerts – 25-34 Age Group Market (Million US$), 2018 – 2022
    Figure-70:    Festivals and Concerts – Forecast for 25-34 Age Group Market (Million US$), 2023 – 2030
    Figure-71:    Festivals and Concerts – 35-44 Age Group Market (Million US$), 2018 – 2022
    Figure-72:    Festivals and Concerts – Forecast for 35-44 Age Group Market (Million US$), 2023 – 2030
    Figure-73:    Festivals and Concerts – 45-54 Age Group Market (Million US$), 2018 – 2022
    Figure-74:    Festivals and Concerts – Forecast for 45-54 Age Group Market (Million US$), 2023 – 2030
    Figure-75:    Festivals and Concerts – 55 Plus Age Group Market (Million US$), 2018 – 2022
    Figure-76:    Festivals and Concerts – Forecast for 55 Plus Age Group Market (Million US$), 2023 – 2030
    Figure-77:    Festivals and Concerts – Less than 1200 Monthly Income Market (Million US$), 2018 – 2022
    Figure-78:    Festivals and Concerts – Forecast for Less than 1200 Monthly Income Market (Million US$), 2023 – 2030
    Figure-79:    Festivals and Concerts – 1201-3200 Monthly Income Market (Million US$), 2018 – 2022
    Figure-80:    Festivals and Concerts – Forecast for 1201-3200 Monthly Income Market (Million US$), 2023 – 2030
    Figure-81:    Festivals and Concerts – 3201-5400 Monthly Income Market (Million US$), 2018 – 2022
    Figure-82:    Festivals and Concerts – Forecast for 3201-5400 Monthly Income Market (Million US$), 2023 – 2030
    Figure-83:    Festivals and Concerts – 5401 Plus Monthly Income Market (Million US$), 2018 – 2022
    Figure-84:    Festivals and Concerts – Forecast for 5401 Plus Monthly Income Market (Million US$), 2023 – 2030
    Figure-85:    Festivals and Concerts – Riyadh Market (Million US$), 2018 – 2022
    Figure-86:    Festivals and Concerts – Forecast for Riyadh Market (Million US$), 2023 – 2030
    Figure-87:    Festivals and Concerts – Jeddah Market (Million US$), 2018 – 2022
    Figure-88:    Festivals and Concerts – Forecast for Jeddah Market (Million US$), 2023 – 2030
    Figure-89:    Festivals and Concerts – Dammam/Khobar Market (Million US$), 2018 – 2022
    Figure-90:    Festivals and Concerts – Forecast for Dammam/Khobar Market (Million US$), 2023 – 2030
    Figure-91:    Festivals and Concerts – Mekkah and Madina Market (Million US$), 2018 – 2022
    Figure-92:    Festivals and Concerts – Forecast for Mekkah and Madina Market (Million US$), 2023 – 2030
    Figure-93:    Festivals and Concerts – Others Region (Jizan, Tabouk, Taif and Al Bahaetc) Market (Million US$), 2018 – 2022
    Figure-94:    Festivals and Concerts – Forecast for Others Region (Jizan, Tabouk, Taif and Al Bahaetc) Market (Million US$), 2023 – 2030
    Figure-95:    Festivals and Concerts – With Family End Users Market (Million US$), 2018 – 2022
    Figure-96:    Festivals and Concerts – Forecast for With Family End Users Market (Million US$), 2023 – 2030
    Figure-97:    Festivals and Concerts – With Spouse End Users Market (Million US$), 2018 – 2022
    Figure-98:    Festivals and Concerts – Forecast for With Spouse End Users Market (Million US$), 2023 – 2030
    Figure-99:    Festivals and Concerts – With Friends End Users Market (Million US$), 2018 – 2022
    Figure-100:    Festivals and Concerts – Forecast for With Friends End Users Market (Million US$), 2023 – 2030
    Figure-101:    Festivals and Concerts – Alone End Users Market (Million US$), 2018 – 2022
    Figure-102:    Festivals and Concerts – Forecast for Alone End Users Market (Million US$), 2023 – 2030
    Figure-103:    Festivals and Concerts – Other (Corporate Colleagues,Coworkers, Team Members) End Users Market (Million US$), 2018 – 2022
    Figure-104:    Festivals and Concerts – Forecast for Other (Corporate Colleagues,Coworkers, Team Members) End Users Market (Million US$), 2023 – 2030
    Figure-105:    Other Events – Nationals Nationality Market (Million US$), 2018 – 2022
    Figure-106:    Other Events – Forecast for Nationals Nationality Market (Million US$), 2023 – 2030
    Figure-107:    Other Events – Arabs Nationality Market (Million US$), 2018 – 2022
    Figure-108:    Other Events – Forecast for Arabs Nationality Market (Million US$), 2023 – 2030
    Figure-109:    Other Events – Male Gender Market (Million US$), 2018 – 2022
    Figure-110:    Other Events – Forecast for Male Gender Market (Million US$), 2023 – 2030
    Figure-111:    Other Events – Female Gender Market (Million US$), 2018 – 2022
    Figure-112:    Other Events – Forecast for Female Gender Market (Million US$), 2023 – 2030
    Figure-113:    Other Events – 15-24 Age Group Market (Million US$), 2018 – 2022
    Figure-114:    Other Events – Forecast for 15-24 Age Group Market (Million US$), 2023 – 2030
    Figure-115:    Other Events – 25-34 Age Group Market (Million US$), 2018 – 2022
    Figure-116:    Other Events – Forecast for 25-34 Age Group Market (Million US$), 2023 – 2030
    Figure-117:    Other Events – 35-44 Age Group Market (Million US$), 2018 – 2022
    Figure-118:    Other Events – Forecast for 35-44 Age Group Market (Million US$), 2023 – 2030
    Figure-119:    Other Events – 45-54 Age Group Market (Million US$), 2018 – 2022
    Figure-120:    Other Events – Forecast for 45-54 Age Group Market (Million US$), 2023 – 2030
    Figure-121:    Other Events – 55 Plus Age Group Market (Million US$), 2018 – 2022
    Figure-122:    Other Events – Forecast for 55 Plus Age Group Market (Million US$), 2023 – 2030
    Figure-123:    Other Events – Less than 1200 Monthly Income Market (Million US$), 2018 – 2022
    Figure-124:    Other Events – Forecast for Less than 1200 Monthly Income Market (Million US$), 2023 – 2030
    Figure-125:    Other Events – 1201-3200 Monthly Income Market (Million US$), 2018 – 2022
    Figure-126:    Other Events – Forecast for 1201-3200 Monthly Income Market (Million US$), 2023 – 2030
    Figure-127:    Other Events – 3201-5400 Monthly Income Market (Million US$), 2018 – 2022
    Figure-128:    Other Events – Forecast for 3201-5400 Monthly Income Market (Million US$), 2023 – 2030
    Figure-129:    Other Events – 5401 Plus Monthly Income Market (Million US$), 2018 – 2022
    Figure-130:    Other Events – Forecast for 5401 Plus Monthly Income Market (Million US$), 2023 – 2030
    Figure-131:    Other Events – Riyadh Riyadh Market (Million US$), 2018 – 2022
    Figure-132:    Other Events – Forecast for Riyadh Riyadh Market (Million US$), 2023 – 2030
    Figure-133:    Other Events – Jeddah Jeddah Market (Million US$), 2018 – 2022
    Figure-134:    Other Events – Forecast for Jeddah Jeddah Market (Million US$), 2023 – 2030
    Figure-135:    Other Events – Dammam/Khobar Dammam/Khobar Market (Million US$), 2018 – 2022
    Figure-136:    Other Events – Forecast for Dammam/Khobar Dammam/Khobar Market (Million US$), 2023 – 2030
    Figure-137:    Other Events – Others (Jizan, Tabouk, Taif and Al Bahaetc) Mekkah and Madina Market (Million US$), 2018 – 2022
    Figure-138:    Other Events – Forecast for Others (Jizan, Tabouk, Taif and Al Bahaetc) Mekkah and Madina Market (Million US$), 2023 – 2030
    Figure-139:    Other Events – With Family End Users Market (Million US$), 2018 – 2022
    Figure-140:    Other Events – Forecast for With Family End Users Market (Million US$), 2023 – 2030
    Figure-141:    Other Events – With Spouse End Users Market (Million US$), 2018 – 2022
    Figure-142:    Other Events – Forecast for With Spouse End Users Market (Million US$), 2023 – 2030
    Figure-143:    Other Events – With Friends End Users Market (Million US$), 2018 – 2022
    Figure-144:    Other Events – Forecast for With Friends End Users Market (Million US$), 2023 – 2030
    Figure-145:    Other Events – Alone End Users Market (Million US$), 2018 – 2022
    Figure-146:    Other Events – Forecast for Alone End Users Market (Million US$), 2023 – 2030
    Figure-147:    Other Events – Other (Corporate Colleagues,Coworkers, Team Members) End Users Market (Million US$), 2018 – 2022
    Figure-148:    Other Events – Forecast for Other (Corporate Colleagues,Coworkers, Team Members) End Users Market (Million US$), 2023 – 2030


    List of Tables:

    Table-01:    Saudi Arabia Entertainment Market Share by Nationality (Percent), 2018 – 2022
    Table-02:    Saudi Arabia – Forecast for Entertainment Market Share by Nationality (Percent), 2023 – 2030
    Table-03:    Saudi Arabia Entertainment Market Share by Park Type (Percent), 2018 – 2022
    Table-04:    Saudi Arabia – Forecast for Entertainment Market Share by Park Type (Percent), 2023 – 2030
    Table-05:    Saudi Arabia Entertainment Market Share by Segment (Percent), 2018 – 2022
    Table-06:    Saudi Arabia – Forecast for Entertainment Market Share by Segment (Percent), 2023 – 2030
    Table-07:    Saudi Arabia Entertainment Market Share by Gender (Percent), 2018 – 2022
    Table-08:    Saudi Arabia – Forecast for Entertainment Market Share by Gender (Percent), 2023 – 2030
    Table-09:    Saudi Arabia Entertainment Market Share by Age Group (Percent), 2018 – 2022
    Table-10:    Saudi Arabia – Forecast for Entertainment Market Share by Age Group (Percent), 2023 – 2030
    Table-11:    Saudi Arabia Entertainment Market Share by End User (Percent), 2018 – 2022
    Table-12:    Saudi Arabia – Forecast for Entertainment Market Share by End User (Percent), 2023 – 2030
    Table-13:    Saudi Arabia Entertainment Market Share by Monthly Income (Percent), 2018 – 2022
    Table-14:    Saudi Arabia – Forecast for Entertainment Market Share by Monthly Income (Percent), 2023 – 2030
    Table-15:    Saudi Arabia Entertainment Market Share by Region (Percent), 2018 – 2022
    Table-16:    Saudi Arabia – Forecast for Entertainment Market Share by Region (Percent), 2023 – 2030

    • Description
      Price
    • Chapter 1 & 4     Pages : 4
      $200
    • Chapter 5     Pages : 6
      $200
    • Chapter 6     Pages : 3
      $300
    • Chapter 8.1     Pages : 4
      $200
    • Chapter 8.2     Pages : 4
      $200
    • Chapter 8.3     Pages : 4
      $200
    • Chapter 8.4     Pages : 10
      $400
    • Chapter 8.5     Pages : 8
      $600
    • Chapter 8.6     Pages : 10
      $400
    • Chapter 8.7     Pages : 10
      $400
    • Chapter 9.1     Pages : 4
      $200
    • Chapter 9.2     Pages : 4
      $200
    • Chapter 9.3     Pages : 10
      $400
    • Chapter 9.4     Pages : 8
      $400
    • Chapter 9.5     Pages : 10
      $400
    • Chapter 9.6     Pages : 10
      $400
    • Chapter 10.1     Pages : 4
      $200
    • Chapter 10.2     Pages : 4
      $200
    • Chapter 10.3     Pages : 10
      $400
    • Chapter 10.4     Pages : 8
      $400
    • Chapter 10.5     Pages : 8
      $400
    • Chapter 10.6     Pages : 10
      $400
    • Chapter 11.1.1     Pages : 2
      $100
    • Chapter 11.1.2     Pages : 2
      $100
    • Chapter 11.1.3     Pages : 2
      $100
    • Chapter 11.1.4     Pages : 2
      $100
    • Chapter 11.1.5     Pages : 2
      $100
    • Chapter 11.2.1     Pages : 2
      $100
    • Chapter 11.2.2     Pages : 2
      $100
    • Chapter 11.2.3     Pages : 2
      $100
    • Chapter 11.2.4     Pages : 2
      $100

    Related Reports