Non-invasive Aesthetic Treatment Market Report Size and Share Analysis - Growth Trends and Forecast Report 2025-2033
Buy NowNon-Invasive Aesthetic Treatment Market Trends & Summary
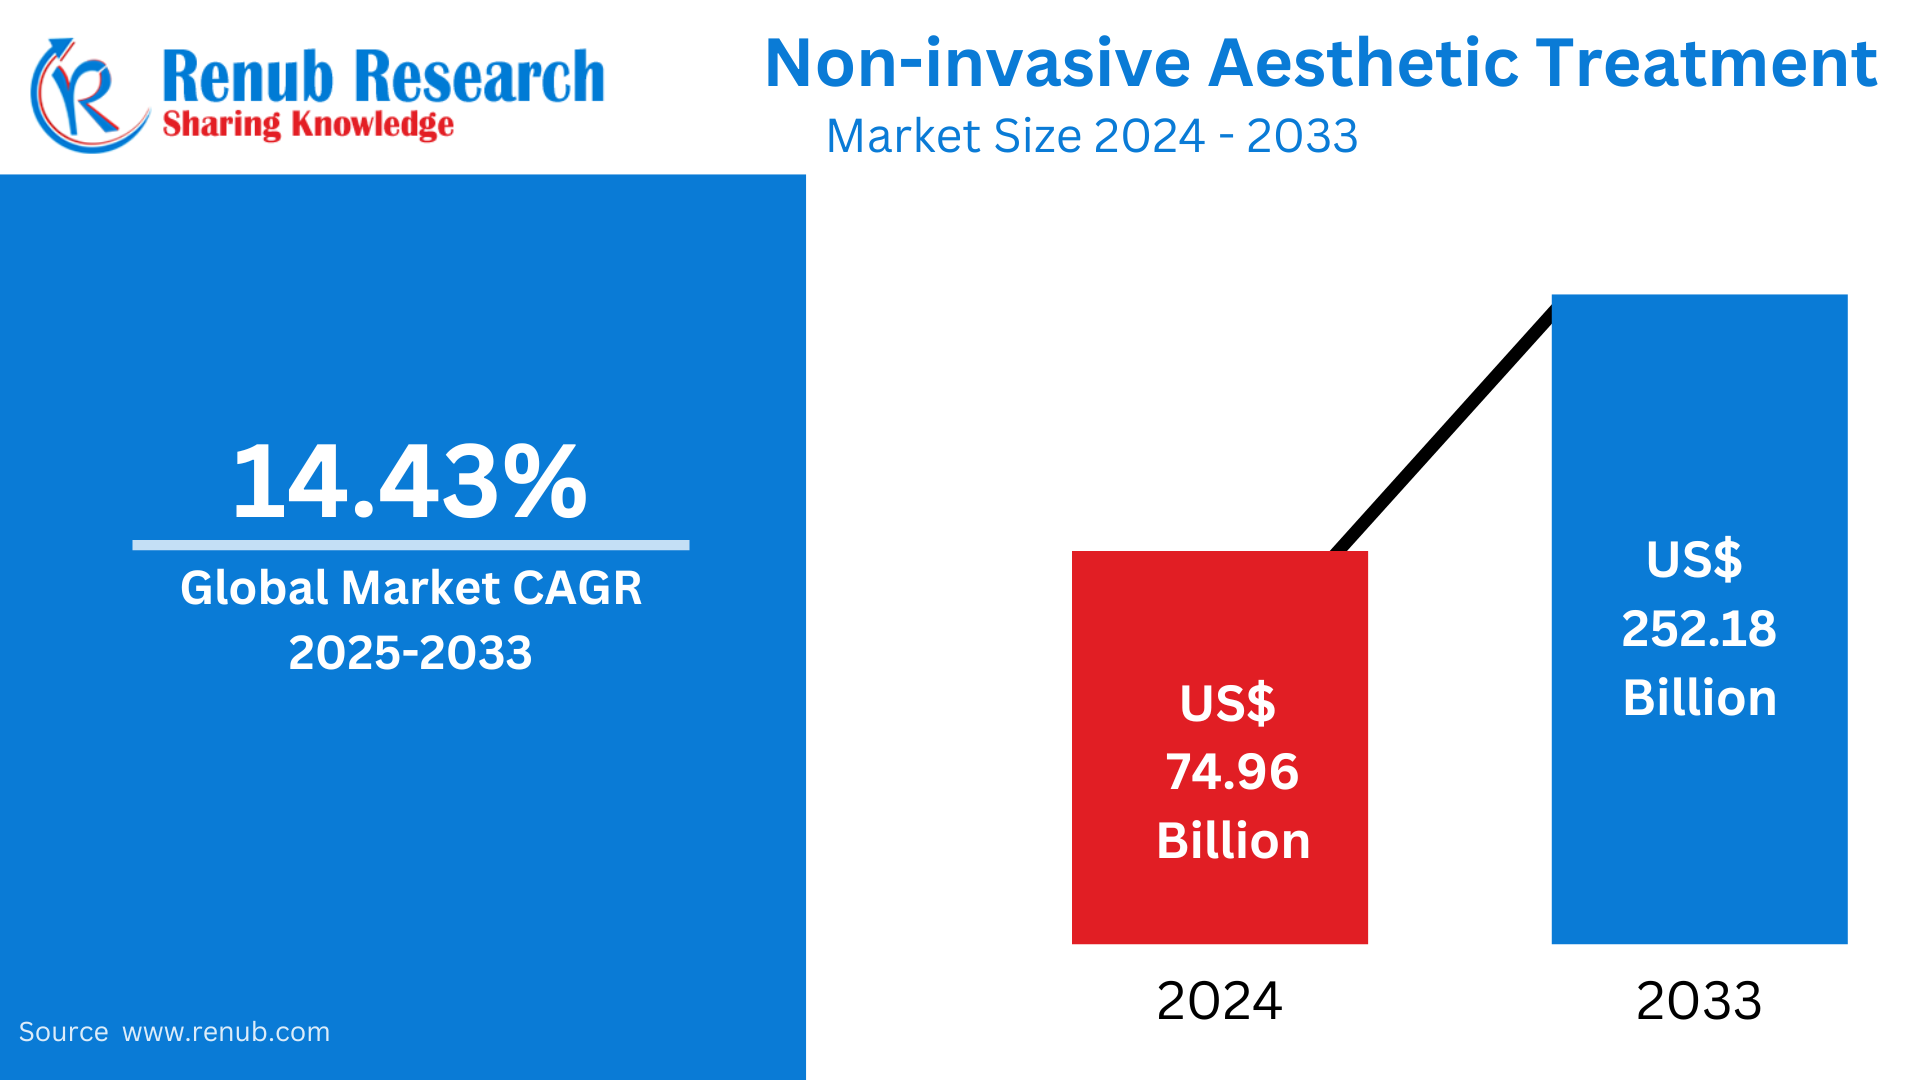
The non-invasive aesthetic treatment market is anticipated to expand from about USD 74.96 billion in 2024 to USD 252.18 billion in 2033, exhibiting a compound annual growth rate (CAGR) of 14.43% over 2025-2033. This is fueled by heightened consumer interest in minimally invasive treatments, technology, and a growing emphasis on physical appearance among different demographics.
Non-invasive Aesthetic Treatment Market Report by Procedure (Injectables, Facial Rejuvenation, and Others), Injectables (Botulinum Toxin, Hyaluronic Acid, Calcium Hydroxylapatite, and Poly-L-Lactic Acid), Facial Rejuvenation (Photo Rejuvenation, Chemical peel, Micro Ablative Resurfacing, and Full field Ablative), Others (Hair Removal, and Non Surgical Fat Reduction), Gender (Male, and Female), End User (Hospital/surgery centre, Medspa, Traditional Spa, and HCP Owned Clinic), Country and Company Analysis 2025-2033
Non-Invasive Aesthetic Treatment Market outlooks
Non-invasive cosmetic treatments are treatments that improve looks without surgery or major downtime. Advanced technologies such as lasers, ultrasound, radiofrequency, and injectables are used in non-invasive cosmetic treatments to smoothen the skin, reduce wrinkles, contour the body, and refresh the overall look.
Examples of popular non-invasive cosmetic treatments include Botox and dermal fillers to soften wrinkles, laser treatment to resurface and correct pigmentation of the skin, and chemical peels for skin exfoliation and regeneration. Body sculpting treatments such as CoolSculpting employ controlled cooling to destroy fat cells, whereas ultrasound and radiofrequency treatments tighten the skin. They are popularly used to treat signs of aging, acne scars, hyperpigmentation, cellulite, and excess fat. They are a safer method compared to surgical treatments with little discomfort, faster recovery, and natural results. The rising demand for such treatments is being fueled by developments in aesthetic technology, heightened beauty awareness, and a desire for minimally invasive treatments that increase confidence and self-esteem without surgery risks.
Drivers of Growth in the Non-Invasive Aesthetic Treatment Market
Rising Demand for Minimally Invasive Treatments
The increased acceptance and awareness of non-invasive aesthetic treatments have resulted in strong demand growth. Patients prefer treatments that deliver evident results with least discomfort and downtime. Procedures such as Botox, laser, and fillers are offering excellent solutions for facial rejuvenation, wrinkle correction, and body sculpting. Preventive procedures are also being sought after by younger segments to keep themselves looking young. Celebrity endorsements, social media pull, and growing disposable income are additional drivers boosting the market and popularizing non-invasive aesthetic treatments. Sept 2023, Stryker introduced the PROstep® MIS Lapidus, a new minimally invasive internal fixation system for the treatment of bunions, hallux valgus deformity. It will be launched at the AOFAS Annual Meeting in Louisville, Ky.
Technology Advancements and Product Innovation
Improvements in technology have greatly increased the safety and effectiveness of non-invasive cosmetic procedures. Technological innovations such as laser, ultrasound-based skin tightening, and cryolipolysis have enhanced patient results. The advent of AI-based skin analysis and customized treatment plans has raised accuracy and customer satisfaction. The innovation in long-lasting fillers and injectables with natural appearance has additionally propelled market growth, enabling practitioners to provide enhanced results with lesser side effects. July 2024, InMode Ltd. (Nasdaq: INMD) released IgniteRF, a new minimally invasive workstation with nine technologies to contract soft tissues at different depths.
Growing Medical Tourism and Expanding Clinic Networks
Many countries, especially in Asia and Europe, are becoming hubs for non-invasive aesthetic procedures due to lower costs and high-quality treatments. Medical tourism is booming as international patients seek affordable and effective cosmetic treatments abroad. Furthermore, the expansion of aesthetic clinics and medical spas, particularly in urban areas, has made these treatments more accessible. Growth has been fueled by the increased presence of specialty aesthetic centers and dermatology clinics with skilled staff, further supporting market confidence with steady growth. Jan 2025, SBC Medical Group Holdings-backed Shonan Beauty Clinic has rolled out a medical aesthetics staff translation app and embarked on its "Inbound-Focused Clinics" initiative. This is in an effort to address the increasing demand for medical tourism and support international patients' access to Japan's high-level aesthetic treatments.
Challenges Facing the Non-Invasive Aesthetic Treatment Market
Regulatory and Safety Issues
In spite of technological progress, regulatory issues and safety problems are a major stumbling block. Most aesthetic treatments need clearance from bodies such as the FDA and EMA, and thus product launches are delayed. There are unregulated clinics and fake products that compromise patient safety. Poor training of practitioners can lead to side effects, destroying consumer confidence. Greater regulation and standardized protocols are needed to ensure treatment effectiveness and safeguard consumers from likely health risks.
High Expenses and Low Insurance Coverage
While the non-invasive procedures are not as costly as surgical options, they are expensive. Most, such as body contouring and laser treatments, take more than one session, which adds up to the expense. Because beauty therapies are electives, there is no reimbursement from most insurance companies. That makes them not accessible to individuals with middle-level incomes. The clinics counter that by providing finance and membership options to make them affordable.
Non-Invasive Botulinum Toxin Aesthetic Treatment Market
The market for non-invasive botulinum toxin treatment has grown at a fast rate because of its success in removing fine lines and wrinkles. Botulinum toxin, or Botox, temporarily paralyzes the muscles of the face to remove dynamic wrinkles. It is applied extensively on forehead lines, crow's feet, and frown lines. The treatments are increasingly being demanded by young people who want prevention. The market is projected to grow with newer products having longer-lasting action and natural effects. Also, increased usage in therapeutic indications such as the treatment of migraine and treatment of excessive sweating adds to its demand.
Non-Invasive Aesthetic Treatment Market
The market for noninvasive aesthetic treatment involves numerous treatments such as injectables, laser treatments, and body sculpting treatments. It is being fuelled by heightened aesthetic awareness, technological innovation in medical aesthetics, and an ageing population in need of rejuvenation. Noninvasive therapies offer an appealing substitute to invasive surgical operations with faster recuperation and decreased dangers. Medical spas and clinics utilize the most modern technology available in order to capitalize on growing customer demand. Steady expansion in the marketplace is expected as formulations in skin care products and devices that emit energy further contribute to improving results.
Non-Invasive Aesthetic Photo Rejuvenation Treatment Market
Photorejuvenation treatments employ intense pulsed light (IPL) and laser technology to enhance skin tone, decrease pigmentation, and correct vascular lesions. The treatments stimulate collagen formation, leaving the skin firmer and younger-looking. The demand for photo rejuvenation is increasing as it can correct a number of skin problems, such as sun damage, rosacea, and acne scars. Patients like these treatments because they are minimally invasive and give gentle, incremental improvements. Growth in aesthetic consciousness and greater accessibility to high-tech laser technology is driving expansion in this market segment.
Non-Invasive Aesthetic Hair Removal Treatment Market
One of the world's most sought-after non-invasive aesthetic treatments is laser hair removal. It provides a permanent solution for unwanted hair by destroying hair follicles with laser energy. The market has seen consistent growth as a result of technological advancements, with treatments becoming more efficient and compatible with different skin types. The growing popularity of home laser hair removal devices has also helped expand the market. Customers are opting for these treatments instead of conventional procedures such as waxing and shaving due to their long-term effects and ease of use. The presence of advanced cooling systems in laser devices has enhanced patient comfort, also contributing to increased adoption.
Non-Invasive Aesthetic Female Treatment Market
The female non-invasive aesthetic treatment market includes procedures catering specifically to women’s aesthetic concerns. These include facial injectables, skin tightening, body sculpting, and intimate rejuvenation treatments. The increasing demand for youthful appearance, post-pregnancy body restoration, and hormonal balance-related skin concerns have driven market growth. Non-invasive vaginal rejuvenation treatments using laser and radiofrequency technology are gaining popularity among women seeking improved confidence and comfort. Growing women-oriented aesthetic clinics and customized treatment methods further accelerate the market.
Non-Invasive Aesthetic Traditional Spa Treatment Market
Traditional spa treatments such as facials, microdermabrasion, and oxygen therapy are now a part of the non-invasive aesthetic market. They ensure relaxation and skin rejuvenation without involving medical procedures. The wellness trend at the global level has driven demand for natural and holistic skincare. Spas are adopting new modalities such as LED therapy, hydro facials, and natural skincare products to advance treatment results. Blending conventional therapy with contemporary non-invasive technology has also drawn in a wider consumer base, thereby fueling consistent market growth.
United States Non-Invasive Aesthetic Treatment Market
The U.S. is the premier market for non-invasive aesthetic treatments due to superior disposable income, cosmetic consciousness, and technological advancements. The nation is dominated by dermatology and medical aesthetic clinics with diverse therapies available. Hollywood influence and social media have driven customer demand for the pursuit of eternal youth. Further, the access to FDA-approved innovative aesthetic products has contributed to market expansion. With a growing population and a surge in male customers, the U.S. market will further grow. April 2024, Cartessa Aesthetics debuted PHYSIQ 360, the latest technology in customizable, non-invasive body contouring to reduce fat and develop muscle for all skin and body types.
France Non-Invasive Aesthetic Treatment Market
With its focus on beauty and skincare, France is a leading market for non-invasive aesthetic treatments. French patients are interested in maintaining healthy skincare and seek natural-looking outcomes. A rising need for anti-aging treatments, dermal fillers, and lasers propels the market. Paris specifically has a high number of aesthetic clinics and high-end medical spas with state-of-the-art treatments. France's regulatory environment guarantees high-standard procedures, which further enforces consumer confidence. The rising trend of blending ancient French skincare methods with contemporary non-surgical procedures reinforces market growth. Sept2024, Merz Aesthetics, the biggest medical aesthetics company, has introduced Ultherapy PRIME, a noninvasive, FDA-approved treatment that provides a customized, long-term skin lift in one treatment with no downtime.
India Non-Invasive Aesthetic Treatment Market
India's non-invasive aesthetic treatment market is growing fast because of increasing disposable income, urbanization, and growing awareness about aesthetic treatments. The nation has experienced a boom in medical tourism, with global patients looking for inexpensive, high-standard treatments. High-demand techniques are laser hair reduction, skin lightening treatments, and injectables. Bollywood's impact and social media influences have played a strong role in increasing market growth. Indian aesthetic centers invest in technology and training specialists to cope with the rising demand for safe, efficient, non-surgical procedures. Sep 2024, Apollo Hospitals Ahmedabad has introduced the Apollo Female Aesthetic Studio, offering FemRejuvenate Therapy to enhance vaginal health and enhance women's intimacy, wellness, and confidence.
Saudi Arabia Non-Invasive Aesthetic Treatment Market
Saudi Arabia's non-invasive aesthetic treatment market has expanded as a result of cultural changes and rising acceptance of cosmetic treatments. The country's wealthy population is ready to spend on high-end aesthetic treatments. Laser hair removal, skin rejuvenation, and body contouring are very popular among both men and women. Government policies to promote the healthcare and wellness industries have prompted the opening of high-tech aesthetic clinics. With changing attitudes in society, the market is likely to grow, with a strong emphasis on innovative and high-quality treatments. November 2022: Bahrain welcomed the BDLA5 2022, the fifth Bahrain Dermatology, Laser, and Aesthetics Conference and Exhibition. The conference centered on cosmetic medicine, dermatology, and the treatment of incurable skin conditions such as psoriasis and vitiligo, highlighting the newest laser equipment for plastic and dermatological surgery.
Non-Invasive Aesthetic Treatment Market Segments
Procedure
Injectables
- Botulinum Toxin
- Hyaluronic Acid
- Calcium Hydroxylapatite
- Poly-L-Lactic Acid
Facial Rejuvenation
- Photo Rejuvenation
- Chemical peel
- Micro Ablative Resurfacing
- Full field Ablative
Others
- Hair Removal
- Non-Surgical Fat Reduction
Gender
- Male
- Female
End User
- Hospital/surgery centre
- Medspa
- Traditional Spa
- HCP Owned Clinic
Countries
North America
- United States
- Canada
Europe
- France
- Germany
- Italy
- Spain
- United Kingdom
- Belgium
- Netherlands
- Turkey
Asia Pacific
- China
- Japan
- India
- Australia
- South Korea
- Thailand
- Malaysia
- Indonesia
- New Zealand
Latin America
- Brazil
- Mexico
- Argentina
Middle East & Africa
- South Africa
- Saudi Arabia
- UAE
All the Key players have been covered from 5 Viewpoints:
- Business Overview
- Key Persons
- Product Portfolio
- Recent Development & Strategies
- Sales Analysis
Key Players Analysis
- Johnson & Johnson
- Bausch Health Companies Inc.
- Cutera Inc.
- Abbvie Inc.
- Sisram Medical Ltd.
- Galderma S.A.
- Sientra Inc.
- Revance Therapeutics Inc.
Report Details:
| Report Features | Details |
| Base Year |
2024 |
| Historical Period |
2020 - 2024 |
| Forecast Period |
2025 - 2033 |
| Market |
US$ Billion |
| Segment Covered |
By Procedure, By Gender, By End User and By Countries |
| Countries Covered |
|
| Companies Covered |
|
| Customization Scope |
20% Free Customization |
| Post-Sale Analyst Support |
1 Year (52 Weeks) |
| Delivery Format |
PDF and Excel through Email (We can also provide the editable version of the report in PPT/Word format on request) |
Key Questions Answered in This Report:
-
What is the projected market size for the non-invasive aesthetic treatment industry in 2033?
-
What is the compound annual growth rate (CAGR) of the non-invasive aesthetic treatment market from 2025 to 2033?
-
What are the primary factors driving the growth of the non-invasive aesthetic treatment market?
-
How does technological innovation influence the market for non-invasive aesthetic treatments?
-
What are some examples of popular non-invasive cosmetic treatments?
-
What challenges does the non-invasive aesthetic treatment market face, particularly regarding regulation and safety?
-
How is the rising demand for minimally invasive treatments impacting the market for non-invasive aesthetic procedures?
-
In what way does medical tourism contribute to the growth of the non-invasive aesthetic treatment market?
-
How are regulatory bodies, like the FDA and EMA, influencing the safety and accessibility of non-invasive aesthetic treatments?
-
Which countries are the leading markets for non-invasive aesthetic treatments, and why?
Customization Services available
- Analysis of Market Size and Its Segments
- More Company Profiles (Upto 10 without any additional cost):
- Additional Countries (Other than mentioned Countries):
- Region/Country Specific Reports:
- Market Entry Strategy:
- Region-Specific Market Dynamics:
- Regional Market Share Analysis:
- Trade Analysis:
- Production Insights:
- Others Customized Requests:
For more information contact our analysts.
Need More Assistance?
- Talk to our analysts to get more precious information on the current market trends.
- Include more countries and segments and customize the report based on the final requirement.
- Get a competitive advantage in your industry by knowing the report findings and making a positive impact on your revenues and operations.
- Our analysts are always ready to provide more help and pertinent information if you need any additional assistance.