Natural Food Colors Market Size, Forecast 2025-2033
Buy NowNatural Food Colors Market Trends & Summary
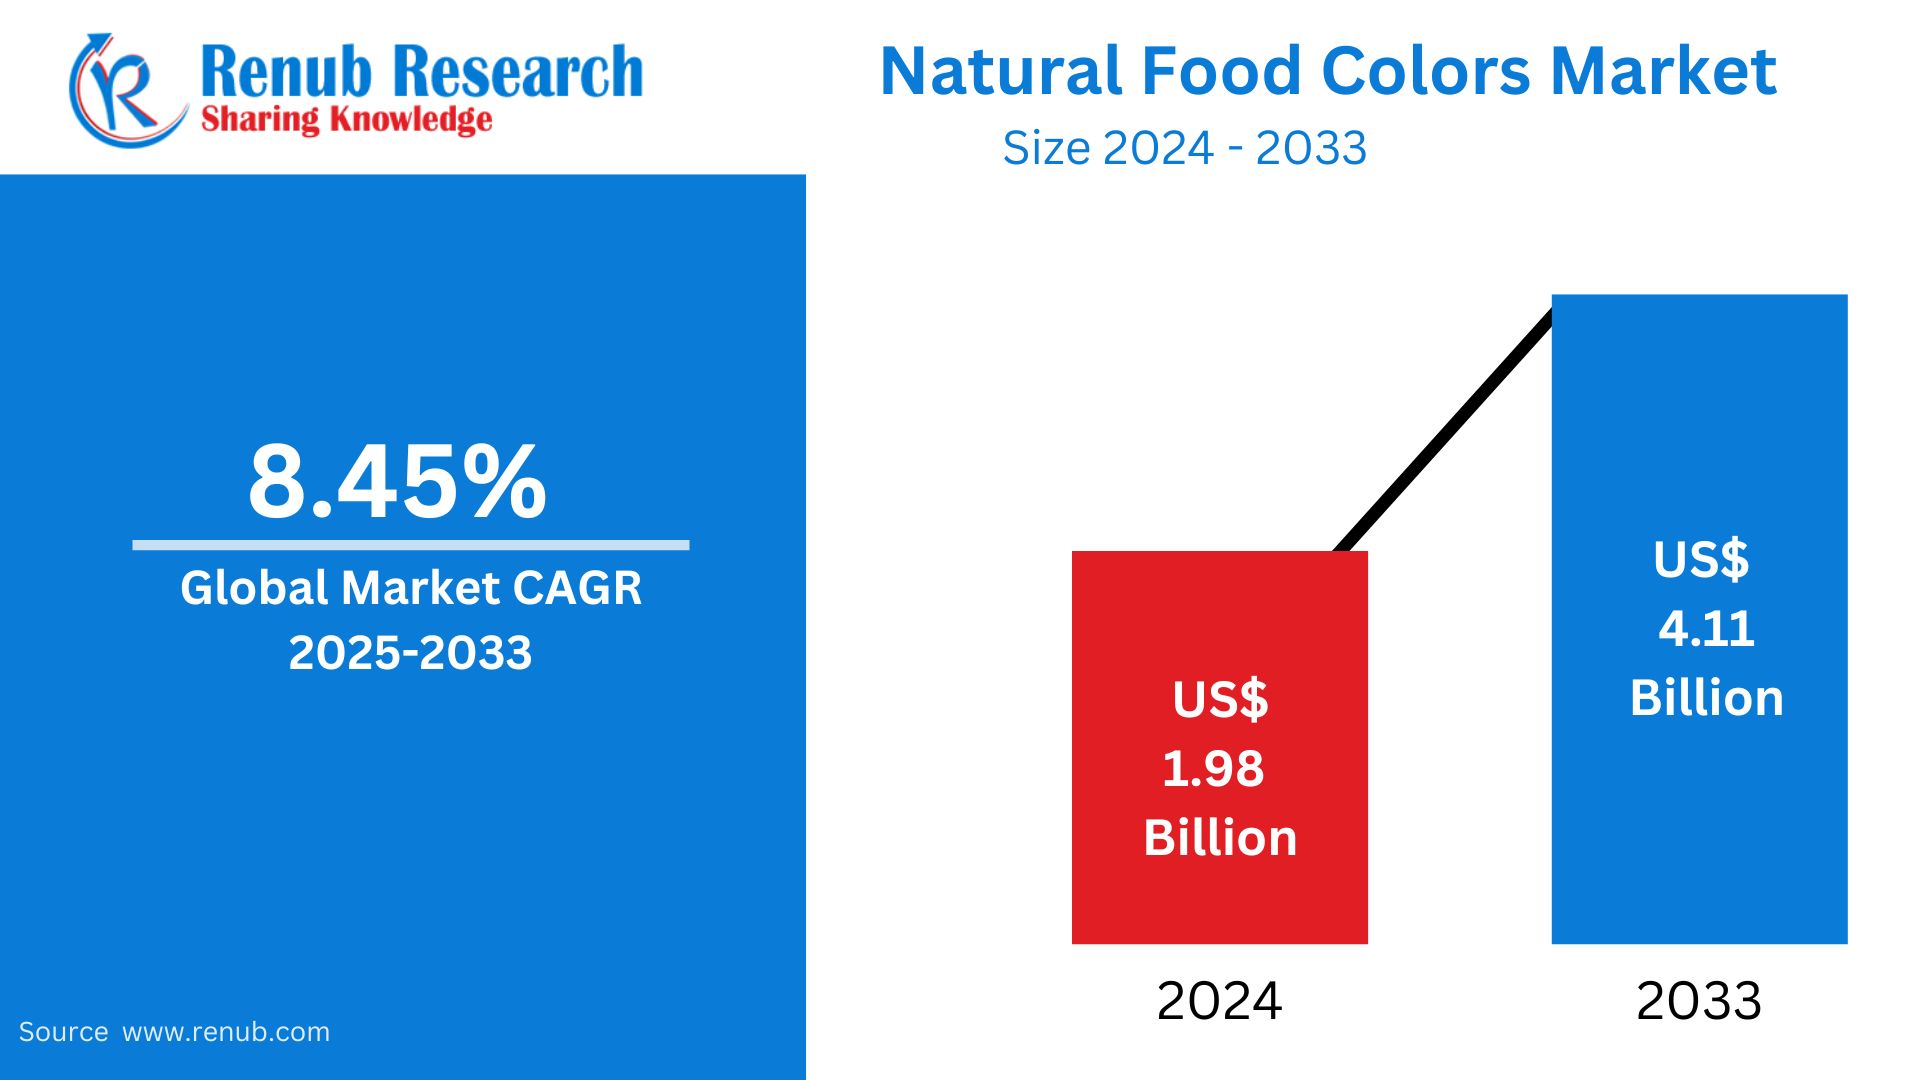
The natural food colors market size globally is estimated to reach US$ 4.11 billion by 2033, growing from US$ 1.98 billion in 2024. The market growth is motivated by the surge in consumer desire for clean-label and plant-based products. Projected to exhibit a CAGR of 8.45% between 2025 and 2033, the market will flourish as the food industry looks to natural sources for improved safety and sustainability.
Natural Food Colors Market Report by Ingredient (Beta-carotene, Lycopene, Curcumin, Anthocyanin, Carmine, Copper Chlorophyllin, Paprika, Betanin, Riboflavin, Blue Spirulina, Caramel, Annatto, Others), Application (Bakery & Confectionery, Beverages, Dairy & Frozen Products, Meat Products, Oils & Fats, Fruits & Vegetables, Meat Alternatives/ Plant-based Meat, Pet Food), Regions and Company Analysis 2025-2033.
Natural Food Colors Market Outlooks
Natural food colors are plant, animal, or mineral-based without synthetic additives or chemicals. These food colors are purified from fruits, vegetables, spices, and other natural materials like beetroot (red), turmeric (yellow), spirulina (blue), and annatto (orange). Unlike artificial food colorants, natural colors are safe, non-toxic, and good for health-conscious consumers looking for clean-label products.
Natural food colors find extensive application in the food and beverages industry to add visual appeal to products without altering their natural nature. They are featured in confectionery, dairy items, beverages, bakery items, and snacks. They are also employed in pharmaceuticals, cosmetics, and animal nutrition. Escalating demand for organic and plant-based food has increased the use of natural food colors, with companies increasingly substituting synthetic dyes. As regulatory authorities enforce stricter regulations on artificial additives, natural food colors are increasingly becoming popular as a safe and environmentally friendly alternative in the international market.
Drivers of Growth in the Natural Food Colors Market
Rising Consumer Demand for Clean Label Products
With consumers becoming increasingly health-conscious, there is growing demand for clean-label products that are free from artificial additives and synthetic ingredients. Natural food colors provide a healthier, more transparent solution, enabling manufacturers to respond to this demand. Consumers are more and more turning to products with natural ingredients, particularly in snack foods, beverages, and packaged foods. This trend is propelling the market for natural food colors as more food companies try to substitute artificial colors with plant-based colors that fit consumer needs for wellness-oriented products. Growing organic product demand stems primarily from perceived health benefits. Organic food turnover was USD 142.3 billion (EUR 135 billion) in 2022, as estimated by FIBL. Organic products are cultivated with no use of synthetic fertilizers, pesticides, growth hormones, or antibiotics and contain no GMOs. Extensive application of natural colors takes place in organic foods to maximize their attractiveness. Thus, the increased demand for natural foods fuels the demand for natural colors.
Increasing Health Consciousness
Increasing consciousness about the health hazards of synthetic food additives is another key driver. The awareness of the health hazards of such additives, like allergic reactions and hyperactivity among children, increases the demand for natural food colors from plant-based sources like vegetables, fruits, and spices. They are chemical-free and contain antioxidants that could lead to improved health. This has seen an upsurge in demand from health-aware consumers, forcing the market towards the use of natural alternatives. Manufacturers are now promoting their products as containing no artificial additives, improving the attractiveness of natural food color.
Tough Regulatory Standards
Governments and regulatory agencies are enforcing tougher regulations on synthetic food colors in response to safety issues. These regulations have provided a platform for natural food colors to flourish as they align with the increasing trend of transparency and sustainability in the food sector. Natural food colors from safe and approved sources are receiving regulatory backing in different regions, resulting in increased market opportunities. The move towards natural alternatives is also promoted by regulatory actions restricting artificial colors' application in food manufacturing. Food colors and flavoring ingredients are commonly utilized in order to lure consumers. Food colors' impacts on food are immense as they are instrumental in the aesthetic appearance of the food. Jun 2024, In India, the FSSAI (Food Safety and Standards Authority of India) has endorsed certain food colors and flavors which are safe to consume. Only the FSSAI-approved food colors and flavors may be employed in foods. The FSSAI has established the list of approved food coloring and flavoring agents and their specifications in the Food Safety and Standards (Food Product Standards and Food Additives) Regulations, 2011 ('Regulations').
Natural Food Colors Market Challenges
Increased Production Costs
Natural food colors tend to have a higher cost of production than synthetic counterparts. Harvesting bright colors from nature, e.g., fruits, vegetables, and plants, can be costly because specialized processing methods are needed. Additionally, natural pigments might need additional raw materials to achieve the color intensity desired. This increases the cost of natural food colors for manufacturers, which can eventually raise the price of final products. Consequently, there may be reluctance by some producers to switch to natural food colorants because of the possible effect on their profit margins.
Short Shelf Life and Stability
Natural food colors will also have a shorter shelf life and lower stability than synthetic colors, which may restrict their applications in certain cases. Most natural colorants are sensitive to heat, light, and pH values and, consequently, will deteriorate over a period of time. This instability can cause color to fade, impacting the visual quality and overall quality of food products. Manufacturers can find it difficult to maintain consistency in the end product and might have to use complicated preservation processes to maintain the shelf life of the color. This is a hindrance to the wider use of natural food colors in mass production.
Natural Lycopene Food Colors Market
Lycopene, a strong antioxidant in tomatoes, is being employed more and more as a natural food colorant because of its bright red color. The market for natural lycopene food colors is growing as consumers are looking for healthier, plant-based options to artificial colors. Lycopene is famous for its coloration characteristics as well as its health advantages, including lowering the risk of heart disease and some cancers. As the realization about these advantages expands, demand for lycopene colorants for food and beverages is increasing. This industry should continue to witness growth in such areas as juices, sauces, and processed food.
Natural Anthocyanin Food Colors Market
Anthocyanins are natural colorings found in various vegetables and fruits, including berries, grapes, and red cabbage. These dyes contain purple, blue, and red colors and are significantly used in food applications as a natural coloring material. The natural anthocyanin food colors market is propelled by the growing demand for clean-label products and the increasing trend toward natural, plant-based ingredients. With their antioxidant activity, anthocyanins are particularly prized for their intense color and purported health benefits, additionally fueling the use of such colors in drinks, dairy foods, and confectioneries.
Natural Riboflavin Food Colors Market
Riboflavin, vitamin B2, is a natural yellow-orange food coloring obtained from yeast and some green vegetables. With consumer preferences turning towards healthier and more natural foods, riboflavin is finding favor with food manufacturers wishing to substitute synthetic yellow dyes. The market of riboflavin food color is growing through different food types, such as dairy, bakery, and beverage. Riboflavin is a stable and safe option along with nutritional superiority. It is picking up demand in health-targeted products and, as there is more information about its origin from nature, its application to food products can be expected to grow.
Natural Bakery & Confectionery Food Colors Market
The market for natural bakery and confectionery food colors is witnessing major growth because of the growing need for cleaner, healthier alternatives to manmade food dyes. Natural colors extracted from fruits, vegetables, and plants are now employed to color pastries, cakes, candies, and chocolates. As consumers increasingly choose natural ingredients, companies use natural food colors to address the demand for clean and safer products. Natural colorants such as beet juice, spinach powder, and turmeric are in vogue for imparting bright colors to bakery and confectionery items without affecting health or safety.
Natural Beverages Food Colors Market
The natural beverages food coloring industry is experiencing growing demand as people become increasingly health-aware and look for drinks that are completely free from artificial additives. Fruit, vegetable, and spice natural colors are utilized to dye juices, sodas, energy drinks, and spirits. Natural colorants offer strong shades and carry further health advantages in the form of antioxidants. Beverage companies opt more and more for natural food colors as customers look for clarity and cleaner labeling, thus emerging as one of the most rapidly expanding categories within the natural food colors market.
Natural Meat Products Food Colors Market
Natural colors are being widely utilized in meat products to function as substitutes for artificial color additives such as nitrates and nitrites used in processed meat to make the meat look appealing. Natural food colorants in the form of beet juice, paprika, and annatto are added in sausages, deli meats, and bacon to bring forth attractive and intense colors in the final products while responding to the demand for clean-label items. With growing health and food safety issues, consumers prefer meat products that contain natural ingredients. This trend is propelling the growth of the natural meat products food colors market, which is likely to keep growing.
United States Natural Food Colors Market
The United States is among the biggest markets for natural food colors, fueled by consumer demand for healthier, more transparent foods. Growing consumer demand for organic and clean-label products has spurred manufacturers to switch from artificial colorants to natural colorants. The U.S. market is experiencing a move toward natural colorants from sources such as fruits, vegetables, and spices, with growing use in food categories such as beverages, snacks, and dairy products. Regulatory backing and increasing awareness of the possible health hazards of synthetic additives are also driving the natural food colors market in the United States. June 2024, California Natural Color launched Pure Purple Butterfly Pea, which is derived from grape seed.
United Kingdom Natural Food Colors Market
In the United Kingdom, the market for natural food colors is witnessing strong growth with increasing awareness of consumers about the health hazards caused by artificial food colors. Consumers are increasingly seeking food products containing clean and natural ingredients, driving many food manufacturers to seek out natural colorants. The U.K. market is concerned with transparency and sustainability, and natural food colors derived from plant-based sources are becoming increasingly popular. Government policies that limit the use of artificial colorants and increasing consumer demand for organic and health-oriented products drive the U.K. natural food colors market growth.
India Natural Food Colors Market
Natural food colors market in India is growing at a very fast rate because of growing health and wellness awareness and trend towards traditional plant-based food ingredients. The market is experiencing increasing demand for natural color across industries, including dairy, snacks, and beverages. India's diverse agriculture offers tremendous natural food colorants, including turmeric, beetroot, and spirulina. The increasing middle-class population and the need for clean-label foods further propel the market. In November 2024, Adani Wilmar Limited will concentrate on health-oriented innovation and sustainability in the Indian food color market, diversifying its portfolio with fortified foods and low-fat oils to cater to growing demand for healthy foods.
Saudi Arabia Natural Food Colors Market
The Saudi Arabian natural food colors market is expanding as a result of growing consumer demand for organic and clean-label food products. As awareness regarding the health hazard of artificial additives increases, manufacturers are moving toward natural colorants from fruits, vegetables, and plant sources. Demand is most prominent in the beverage, confectionery, and dairy segments. Government policies encouraging healthier options and the growth of the halal food industry further contribute to market development. With the continuous development of Saudi Arabia's food market, the use of natural food colorants is forecasted to increase, focusing on health-related consumers.
Natural Food Colors Market Segments
Ingredient
- Beta-carotene
- Lycopene
- Curcumin
- Anthocyanin
- Carmine
- Copper Chlorophyllin
- Paprika
- Betanin
- Riboflavin
- Blue Spirulina
- Caramel
- Annatto
- Others
Application
- Bakery & Confectionery
- Beverages
- Dairy & Frozen Products
- Meat Products
- Oils & Fats
- Fruits & Vegetables
- Meat Alternatives/ Plant-based Meat
- Pet Food
Countries
North America
- United States
- Canada
Europe
- France
- Germany
- Italy
- Spain
- United Kingdom
- Belgium
- Netherlands
- Turkey
Asia Pacific
- China
- Japan
- India
- Australia
- South Korea
- Thailand
- Malaysia
- Indonesia
- New Zealand
Latin America
- Brazil
- Mexico
- Argentina
Middle East & Africa
- South Africa
- Saudi Arabia
- UAE
All the Key players have been covered from 4 Viewpoints:
- Company overview
- Key Persons
- Sales Analysis
- Recent Development & Strategies
Key Players Analysis
- Archer Daniels Midland
- Symrise AG
- Chr Hansen Holding A/S
- McCormick Company
- Givaudan
- International Flavors & Fragrances Inc.
- Ingredion Inc.
- BASF SE
- FMC Corporation
Report Details:
| Report Features | Details |
| Base Year |
2024 |
| Historical Period |
2020 - 2024 |
| Forecast Period |
2025 - 2033 |
| Market |
US$ Billion |
| Segment Covered |
By Ingredient, By Application and By Countries |
| Countries Covered |
|
| Companies Covered |
|
| Customization Scope |
20% Free Customization |
| Post-Sale Analyst Support |
1 Year (52 Weeks) |
| Delivery Format |
PDF and Excel through Email (We can also provide the editable version of the report in PPT/Word format on request) |
Customization Services available
- Analysis of Market Size and Its Segments
- More Company Profiles (Upto 10 without any additional cost):
- Additional Countries (Other than mentioned Countries):
- Region/Country Specific Reports:
- Market Entry Strategy:
- Region-Specific Market Dynamics:
- Regional Market Share Analysis:
- Trade Analysis:
- Production Insights:
- Others Customized Requests:
For more information contact our analysts.
Need More Assistance?
- Talk to our analysts to get more precious information on the current market trends.
- Include more countries and segments and customize the report based on the final requirement.
- Get a competitive advantage in your industry by knowing the report findings and making a positive impact on your revenues and operations.
- Our analysts are always ready to provide more help and pertinent information if you need any additional assistance.