1. Executive Summary
2. Lithium-ion Battery Market
3. Lithium-ion Battery Volume
4. Lithium-ion Battery Share Analysis
4.1 Market Share
4.2 Volume Share
5. Cathode Market & Forecast – Lithium-Ion Batteries Materials
5.1 LCO (Lithium Cobalt Oxide) Market & Forecast
5.2 NMC (Lithium Nickel Manganese Cobalt Oxide) Market & Forecast
5.3 NCA (Lithium Nickel Cobalt Aluminum Oxide) Market & Forecast
5.4 LMO (Lithium Manganese Oxide) Market & Forecast
5.5 LPF (Lithium Iron Phosphate) Market & Forecast
5.6 Anode Market & Forecast
5.7 Separator Market & Forecast
5.8 Electrolyte Market & Forecast
6. By Products – Global Lithium-ion Battery Market
6.1 LCO (Lithium Cobalt Oxide) Market & Forecast
6.1.1 Smart Phone & Tablet Market
6.1.2 Portable PCs Market
6.1.3 Other Electronics Market
6.2 NMC (Lithium Nickel Manganese Cobalt Oxide) Market & Forecast
6.2.1 Smart Phones & Tablet Market
6.2.2 Portable PCs Market
6.2.3 Other Electronics Market
6.2.4 Power Tools, E-bikes Market
6.2.5 xEV Market
6.2.6 Others Market
6.3 NCA (Lithium Nickel Cobalt Aluminium Oxide) Market & Forecast
6.3.1 Smart Phones & Tablet Market
6.3.2 Other Electronics Market
6.3.3 Power Tools, E-bikes Market
6.3.4 xEV Market
6.3.5 Others Market
6.4 LMO (Lithium Manganese Oxide) Market & Forecast
6.4.1 By Power Tools, E-bikes Market
6.4.2 By xEV Market
6.4.3 By Industrial Market
6.4.4 By Others Market
6.5 LPF (Lithium Iron Phosphate) Market & Forecast
6.5.1 By Power Tools, E-bikes Market
6.5.2 E-Bus Market
6.5.3 Industrial Market
6.5.4 Others Market
6.6 Anode Market & Forecast
6.6.1 Natural Graphite Market
6.6.2 Artificial Graphite Market
6.6.3 Other Anode Materials Market
6.7 Electrolyte Market & Forecast
6.7.1 Portable Electronics Market
6.7.2 Power Tools Market
6.7.3 E-Bike Market
6.7.4 Automotive & E-Bus Market
6.7.5 Industrial Market
7. By Materials (Tons) – Global Lithium-Ion Batteries Volume
7.1 Cathode Volume & Forecast
7.1.1 LCO (Lithium Cobalt Oxide) Volume
7.1.2 NMC (Lithium Nickel Manganese Cobalt Oxide) Volume
7.1.3 NCA (Lithium Nickel Cobalt Aluminium Oxide) Volume
7.1.4 LMO (Lithium Manganese Oxide) Volume
7.1.5 LPF (Lithium Iron Phosphate) Volume
7.2 Anode Volume & Forecast
7.2.1 Natural Graphite Volume
7.2.2 Artificial Graphite Volume
7.2.3 Other Anode Materials Volume
7.3 Electrolyte Volume
8. Global Li-ion Battery Value Chain Analysis
9. Samsung SDI – Company Analysis
9.1 Overview
9.2 Business Portfolio
9.2.1 Point No. 1
9.2.2 Point No. 2
9.2.3 Point No. 3
9.3 Sales Analysis
9.3.1 Annual Production Volume (Million Cells)
9.3.2 Sales Value (Million US$)
10. SANYO-PANASONIC – Company Analysis
10.1 Overview
10.2 Business Portfolio
10.2.1 Point No. 1
10.2.2 Point No. 2
10.3 Sales Analysis
10.3.1 Annual Production Volume (Million Cells)
10.3.2 Sales Value (Million US$)
11. LG Chem. Power (LGCPI) – Company Analysis
11.1 Overview
11.2 Business Portfolio
11.2.1 Point No. 1
11.2.2 Point No. 2
11.2.3 Point No. 3
11.2.4 Point No. 4
11.3 Sales Analysis
11.3.1 Annual Production Volume (Million Cells)
11.3.2 Sales Value (Million US$)
12. Amperex Technology Limited (ATL) – Company Analysis
12.1 Overview
12.2 Business Portfolio
12.2.1 Point No. 1
12.2.2 Point No. 2
12.3 Sales Analysis
12.3.1 Annual Production Volume (Million Cells)
12.3.2 Sales Value (Million US$)
13. Key Growth Drivers
13.1 Continuous Decline of Lithium-ion Battery Prices
13.2 Repurposing and Recycling of Lithium-ion Battery
13.3 Raising the demand of Electric Powered Vehicles (xEVs)
14. Key Challenges
14.1 Safety
List of Figures:
Figure 2‑1: Global – Lithium-ion Battery Market by Materials (Billion US$), 2010 – 2017
Figure 2‑2: Global – Forecast for Lithium-ion Battery Market by Materials (Billion US$), 2018 – 2024
Figure 3‑1: Global – Lithium-ion Battery Sales Volume (Tons) by Materials, 2010 – 2017
Figure 3‑2: Global – Forecast for Lithium-ion Battery Sales Volume (Tons) by Materials, 2018 – 2024
Figure 4‑1: Global – Lithium-ion Battery Market Share (Percent) by Materials, 2010 – 2017
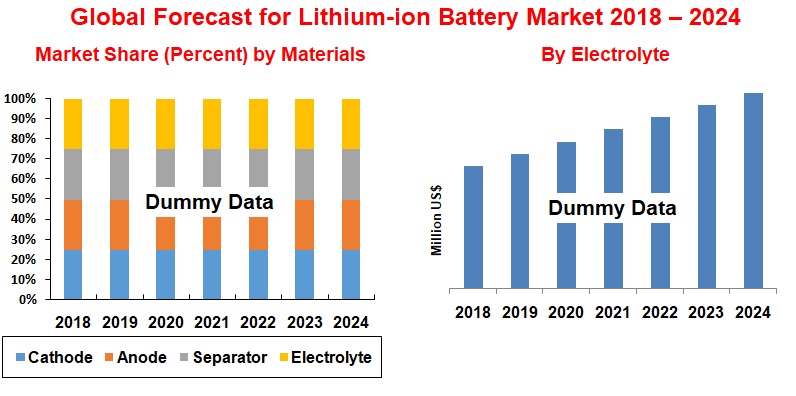
Figure 4‑2: Global – Forecast for Lithium-ion Battery Market Share (Percent) by Materials, 2018 – 2024
Figure 4‑3: Global – Lithium-ion Battery Volume Share (Percent) by Materials, 2010 – 2017
Figure 4‑4: Global – Forecast for Lithium-ion Battery Volume Share (Percent) by Materials, 2018 – 2024
Figure 5‑1: Global – Lithium-ion Battery Market by Cathode Material (Billion US$), 2010 – 2017
Figure 5‑2: Global – Forecast for Lithium-ion Battery Market by Cathode Material (Billion US$), 2018 – 2024
Figure 5‑3: Global – Lithium Cobalt Oxide Market (Million US$), 2010 – 2017
Figure 5‑4: Global – Forecast for Lithium Cobalt Oxide Market (Million US$), 2018 – 2024
Figure 5‑5: Global – Lithium Nickel Manganese Cobalt Oxide Market (Million US$), 2010 – 2017
Figure 5‑6: Global – Forecast for Lithium Nickel Manganese Cobalt Oxide Market (Million US$), 2018 – 2024
Figure 5‑7: Global – Lithium Nickel Cobalt Aluminum Oxide Market (Million US$), 2015 – 2017
Figure 5‑8: Global – Forecast for Lithium Nickel Cobalt Aluminum Oxide Market (Million US$), 2018 – 2024
Figure 5‑37: Global – Lithium Manganese Oxide Market (Million US$), 2010 – 2017
Figure 5‑10: Global – Forecast for Lithium Manganese Oxide Market (Million US$), 2018 – 2024
Figure 5‑11: Global – Lithium Iron Phosphate Market (Million US$), 2010 – 2017
Figure 5‑12: Global – Forecast for Lithium Iron Phosphate Market (Million US$), 2018 – 2024
Figure 5‑13: Global – Lithium-ion Battery Market by Anode Materials (Million US$), 2010 – 2017
Figure 5‑14: Forecast for Lithium-ion Battery Market by Anode Materials (Million US$), 2018 – 2024
Figure 5‑15: Global – Lithium-ion Battery Market by Separator (Million US$), 2010 – 2017
Figure 5‑16: Global – Forecast for Lithium-ion Battery Market by Separator (Million US$), 2018 – 2024
Figure 5‑17: Global – Lithium-ion Battery Market by Electrolyte (Million US$), 2010 – 2017
Figure 5‑18: Global – Forecast for Lithium-ion Battery Market by Electrolyte (Million US$), 2018 – 2024
Figure 6‑1: Lithium Cobalt Oxide – Smart Phone & Tablet Market (Million US$), 2010 - 2017
Figure 6‑2: Lithium Cobalt Oxide – Forecast for Smart Phone & Tablet Market (Million US$), 2018 - 2024
Figure 6‑3: Lithium Cobalt Oxide – Portable PCs Market (Million US$), 2010 - 2017
Figure 6‑4: Lithium Cobalt Oxide – Forecast for Portable PCs Market (Million US$), 2018 - 2024
Figure 6‑5: Lithium Cobalt Oxide – Other Electronic Market (Million US$), 2010 - 2017
Figure 6‑6: Lithium Cobalt Oxide – Forecast for Other Electronic Market (Million US$), 2018 - 2024
Figure 6‑7: Lithium Nickel Manganese Cobalt Oxide – Smart Phone & Tablet Market (Million US$), 2015 – 2017
Figure 6‑8: Lithium Nickel Manganese Cobalt Oxide – Forecast for Smart Phone & Tablet Market (Million US$), 2018 – 2024
Figure 6‑9: Lithium Nickel Manganese Cobalt Oxide – Portable PCs Market (Million US$), 2010 – 2017
Figure 6‑10: Lithium Nickel Manganese Cobalt Oxide – Forecast for Portable PCs Market (Million US$), 2018 – 2024
Figure 6‑11: Lithium Nickel Manganese Cobalt Oxide – Other Electronics Market (Million US$), 2010 – 2017
Figure 6‑12: Lithium Nickel Manganese Cobalt Oxide – Forecast for Other Electronics Market (Million US$), 2018 – 2024
Figure 6‑13: Lithium Nickel Manganese Cobalt Oxide – Power Tools, E-bikes Market (Million US$), 2010 – 2017
Figure 6‑14: Lithium Nickel Manganese Cobalt Oxide – Forecast for Power Tools, E-bikes Market (Million US$), 2018 – 2024
Figure 6‑15: Lithium Nickel Manganese Cobalt Oxide – xEV Market (Million US$), 2015 – 2017
Figure 6‑16: Lithium Nickel Manganese Cobalt Oxide – Forecast for xEV Market (Million US$), 2018 – 2024
Figure 6‑17: Lithium Nickel Manganese Cobalt Oxide – Others Market (Million US$), 2015 – 2017
Figure 6‑18: Lithium Nickel Manganese Cobalt Oxide – Forecast for Others Market (Million US$), 2018 – 2024
Figure 6‑19: Lithium Nickel Cobalt Aluminum Oxide – Smart Phones & Tablet Market (Million US$), 2015 - 2017
Figure 6‑20: Lithium Nickel Cobalt Aluminum Oxide – Forecast for Smart Phones & Tablet Market (Million US$), 2018 - 2024
Figure 6‑21: Lithium Nickel Cobalt Aluminum Oxide – Other Electronics Market (Million US$), 2015 – 2017
Figure 6‑22: Lithium Nickel Cobalt Aluminum Oxide – Forecast for Other Electronics Market (Million US$), 2018 – 2024
Figure 6‑23: Lithium Nickel Cobalt Aluminum Oxide – Power Tools, E-bikes Market (Million US$), 2015 – 2017
Figure 6‑24: Lithium Nickel Cobalt Aluminum Oxide – Forecast for Power Tools, E-bikes Market (Million US$), 2018 – 2024
Figure 6‑25: Lithium Nickel Cobalt Aluminum Oxide – xEV Market (Million US$), 2015 – 2017
Figure 6‑26: Lithium Nickel Cobalt Aluminum Oxide – Forecast for xEV Market (Million US$), 2018 – 2024
Figure 6‑27: Lithium Nickel Cobalt Aluminum Oxide – Others Market (Million US$), 2015 – 2017
Figure 6‑28: Lithium Nickel Cobalt Aluminum Oxide – Forecast for Others Market (Million US$), 2018 – 2024
Figure 6‑29: Lithium Manganese Oxide – Power Tools, E-bikes Market (Million US$), 2010 – 2017
Figure 6‑30: Lithium Manganese Oxide – Forecast for Power Tools, E-bikes Market (Million US$), 2018 – 2024
Figure 6‑31: Lithium Manganese Oxide – xEV Market (Million US$), 2015 – 2017
Figure 6‑32: Lithium Manganese Oxide – Forecast for xEV Market (Million US$), 2018 – 2024
Figure 6‑33: Lithium Manganese Oxide – Industrial Market (Million US$), 2010 – 2017
Figure 6‑34: Lithium Manganese Oxide – Forecast for Industrial Market (Million US$), 2018 – 2024
Figure 6‑35: Lithium Manganese Oxide – Others Market (Million US$), 2010 – 2017
Figure 6‑36: Lithium Manganese Oxide – Forecast for Others Market (Million US$), 2018 – 2024
Figure 6‑37: Lithium Iron Phosphate – Power Tools, E-bikes Market (Million US$), 2010 – 2017
Figure 6‑38: Lithium Iron Phosphate – Forecast for Power Tools, E-bikes Market (Million US$), 2018 – 2024
Figure 6‑39: Lithium Iron Phosphate – E-Bus Market (Million US$), 2015 – 2017
Figure 6‑40: Lithium Iron Phosphate – Forecast for E-Bus Market (Million US$), 2018 – 2024
Figure 6‑41: Lithium Iron Phosphate – Industrial Market (Million US$), 2010 – 2017
Figure 6‑42: Lithium Iron Phosphate – Forecast for Industrial Market (Million US$), 2018 – 2024
Figure 6‑43: Lithium Iron Phosphate – Others Market (Million US$), 2010 – 2017
Figure 6‑44: Lithium Iron Phosphate – Forecast for Others Market (Million US$), 2018 – 2024
Figure 6‑45: Global – Natural Graphite Market (Million US$), 2010 – 2017
Figure 6‑46: Global – Forecast for Natural Graphite Market (Million US$), 2018 – 2024
Figure 6‑47: Global – Artificial Graphite Market (Million US$), 2010 – 2017
Figure 6‑48: Global – Artificial Graphite Market (Million US$), 2018 – 2024
Figure 6‑49: Global – Other Anode Material Market (Million US$), 2010 – 2017
Figure 6‑50: Global – Forecast for Other Anode Material Market (Million US$), 2018 – 2024
Figure 6‑51: Lithium Electrolyte – Portable Electronic Market (Million US$), 2010 - 2017
Figure 6‑52: Lithium Electrolyte – Forecast for Portable Electronic Market (Million US$), 2018 - 2024
Figure 6‑53: Lithium Electrolyte – Power Tools Market (Million US$), 2010 - 2017
Figure 6‑54: Lithium Electrolyte – Forecast for Power Tools Market (Million US$), 2018 - 2024
Figure 6‑55: Lithium Electrolyte – E-Bike Market (Million US$), 2010 - 2017
Figure 6‑56: Lithium Electrolyte – Forecast for E-Bike Market (Million US$), 2018 - 2024
Figure 6‑57: Lithium Electrolyte – Automotive & E-Bus Market (Million US$), 2011 – 2017
Figure 6‑58: Lithium Electrolyte – Forecast for Automotive & E-Bus Market (Million US$), 2018 – 2024
Figure 6‑59: Lithium Electrolyte – Industrial Market (Million US$), 2010 – 2017
Figure 6‑60: Lithium Electrolyte – Forecast for Industrial Market (Million US$), 2018 – 2024
Figure 7‑1: Global – Cathode Material Sales for Lithium-ion Battery (Tons), 2010 – 2017
Figure 7‑2: Global – Forecast for Cathode Material Sales for Lithium-ion Battery (Tons), 2018 – 2024
Figure 7‑3: Global – Lithium Cobalt Oxide Sales (Tons), 2010 – 2017
Figure 7‑4: Global – Forecast for Lithium Cobalt Oxide Sales (Tons), 2018 – 2024
Figure 7‑5: Global – Lithium Nickel Manganese Cobalt Oxide Sales (Tons), 2010 – 2017
Figure 7‑6: Global – Forecast for Lithium Nickel Manganese Cobalt Oxide Sales (Tons), 2018 – 2024
Figure 7‑7: Global – Lithium Nickel Cobalt Aluminium Oxide Sales (Tons), 2010 – 2017
Figure 7‑8: Global – Forecast for Lithium Nickel Cobalt Aluminium Oxide Sales (Tons), 2018 – 2024
Figure 7‑9: Global – Lithium Manganese Oxide Sales (Tons), 2010 – 2017
Figure 7‑10: Global – Forecast for Lithium Manganese Oxide Sales (Tons), 2018 – 2024
Figure 7‑11: Global – Lithium Iron Phosphate Sales (Tons), 2010 – 2017
Figure 7‑12: Global – Forecast for Lithium Iron Phosphate Sales (Tons), 2018 – 2024
Figure 7‑13: Global – Anode Materials Sales for Lithium-ion Battery (Tons), 2010 – 2017
Figure 7‑14: Global – Forecast for Anode Materials Sales for Lithium-ion Battery (Tons), 2018 – 2024
Figure 7‑15: Global – Natural Graphite Sales for Lithium-ion Battery (Tons), 2010 – 2017
Figure 7‑16: Global – Forecast for Natural Graphite Sales for Lithium-ion Battery (Tons), 2018 – 2024
Figure 7‑17: Global – Artificial Graphite Sales for Lithium-ion Battery (Tons), 2010 – 2017
Figure 7‑18: Global – Forecast for Artificial Graphite Sales for Lithium-ion Battery (Tons), 2018 – 2024
Figure 7‑19: Global – Other Anode Materials Sales for Lithium-ion Battery (Tons), 2010 – 2017
Figure 7‑20: Global – Forecast for Other Anode Materials Sales for Lithium-ion Battery (Tons), 2018 – 2024
Figure 7‑21: Global – Lithium-ion Battery Sales by Electrolyte (Tons), 2010 – 2017
Figure 7‑22: Global – Forecast for Lithium-ion Battery Sales by Electrolyte (Tons), 2018 – 2024
Figure 8‑1: Global – Lithium-ion Battery Value Chain Analysis
Figure 9‑1: Samsung SDI – Production Volume (Million Cells), 2010 – 2017
Figure 9‑2: Samsung SDI – Forecast for Production Volume (Million Cells), 2018 – 2024
Figure 9‑3: Samsung SDI – Sales (Million US$), 2010 – 2017
Figure 9‑4: Samsung SDI – Forecast for Sales (Million US$), 2010 – 2017
Figure 10‑1: SANYO-Panasonic – Production Volume (Million Cells), 2010 – 2017
Figure 10‑2: SANYO-Panasonic – Forecast for Production Volume (Million Cells), 2018 – 2024
Figure 10‑3: SANYO-Panasonic – Sales (Million US$), 2010 – 2017
Figure 10‑4: SANYO-Panasonic – Forecast for Sales (Million US$), 2018 – 2024
Figure 11‑1: LG Chem – Production Volume (Million Cells), 2010 – 2017
Figure 11‑2: LG Chem – Forecast for Production Volume (Million Cells), 2018 – 2024
Figure 11‑3: LG Chem – Sales (Million US$), 2010 – 2017
Figure 11‑4: LG Chem – Forecast for Sales (Million US$), 2018 – 2024
Figure 12‑1: ATL – Production Volume (Million Cells), 2010 – 2017
Figure 12‑2: ATL – Forecast for Production Volume (Million Cells), 2018 – 2024
Figure 12‑3: ATL – Sales (Million US$), 2010 – 2017
Figure 12‑4: ATL – Forecast for Sales (Million US$), 2018 – 2024
Figure 13‑1: Global - Lithium-ion Battery Price Survey (US$/KWH), 2010 – 2016
List of Table:
Table 2-1: Most commonly used lithium-ion