Renub

    India Payment Market, Volume, Size, Forecast 2023-2028, Industry Trends, Share, Growth, Impact of Inflation, Opportunity Company Analysis

    Excel: 8 Hours
    PDF: 24 Hours
    Apr 2023
    Pages: 175

    India Payment Market Outlook

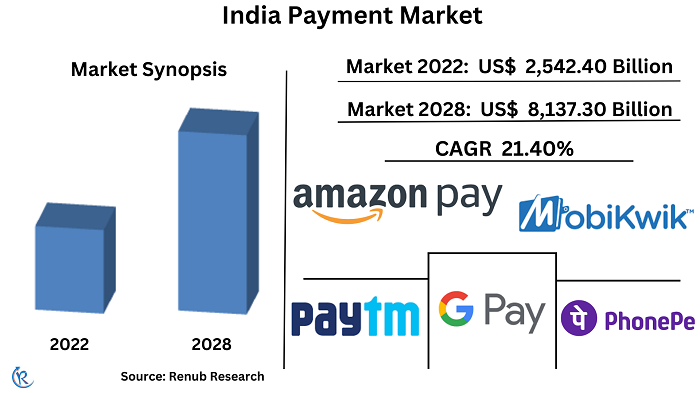
    India Payment Market is estimated to reach US$ 8,137.3 Billion by 2028. India has a massive population of 1.41 billion people, constituting approximately 18% of the global population, making it the largest country in the world. Due to the country's rapid growth, meeting the financial service needs of its citizens requires a sustainable approach, which has come in the form of a digital payment system. Digital payment services have become popular due to their convenience, ease of transactions, and security. As a result, India has one of the world's fastest-growing fintech landscapes, mainly driven by the advancement of digital payments. However, payment players face a significant challenge of thin margins, pushing them to focus on high-margin offerings and prioritize digital payment growth. The India Payments Market is projected to grow with a CAGR of by 21.4% from 2022 to 2028.

    india-payment-market


    India payment market


    PayTm

    In March 2024, Paytm became granted a 3rd-party application issuer license with the aid of The National Payments Corp of India to permit customers to use the Paytm app for payments thru India's popular unified fee interface (UPI).

    In Jan 2024, Paytm's invested Rs 100 crore in GIFT City to set up a development middle for an international payments system.


    Mobikwik

    Zaakpay, the payment gateway arm of MobiKwik, received in-principle authorization from RBI to operate as a charge aggregator in Oct 2023.

    Mobikwik launched 'Pocket UPI' in Feb 2024, allowing customers to make UPI payments without linking their bank account, reducing fraud and bank declaration clutter.


    Phonepe Pvt Ltd

    PhonePe planned to roll out customer lending on its platform by January 2024.

    PhonePe released a new feature in July 2023, allowing customers to pay earnings tax via their app. Self-assessment and boost tax bills made through UPI or credit score card without logging into the income tax portal.

    PhonePe released PhonePe Pulse, India's first interactive website with facts, insights, and developments on virtual payments, in September 2021. The website showcases over 2000+ crore consumer transactions on an interactive map of India, reflecting the country's virtual payment behavior with over 45% marketplace proportion.


    Amazon Pay

    Amazon Pay obtained a price aggregator license from RBI in February 2024, enabling it to provide its customers with on line service provider price offerings.

    In January 2023, Amazon Pay India emphasized bills facilitated through voice commands.


    Google Pay

    In Jan 2024, Google India Digital Services and NPCI International Payments Ltd (NIPL) agreed to make bigger UPI bills past India.

    In May 2023, Google Pay collaborated with the National Payments Corporation of India to integrate RuPay credit cards into the Unified Payments Interface (UPI) platform.


    In 2022, Unified Payment Interface (UPI) Facilitated more than 2K Transactions per second in India

    The National Electronic Toll Collection (NETC) is among the most significant advancements in the digital payments field in recent years. With the government mandating the use of FASTag for all four-wheeled vehicles throughout the country, digital payments in this category will receive an additional boost. QR code-based payments have also experienced a notable surge recently, thanks to promotional activities that have highlighted their ease of use for consumers.

    The FinTech sector has undergone a significant transformation, with over 2,000 companies operating across the country. By utilizing India Stack, these FinTech firms have developed a range of banking and payment solutions. Consumer apps launched by these firms have delivered improved user experiences, particularly in terms of onboarding and usage. India Payment market was US$ 2,542.4 Billion by 2022.

    According to Indian Ministry of Electronics & IT, Digital payment transactions have undergone significant growth, increasing from 2,071 Crore transactionsin FY 2017-18 to 8,840 Crore transactions in FY 2021-22, thanks to the coordinated efforts of the government and all relevant stakeholders. Even in FY 2022-2023, over 9,192 Crore transactions was held till Dec.

    With over a billion mobile devices and low-cost internet accessible to over 600 million users, the so-called JAM trinity (Jan Dhan, Aadhaar, and Mobile) has formed the foundation for the explosive growth of digital payments. The COVID-19 pandemic has played a critical role in driving new developments and technological advancements in the digital payments industry, which has undergone significant transformations due to regulatory support. UPI has been a significant contributor to this growth, with billions of transactions taking place in 2022.


    Indian Government is promoting Digital India through Regulatory Measures

    India is leading the global surge in digital payments and is expected to drive further growth in the industry. The Indian payments landscape has undergone significant changes since the "Demonetization" announcement by the Prime Minister six years ago, making the shift towards a cashless economy essential. This move will result in significant cost savings from currency printing and maintenance. The "Digital India" program, a flagship initiative of the Indian government, aims to transform the country into a digitally empowered society and a knowledge economy. The program's goal is to achieve a "Faceless, Paperless, Cashless" status, and various initiatives such as Digishala, the National Optical Fiber Network (NOFN), the Unified Payment Interface (UPI), and the Bharat Interface for Money (BHIM) app are accelerating the transition to a cashless economy. These efforts have given a significant boost to India's digital transactions sector.

    The Indian government has initiated various programs, such as Digital India, to encourage the use of digital wallets and payments. Additionally, the Union Budget 2022-23 states that the Reserve Bank of India (RBI) will introduce the Central Bank Digital Currency (CBDC) as India's official digital Rupee to promote the nation's digital economy. This step is anticipated to provide further support to the Indian payments industry.


    India UPI Payments are on the cusp of a significant Transformation in the Coming Years

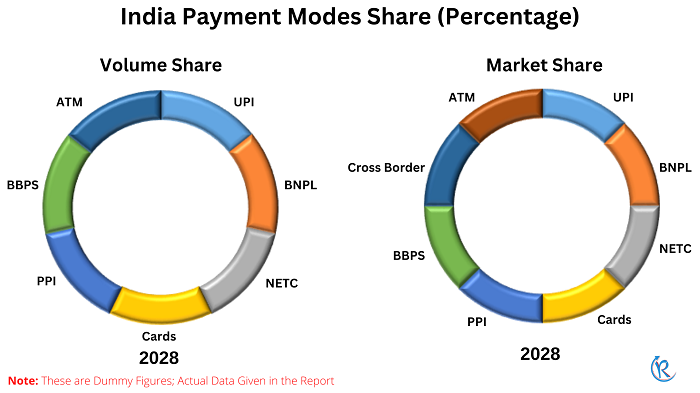
    The Indian payment industry is divided into various categories such as UPI, BNPL, NETC, Cards, PPI, BBPS, Cross Border, and ATM. Cards, which include credit, debit, and prepaid cards, have been a consistent contributor to the growth of digital payments in India, owing to the increasing number of physical acceptance points and the rising adoption of e-commerce. With the entry of new issuers, the growth of card issuance and transaction volumes is expected to further increase.

    The adoption of non-cash payments in India has been accelerated by the UPI system, particularly for person-to-person (P2P) fund transfers and low-value merchant (P2M) payments. In the last three years, UPI has witnessed a 9-fold increase in transaction volume. India's e-commerce market continues to grow at a rapid pace, driven by increasing Smartphone and Internet penetration as well as rising consumer wealth. This growth is particularly strong in tier II and tier III cities, where access to brands may be limited but aspirations are high. Digital payments and Buy Now Pay Later services are also contributing to the growth of e-commerce in India.

    Digital payments have emerged as the preferred mode of payment for e-commerce transactions and are expected to continue to dominate in the coming years. Local digital wallets like Paytm, MobiKwik, and PhonePe are competing with global players such as Google Pay and Amazon Pay for a share of this growing market. For businesses such as Uber and e-commerce giants like Amazon and Flipkart, access to data is crucial to their operations. The convenience offered by digital technology has been a significant driver of the widespread adoption of smartphones. The Fintech industry's influence in the market is growing, with significant long-term potential. Traditional financial institutions are quickly embracing Fintech's disruptive nature and forming partnerships to improve operational efficiency and meet customers' demands for more innovative services.


    Key Players Analysis

    The Indian payments market seems to be moderately consolidated, with a few dominant players currently holding a significant share of the market. These major players are offering well-established digital payment solutions and utilizing strategies like partnerships and acquisitions to increase their customer base in the region. Key companies operating in the payments market in India include PayTm, Mobikwik, PhonepePvt Ltd, Amazon Pay, and Google Pay.


    Renub Research report titled “India Payment Market & Volume by Digital Mode: UPI (Value, Volume, Revenue), NETC, (Value, Volume, Revenue), Bharat Bill Pay System (BBPS) (Value, Volume, Revenue), Existing Business Categories, New Business Categories, Categories Share in Transaction Volume, Channel Wise Split (Transaction Value), Cross-Border Remittances (Inflow, Outflow, Revenue), Credit Cards (Transactions Value, Transaction Volume), Debit Cards (Transaction Value, Volume), Revenue (Credit Card and Debit Card), ATM Transactions (Value, Volume, Revenue), Merchant Acquiring Revenue, VAS Revenue, AePs (Value, Volume, Revenue), Prepaid Payment Instruments (Value, Volume, Revenue)" provides a detailed analysis of India Online Payment Market.

    india-payment-market-share


    Digital Payment Modes - Market, Volume & Revenues breakup from 7 viewpoints

    1.    UPI

    a)    Transaction Value
    b)    Transaction Volume
    c)    Revenue


    2.    NETC

    a)    Transaction Value
    b)    Transaction Volume
    c)    Revenue


    3.    Bharat Bill Pay System (BBPS)

    3.1    Transaction Value
    3.2    Transaction Volume
    3.3    Revenue
    3.4    Existing Business Categories
    3.5    New Business Categories
    3.6    Categories Share in Transaction Volume
    3.7    Channel Wise Split (Transaction Value)


    4.    Cross-Border Remittances

    a)    Inflow
    b)    Outflow
    c)    Revenue


    5.    Cards

    5.1    Credit Card Transactions

    5.1.1    Transaction Value
    5.1.2    Transaction Volume

    5.2    Debit Card Transactions

    5.2.1    Transaction Value
    5.2.2    Transaction Volume

    5.3    Revenue (Credit Card and Debit Card)

    5.4    ATM Transactions

    5.4.1    Transaction Value
    5.4.2    Transaction Volume
    5.4.3    Revenue

    5.5    Merchant Acquiring Revenue
    5.6    VAS Revenue


    6.    AePs

    a)    Transaction Value
    b)    Transaction Volume
    c)    Revenue


    7.    Prepaid Payment Instruments

    a)    Transaction Value
    b)    Transaction Volume
    c)    Revenue


    All companies have been covered from 3 viewpoints

    •    Overviews
    •    Recent developments
    •    Revenues


    Company Insights

    1.    PayTM
    2.    Mobikwik
    3.    Google Pay
    4.    Amazon Pay
    5.    PhonePe

    1.    Introduction

    2.    Research & Methodology

    3.    Executive Summary

    4.    Market Dynamics

    4.1    Growth Drivers
    4.2    Challenges


    5.    PESTLE Analysis

    5.1    Political
    5.2    Economic
    5.3    Social
    5.4    Technological
    5.5    Legal
    5.6    Environmental


    6.    India Payment Market

    6.1    Transaction Value
    6.2    Transaction Volume
    6.3    Revenue


    7.    India Payment Market & Volume Share Analysis

    7.1    Market Share – Payment Modes
    7.2    Volume Share – Payment Modes


    8.    UPI – India Payment Market

    8.1    Transaction Value
    8.2    Transaction Volume
    8.3    Revenue


    9.    BNPL – India Payment Market

    9.1    Transaction Value
    9.2    Transaction Volume
    9.3    Revenue


    10.    NETC – India Payment Market

    10.1    Transaction Value
    10.2    Transaction Volume
    10.3    Revenue


    11.    Cards – India Payment Market

    11.1    Credit Card Transactions

    11.1.1    Transaction Value
    11.1.2    Transaction Volume

    11.2    Debit Card Transactions

    11.2.1    Transaction Value
    11.2.2    Transaction Volume

    11.3    Revenue (Credit Card and Debit Card)
    11.4    Growth in Card Issuance Volume

    11.4.1    Credit Card
    11.4.2    Debit Card


    12.    Prepaid Payment Instruments – India Payment Market

    12.1    Transaction Value
    12.2    Transaction Volume
    12.3    Revenue


    13.    Bharat Bill Pay System (BBPS) – India Payment Market

    13.1    Transaction Value
    13.2    Transaction Volume
    13.3    Revenue


    14.    Cross-Border Remittances – India Payment Market

    14.1    Inflow
    14.2    Outflow


    15.    ATM Transactions – India Payment Market

    15.1    Transaction Value
    15.2    Transaction Volume
    15.3    Revenue
    15.4    Number of ATM


    16.    Merchant Acquiring Revenue

    17.    Company Insights

    17.1    PayTM

    17.1.1    Overviews
    17.1.2    Recent Developments
    17.1.3    Revenues

    17.2    Mobikwik

    17.2.1    Overviews
    17.2.2    Recent Developments
    17.2.3    Revenues

    17.3    Google Pay

    17.3.1    Overviews
    17.3.2    Recent Developments
    17.3.3    Revenues

    17.4    Amazon Pay

    17.4.1    Overviews
    17.4.2    Recent Developments
    17.4.3    Revenues

    17.5    PhonePe

    17.5.1    Overviews
    17.5.2    Recent Developments
    17.5.3    Revenues


    List of Figures:

    Figure-01:    India – Transaction Value Market (Billion US$), 2019 – 2022
    Figure-02:    India – Forecast for Transaction Value Market (Billion US$), 2023 – 2028
    Figure-03:    India – Transaction Volume (Billion), 2019 – 2022
    Figure-04:    India – Forecast for Transaction Volume (Billion), 2023 – 2028
    Figure-05:    India – Revenue Market (Million US$), 2019 – 2022
    Figure-06:    India – Forecast for Revenue Market (Million US$), 2023 – 2028
    Figure-07:    UPI – Transaction Value Market (Billion US$), 2019 – 2022
    Figure-08:    UPI – Forecast for Transaction Value Market (Billion US$), 2023 – 2028
    Figure-09:    UPI – Transaction Volume (Billion), 2019 – 2022
    Figure-10:    UPI – Forecast for Transaction Volume (Billion), 2023 – 2028
    Figure-11:    UPI – Revenue Market (Million US$), 2019 – 2022
    Figure-12:    UPI – Forecast for Revenue Market (Million US$), 2023 – 2028
    Figure-13:    BNPL – Transaction Value Market (Billion US$), 2019 – 2022
    Figure-14:    BNPL – Forecast for Transaction Value Market (Billion US$), 2023 – 2028
    Figure-15:    BNPL – Transaction Volume (Billion), 2019 – 2022
    Figure-16:    BNPL – Forecast for Transaction Volume (Billion), 2023 – 2028
    Figure-17:    BNPL – Revenue Market (Million US$), 2019 – 2022
    Figure-18:    BNPL – Forecast for Revenue Market (Million US$), 2023 – 2028
    Figure-19:    NETC – Transaction Value Market (Billion US$), 2019 – 2022
    Figure-20:    NETC – Forecast for Transaction Value Market (Billion US$), 2023 – 2028
    Figure-21:    NETC – Transaction Volume (Billion), 2019 – 2022
    Figure-22:    NETC – Forecast for Transaction Volume (Billion), 2023 – 2028
    Figure-23:    NETC – Revenue Market (Million US$), 2019 – 2022
    Figure-24:    NETC – Forecast for Revenue Market (Million US$), 2023 – 2028
    Figure-25:    Credit Card – Transaction Value Market (Billion US$), 2019 – 2022
    Figure-26:    Credit Card – Forecast for Transaction Value Market (Billion US$), 2023 – 2028
    Figure-27:    Credit Card – Transaction Volume (Billion), 2019 – 2022
    Figure-28:    Credit Card – Forecast for Transaction Volume (Billion), 2023 – 2028
    Figure-29:    Debit Card – Transaction Value Market (Billion US$), 2019 – 2022
    Figure-30:    Debit Card – Forecast for Transaction Value Market (Billion US$), 2023 – 2028
    Figure-31:    Debit Card – Transaction Volume (Billion), 2019 – 2022
    Figure-32:    Debit Card – Forecast for Transaction Volume (Billion), 2023 – 2028
    Figure-33:    Cards – Revenue (Credit Card and Debit Card) Market (Million US$), 2019 – 2022
    Figure-34:    Cards – Forecast for Revenue (Credit Card and Debit Card) Market (Million US$), 2023 – 2028
    Figure-35:    Credit Card – Growth in Card Issuance Volume Market (Billion), 2019 – 2022
    Figure-36:    Credit Card – Forecast for Growth in Card Issuance Volume Market (Billion), 2023 – 2028
    Figure-37:    Debit Card – Growth in Card Issuance Volume (Billion), 2019 – 2022
    Figure-38:    Debit Card – Forecast for Growth in Card Issuance Volume (Billion), 2023 – 2028
    Figure-45:    Prepaid Payment Instruments – Transaction Value Market (Billion US$), 2019 – 2022
    Figure-46:    Prepaid Payment Instruments – Forecast for Transaction Value Market (Billion US$), 2023 – 2028
    Figure-39:    Prepaid Payment Instruments – Transaction Volume (Billion), 2019 – 2022
    Figure-40:    Prepaid Payment Instruments – Forecast for Transaction Volume (Billion), 2023 – 2028
    Figure-41:    Prepaid Payment Instruments – Revenue Market (Million US$), 2019 – 2022
    Figure-42:    Prepaid Payment Instruments – Forecast for Revenue Market (Million US$), 2023 – 2028
    Figure-43:    Bharat Bill Pay System (BBPS) – Transaction Value Market (Billion US$), 2019 – 2022
    Figure-44:    Bharat Bill Pay System (BBPS) – Forecast for Transaction Value Market (Billion US$), 2023 – 2028
    Figure-47:    Bharat Bill Pay System (BBPS) – Transaction Volume (Billion), 2019 – 2022
    Figure-48:    Bharat Bill Pay System (BBPS) – Forecast for Transaction Volume (Billion), 2023 – 2028
    Figure-49:    Bharat Bill Pay System (BBPS) – Revenue Market (Million US$), 2019 – 2022
    Figure-50:    Bharat Bill Pay System (BBPS) – Forecast for Revenue Market (Million US$), 2023 – 2028
    Figure-51:    Cross-Border Remittances – Inflow Market (Billion US$), 2019 – 2022
    Figure-52:    Cross-Border Remittances – Forecast for Inflow Market (Billion US$), 2023 – 2028
    Figure-53:    Cross-Border Remittances – Outflow Market (Billion US$), 2019 – 2022
    Figure-54:    Cross-Border Remittances – Forecast for Outflow Market (Billion US$), 2023 – 2028
    Figure-55:    ATM – Transaction Value Market (Billion US$), 2019 – 2022
    Figure-56:    ATM – Forecast for Transaction Value Market (Billion US$), 2023 – 2028
    Figure-57:    ATM – Transaction Volume (Billion), 2019 – 2022
    Figure-58:    ATM – Forecast for Transaction Volume (Billion), 2023 – 2028
    Figure-59:    ATM – Revenue Market (Million US$), 2019 – 2022
    Figure-60:    ATM – Forecast for Revenue Market (Million US$), 2023 – 2028
    Figure-61:    ATM – Number of ATM Market (Lakh), 2019 – 2022
    Figure-62:    ATM – Forecast for Number of ATM Market (Lakh), 2023 – 2028
    Figure-63:    Merchant Acquiring Revenue – Market (Million US$), 2019 – 2022
    Figure-64:    Merchant Acquiring Revenue – Forecast for Market (Million US$), 2023 – 2028
    Figure-65:    PayTM – Global Revenue (Million US$), 2019 – 2022
    Figure-66:    PayTM – Forecast for Global Revenue (Million US$), 2023 – 2028
    Figure-67:    Mobikwik – Global Revenue (Million US$), 2019 – 2022
    Figure-68:    Mobikwik – Forecast for Global Revenue (Million US$), 2023 – 2028
    Figure-69:    Google Pay – Global Revenue (Million US$), 2019 – 2022
    Figure-70:    Google Pay – Forecast for Global Revenue (Million US$), 2023 – 2028
    Figure-71:    Amazon Pay – Global Revenue (Million US$), 2019 – 2022
    Figure-72:    Amazon Pay – Forecast for Global Revenue (Million US$), 2023 – 2028
    Figure-73:    PhonePe – Global Revenue (Million US$), 2019 – 2022
    Figure-74:    PhonePe – Forecast for Global Revenue (Million US$), 2023 – 2028


    List of Tables:

    Table-01:    India – Payment Market Share by Payment Modes (Percent), 2019 – 2022
    Table-02:    India – Forecast for Payment Market Share by Payment Modes (Percent), 2023 – 2028
    Table-03:    India – Payment Volume Share by Payment Modes (Percent), 2019 – 2022
    Table-04:    India – Forecast for Payment Volume Share by Payment Modes (Percent), 2023 – 2028

    • Description
      Price
    • Chapter 1 & 4     Pages : 4
      $200
    • Chapter 5     Pages : 6
      $200
    • Chapter 6     Pages : 6
      $300
    • Chapter 8     Pages : 6
      $300
    • Chapter 9     Pages : 6
      $300
    • Chapter 10     Pages : 6
      $300
    • Chapter 11.1     Pages : 4
      $300
    • Chapter 11.2     Pages : 4
      $300
    • Chapter 11.3     Pages : 2
      $200
    • Chapter 11.4     Pages : 4
      $300
    • Chapter 12     Pages : 6
      $300
    • Chapter 13     Pages : 6
      $300
    • Chapter 14     Pages : 4
      $300
    • Chapter 15     Pages : 8
      $400
    • Chapter 16     Pages : 2
      $200
    • Chapter 17.1     Pages : 5
      $150
    • Chapter 17.2     Pages : 5
      $150
    • Chapter 17.3     Pages : 5
      $150
    • Chapter 17.4     Pages : 5
      $150
    • Chapter 17.5     Pages : 5
      $150

    Related Reports