Global Crab Market Size, Forecast 2025-2033
Buy NowGlobal Crab Market Size and Forecast 2025-2033
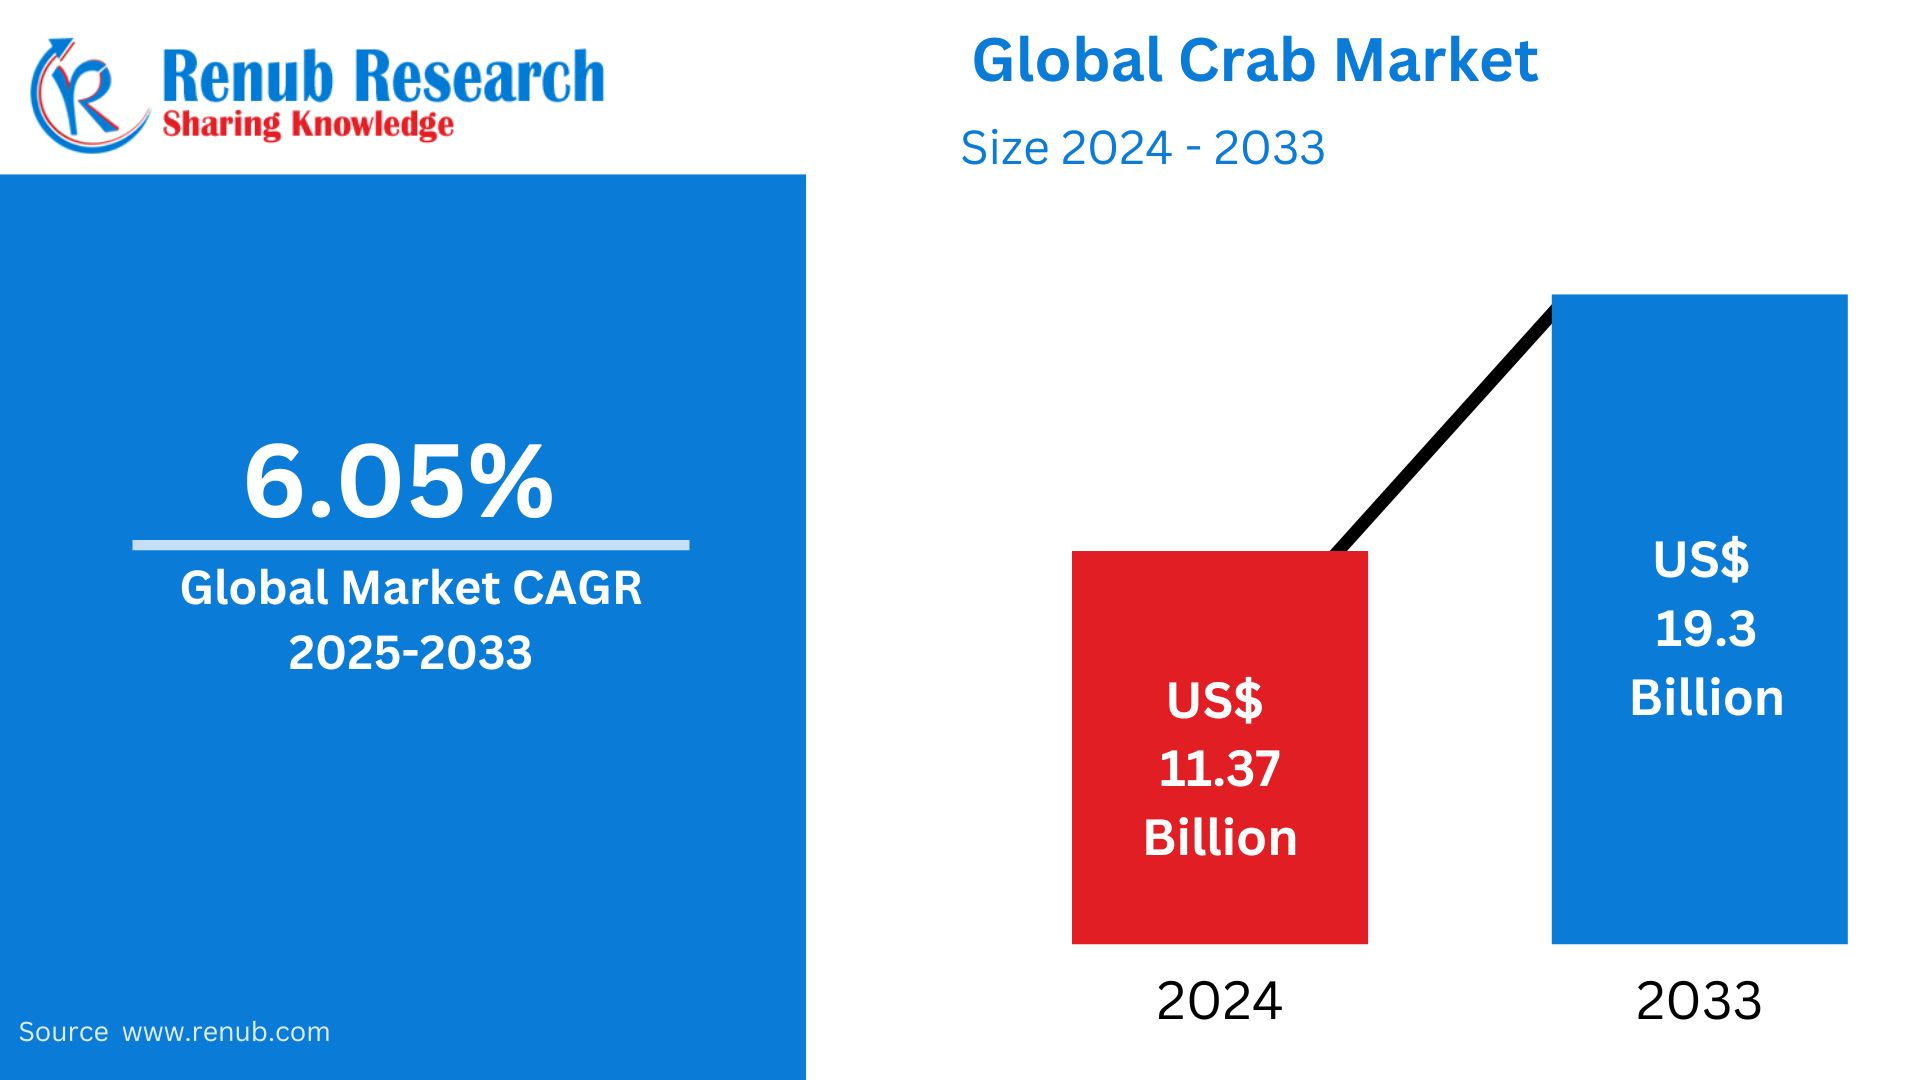
The Global Crab Market was worth USD 11.37 billion in 2024 and is estimated to reach USD 19.3 billion by 2033, growing at a CAGR of 6.05% during the period from 2025 to 2033. Growing seafood demand, rising premium seafood product demand, and spreading aquaculture operations fuel market growth. In addition, the development of supply chain logistics and increasing awareness of the health impacts of crab consumption fuel the industry's growth.
The report Global Crab Market & Forecast covers by Type (Blue Crab, Chinese Mitten, Gazami Crab, Other Crab Types), Form (Frozen, Canned, Other Forms), Country and Company Analysis 2025-2033.
Global Crab Market Outlooks
Crab is a common crustacean with tender and palatable meat. Living in oceans, freshwater ecosystems, and seashores, crabs are an excellent source of protein, omega-3 fatty acids, and minerals such as zinc and selenium. Crabs are utilized in most global cuisines, with dishes ranging from crab cakes, soups, curries, and sushi.
Crab is especially favored in countries such as North America, Europe, and Asia, where it is consumed in both street food and fine dining. The United States, China, and Japan are among the biggest consumers of crab, with growing demand in seafood markets globally. Crab popularity is also fueled by its health benefits, such as enhanced heart health, brain function, and immune system. Furthermore, the growth of sustainable aquaculture and enhanced cold-chain logistics have increased global crab supply. Consequently, crab is a steady favourite in seafood consumption, both for traditional and contemporary food tastes.
Growth Drivers of the Global Crab Market
Increasing Seafood Demand among Consumers
Increased demand by consumers for seafood, fueled by rising knowledge about its health aspects, is a strong driver of the global crab market. Crabs contain high levels of protein, omega-3 fatty acids, and essential nutrients that make them health-conscious consumers' favorite. Apart from this, the growth of seafood restaurants as well as increase in disposable income has also given a further lift to the consumption of crabs globally, more so in major countries such as the United States, China, and Japan. World fish production is projected to increase at 1.2% annually, a decrease from the 2.0% rate of growth during the last decade. Production will reach 203 million metric tons by 2031, an increase of 14% over the 2019-2021 average. Aquaculture is expected to overtake capture fisheries, producing 108 million metric tons, an increase of 12 million metric tons.
Scaling up Sustainable Aquaculture Practices
Sustainable aquaculture is stepping up to meet the growing demand for crabs. Crab farming methods that provide consistent supplies with reduced environmental impact are being invested in by governments and private bodies. Technology advances such as controlled breeding and disease management have improved the efficiency of production. This has led to consistent pricing and better availability of crabs in world markets. July 2024, The United Nations has supported new U.S. National Oceanic and Atmospheric Administration (NOAA) Guidelines for Sustainable Aquaculture, designed to set worldwide best practices. NOAA was instrumental in creating these guidelines, balancing the needs of North American aquaculture with worldwide viewpoints.
International Trade and Logistics Growth
Enhanced global trade arrangements and technologies in cold-chain logistics have also made it possible to transport crabs across countries. Several nations that export seafood, including Indonesia, Vietnam, and the United States, have experienced a rising demand for exports from overseas markets. Frozen and processed crab product availability has further enhanced the supply chain in the global market, making crabs easily accessible for consumption across the globe. For example, the Comprehensive and Progressive Agreement for Trans-Pacific Partnership (CPTPP) has removed tariffs on crab meat among member nations like Canada, Australia, and Japan. Consequently, consumers in these nations can benefit from cheaper crab meat from member nations.
Challenges in the Global Crab Market
Overfishing and Decreasing Wild Crab Populations
Overfishing has resulted in the reduction of wild crab stocks, disrupting supply chains and prices. Numerous species of crabs are threatened by overfishing, and governments have had to introduce more stringent fishing regulations and quotas. It remains difficult for the seafood sector to balance sustainability with increasing global demand.
Fluctuating Prices and Trade Barriers
The market for crabs is extremely prone to price fluctuations based on seasonal availability, climate change, and geopolitical trade restrictions. Tariffs, import-export controls, and supply chain disruptions can affect the availability and price of crabs in major consumer markets. Furthermore, heightened competition among seafood suppliers places additional pressures on prices.
Global Blue Crab Market
Blue crabs are one of the most desired crab species in the world for their tender and sweet flesh. They mostly occur in the Atlantic Ocean and Gulf of Mexico. The United States and Indonesia are among the main producers of blue crab fresh and processed products distributed to world markets. Demand for blue crabs is robust, particularly in upscale seafood restaurants and retail markets.
Global Gazami Crab Market
Gazami crabs, which are also known as Japanese swimming crabs, are commonly consumed in the Middle East and Asia. They are prized for their hard texture and high meat content. The demand for Gazami crabs has increased exponentially because they are available in fresh and frozen modes. China, South Korea, and Vietnam control the export market of Gazami crabs.
Global Frozen Crab Market
Frozen crabs have become popular because they last longer and are easier to transport. They are extensively traded worldwide, making high-quality seafood accessible to consumers in inland areas. The market for frozen crabs has experienced huge growth, especially in Europe and North America, where there is growing demand for pre-packaged seafood products.
Global Canned Crab Market
Canned crab goods appeal to shoppers who are on the lookout for convenient, ready-to-eat seafood products. This market is growing as the demand for meal convenience increases. Canned crab is used regularly in salads, soups, and pasta products, making canned crab a universal staple in every home and restaurant across the globe. The demand is strongest in North America and Europe, as processed seafood remains extremely popular here.
United States Crab Market
The United States is a significant consumer and producer of crab, blue crabs from the Chesapeake Bay and Dungeness crabs from the Pacific Northwest. The demand for fresh, frozen, and canned crab is high due to the high seafood culture and rising health-conscious eating practices. September 2024, The Seafood Company has been able to tap a share of the U.S. market by bringing its unique whole panko soft shell crab product.
Germany Crab Market
Germany has seen a significant rise in demand for seafood, specifically crab, driven by an increased consumer preference towards high-protein and low-fat diets. The trend has driven a steep rise in the importation of frozen and canned crab, with retailers reacting by diversifying and broadening their seafood offerings to suit changing consumer tastes. Consumers are also looking for these healthy alternatives more and more, leading stores to feature an increasingly diverse range of tempting crab offerings that emphasize both quality and quantity.
China Crab Market
One of the highest consumers of crab is China, especially hairy crabs, which are considered a delicacy. China also sends large volumes of crab products abroad to other markets worldwide. The growing number of middle-class consumers and improving disposable income levels have further added to the consumption of high-value seafood, such as imported crab. In December 2023, Alibaba's new retail convenience store, Hema, brought out a fresh line of pre-cooked ready-to-eat king crab during the lead-up to China's Lunar New Year holiday, when large family get-togethers are well known to dominate. The product range includes garlic king crab legs, Hong Kong-style king crab pieces, and black truffle cheese king crab legs at prices between $26.45 and $37.84.
Brazil Crab Market
Brazil's crab market is on the rise, driven by high domestic demand and rising seafood exports. Brazil's coastal areas have rich crab supplies, with local consumers opting for traditional crab foods. An upsurge of seafood restaurants and health consciousness has supported market development. Japan opened its market to Brazilian live ornamental crabs for export. The Japanese authorities have exempted the need for an International Zoosanitary Certificate for these shipments. Dec 2024, Brazil has sanctioned the shipment of live ornamental crabs to Japan without requiring an International Zoosanitary Certificate. Japan is a major trading partner, the fourth-largest market for Brazilian agricultural exports, with $4.1 billion in exports in 2023. Agricultural sales to Japan between January and October 2024 amounted to $2.84 billion.
South Africa Crab Market
South Africa boasts a booming seafood industry, with crab consumption increasingly on the rise. The presence of both wild and farmed crabs has opened up the market. Growing disposable incomes and tourism have also been instrumental in fueling demand for crabs in South Africa. South Africa's future population of 65,956 thousand by the year 2030 will require 424,627 tonnes of fish and seafood, up from the current demand of 381,831 tonnes by 42,796 tonnes. In order to achieve this demand, aquaculture production must expand by 18% per annum between 2020 and 2030 compared to the current growth rate of 6.4%.
Saudi Arabia Crab Market
Saudi Arabia's seafood sector has been expanding with growing imports of crab products due to rising consumer demand. Largely owing to the country's limited local crab production, the nation must import from Southeast Asia and elsewhere. There has been increasing demand for high-quality seafood, particularly in upscale restaurants and hotels. In November 2023, The National Aquaculture Group (NAQUA) established a strategic alliance with the Saudi Agricultural and Livestock Investment Company (SALIC), acquiring a 42.4% stake in NAQUA. The industry has enhanced cold chain facilities and processing plants, with investments in cutting-edge fish processing technologies. The government has also set up regional fishing education centers and intends to train 3,000 Saudis in aquaculture and fisheries.
Global Crab Market Segments
Type
- Blue Crab
- Chinese Mitten
- Gazami Crab
- Other Crab Types
Form
- Frozen
- Canned
- Other Forms
Regional Analysis:
North America
- United States
- Canada
Europe
- France
- Germany
- Italy
- Spain
- United Kingdom
- Netherlands
Asia Pacific
- China
- Japan
- India
- Australia
- South Korea
- Malaysia
- Indonesia
- Israel
Latin America
- Brazil
- Mexico
- Argentina
- Colombia
Middle East & Africa
- South Africa
- Saudi Arabia
- UAE
Rest of World
Companies have been covered from 5 viewpoints
- Key Person
- Company overview
- Sales Analysis
- Product Portfolio
- Recent Development & Strategies
Company Analysis
- Bumble Bee Foods LLC
- Supreme Crab & Seafood Inc.
- Maine Lobster Now
- Millennium Ocean Star Corporation
- Phil-Union Frozen Foods Inc.
- JM Clayton Seafood Company
- RGE Agridev Corporation
- Siam Canadian Group Limited
- Handy Seafood
Report Details:
| Report Features | Details |
| Base Year |
2024 |
| Historical Period |
2021 - 2024 |
| Forecast Period |
2025 - 2033 |
| Market |
US$ Billion |
| Segment Covered |
Type, Form and Countries |
| Countries Covered |
|
| Companies Covered |
|
| Customization Scope |
20% Free Customization |
| Post-Sale Analyst Support |
1 Year (52 Weeks) |
| Delivery Format |
PDF and Excel through Email (We can also provide the editable version of the report in PPT/Word format on request) |
✅ Market Overview & Growth
What is the current size and projected growth of the global crab market from 2025 to 2033?
What are the main factors driving the growth of the crab market globally?
How is sustainable aquaculture contributing to crab supply growth?
✅ Market Segmentation
What are the major types of crabs dominating the market (Blue Crab, Gazami Crab, etc.)?
How does consumer demand vary across different crab forms – frozen, canned, and others?
✅ Regional Insights
Which countries are leading in crab production, consumption, and exports?
How are emerging markets like Brazil, Saudi Arabia, and South Africa contributing to the global crab market?
✅ Trade & Logistics
What impact have trade agreements and cold-chain logistics had on global crab distribution?
✅ Challenges & Barriers
What are the major challenges such as overfishing, price fluctuations, and trade restrictions affecting the crab market?
✅ Competitive Landscape
Who are the key players in the global crab market, and what are their recent developments and strategies?
Customization Services available
- Analysis of Market Size and Its Segments
- More Company Profiles (Upto 10 without any additional cost):
- Additional Countries (Other than mentioned Countries):
- Region/Country Specific Reports:
- Market Entry Strategy:
- Region-Specific Market Dynamics:
- Regional Market Share Analysis:
- Trade Analysis:
- Production Insights:
- Others Customized Requests:
For more information contact our analysts.
Need More Assistance?
- Talk to our analysts to get more precious information on the current market trends.
- Include more countries and segments and customize the report based on the final requirement.
- Get a competitive advantage in your industry by knowing the report findings and making a positive impact on your revenues and operations.
- Our analysts are always ready to provide more help and pertinent information if you need any additional assistance.