Chicken Market Size, Forecast 2025-2033
Buy NowGlobal Chicken Market Trends & Summary
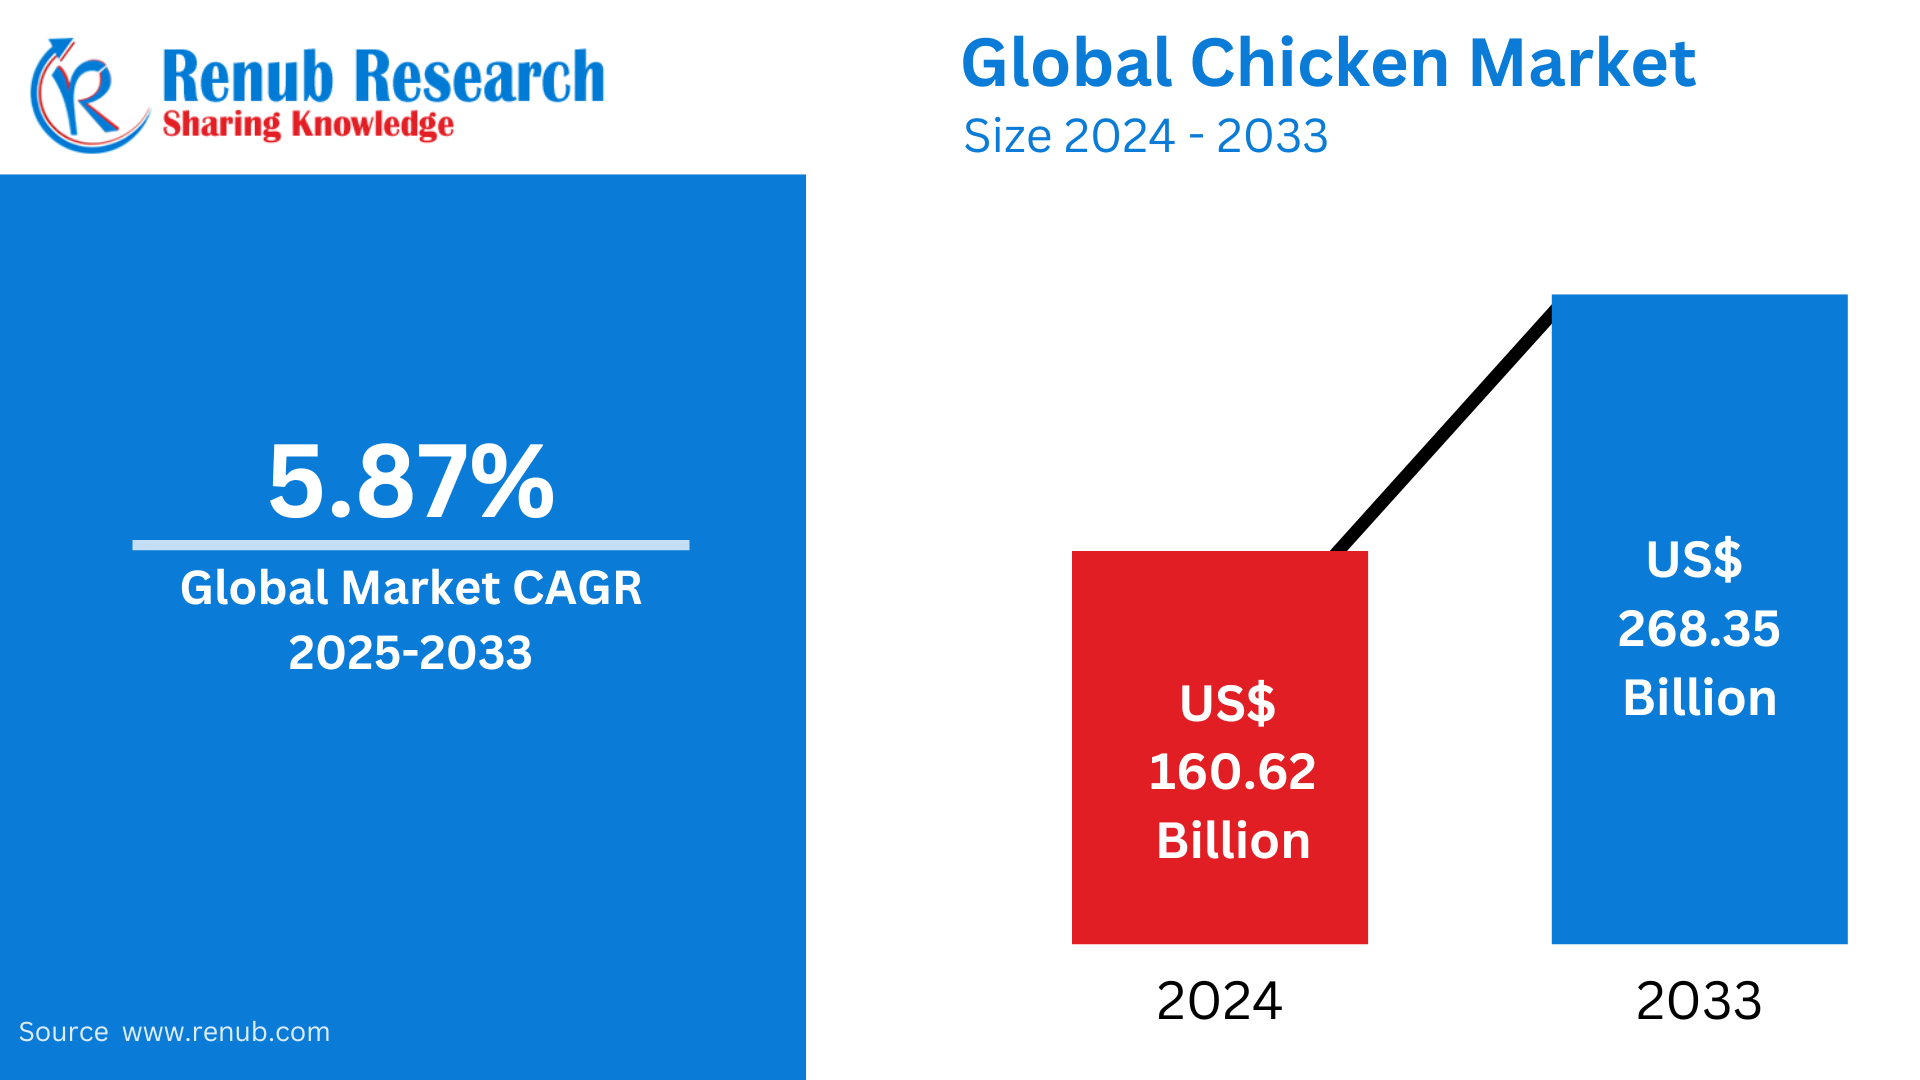
Chicken/Poultry Meat market is expected to reach US$ 268.35 billion by 2033 from US$ 160.62 billion in 2024, with a CAGR of 5.87% from 2025 to 2033. Urbanization, increased disposable incomes, the convenience of poultry-based products, technological developments in poultry farming, the growth of the foodservice industry, and consumer awareness of the nutritional advantages and versatility of chicken over red meat are the main drivers of the chicken/poultry meat industry.
Chicken/Poultry Meat Market Global Report by Production (United States, Brazil, China, European Union, Mexico, Thailand, United Kingdom, Japan, South Africa, Philippines, Canada, South Korea, Saudi Arabia, Iraq, Angola, Cuba, and Others), Consumption Market & Volume (United States, China, Brazil, European Union, Mexico, Japan, United Kingdom, Thailand, Philippines, South Africa, Saudi Arabia, Canada, South Korea, Iraq, Cuba, Angola, and Others), Import, Export and Company Analysis 2025-2033
Chicken/Poultry Meat Industry Overview
Due to rising consumer demand for reasonably priced, high-protein foods, the chicken and poultry meat industries are among the biggest and fastest-growing segments of the global food industry. Because of its adaptability in different cuisines and lower fat content, poultry meat—especially chicken—is seen as a healthier substitute for red meat. Chicken is becoming a more popular primary source of animal protein as the world's population, urbanization, and disposable incomes rise. Additionally, the demand for processed chicken items like nuggets, sausages, and deli meats is being driven by the growing popularity of fast food, ready-to-eat meals, and convenience foods. The increased consumption of poultry is also supported by greater awareness of its health benefits, which include lower cholesterol and fewer calories.
Technological developments in chicken farming have also benefited the sector by increasing productivity, cost-effectiveness, and efficiency. Higher meat yields, improved disease management, and sustainable production techniques are the results of advancements in breeding, feeding, and farming techniques. Strong distribution networks and the growth of the foodservice industry, which is mostly dependent on poultry goods for restaurants, fast-food chains, and food shops, underpin the global market for chicken meat. The sector does, however, confront difficulties like shifting feed prices, worries about animal welfare, and growing competition from plant-based protein sources. Notwithstanding these obstacles, it is anticipated that the poultry meat market will continue to expand due to consumer demand for reasonably priced, wholesome food options.
The landscape of the poultry industry is changing in different regions as a result of government assistance and investment efforts. Ghana's 2023 pledge to invest USD 541 million in its poultry sector, which aims to increase domestic production capacity and lessen reliance on imports, is a noteworthy example. Similar programs are being repeated in other markets, where governments are putting supportive laws into place and funding the construction of infrastructure to boost regional production capacities and guarantee food security. Modernizing production facilities, enhancing biosecurity protocols, and creating more effective distribution networks are the main goals of these expenditures.
Recent Trends in Global Chicken Meat Market
The United Nations estimates that this year (2024) there are 8.2 billion human beings on Earth, and 9.7 billion is projected for 2050. A high of 10.3 billion people is projected for the mid-2080s. In the hundred years or so since the modern chicken era began, chicken has supplanted beef and pork as the world's favorite meat. According to a recent report by OECD and FAO, the number of chickens raised and slaughtered annually, which is now at 74 billion, is expected to increase to 85 billion by 2032, that is a 15 percent increase. This development will have a dramatic effect on climate change, animal protection, and economic growth.
Based on the data forecasts released by the Organization for Economic Co-operation and Development (OECD) and Food and Agriculture Organization (FAO), world poultry meat production in 2023 is projected to exceed 139 million metric tons (mt), up by nearly 3% from 2022. Production of poultry meat continues to keep pace with production of other types of meat, such as pig, beef, and sheep.
Total disposable income across Asia-Pacific will more than double in real terms between 2021–2040, faster than in any other region, but remain one of the lowest in the world, as per Euromonitor's Income and Expenditure in Asia Pacific report. Asia consumers will drive half of the world's consumption growth over the next decade. According to the IMF, the Asia-Pacific region would remain a key driver of world growth in 2023. At 3.9 percent in 2022 and 4.6 percent in 2023, the region is expected to grow.
In July 2023 - The US Department of Agriculture approved the sale of "cultivated" or lab-grown meat to US consumers, creating what food producers term a new avenue for the purchase and delivery of food. Approval was issued to two companies, Upside Foods and GOOD Meat, to begin manufacturing and selling their "cultivated chicken" products, which consist of animal cells that are cultured in a lab instead of essentially slaughtering animals to harvest meat.
In 2023, Japanese consumers spent ¥72,800 on average on meat, with forecasts showing a consistent annual growth of about 0.7% from 2024 to 2028. The growth in meat consumption is directly related to the economic performance and growth of the country. The International Monetary Fund (IMF) is optimistic about consumption levels, attributing future growth to substantial pay increases from the spring wage bargains of the year, which are likely to increase household incomes and, in turn, meat consumption. Urbanization also drives demand for varied and convenient meat products.
Growth Drivers for the Chicken/Poultry Meat Market
Rising Global Population
The demand for foods high in protein is directly impacted by the world's population growth. The demand for reasonably priced, easily available, and effective protein sources increases as the population grows. Compared to other animal foods like beef or pork, chicken is more affordable and easier to produce, making it a popular choice among consumers. It offers a higher-quality, more affordable supply of protein, which is vital for human health. Furthermore, poultry farming uses fewer resources, which makes it a desirable choice for feeding big crowds, particularly in poor nations. As production techniques change to satisfy the demands of a growing world population, the growing demand for poultry products fuels the industry's continuing expansion.
Health-Conscious Consumers
Because of its leaner profile and reduced fat content, health-conscious consumers are increasingly selecting chicken over red meat. Many people are looking for better substitutes for traditional red meats like beef and hog as they become more conscious of the health hazards linked to high-fat diets. Chicken is seen to be a healthy choice for heart health and weight control because of its high protein content and low-calorie count. Chicken is also adaptable and can be cooked in a number of ways, which appeals to people who value flavor and health. The market for chicken and poultry meat is expanding due in large part to customer preferences shifting toward lighter, healthier meat options, especially among younger, health-conscious consumers.
Urbanization and Rising Disposable Incomes
Consumer expenditure on poultry products, especially processed and convenience foods, has surged as urbanization picks up speed and disposable incomes rise. A wide range of food items, like chicken, which is simple to prepare, keep, and eat, are more readily available in urban locations. Due to the need for convenience in their hectic lifestyles, customers with greater earnings are more inclined to buy pre-packaged, processed chicken goods such frozen meals, nuggets, and deli items. Furthermore, fast food and quick-service restaurants, which frequently provide chicken-based dishes, are more popular among city people. As more people choose chicken as a convenient, reasonably priced, and adaptable source of protein, these factors are working together to propel the poultry meat industry's expansion.
Challenges in the Chicken/Poultry Meat Market
Fluctuating Feed Costs
About 60–70% of production expenditures in chicken farming are related to feed, making it one of the biggest expenses. The overall cost of producing chicken can be greatly impacted by changes in the price of feed materials, especially grains like corn and soybeans. Weather events (such as droughts or floods), supply chain interruptions, or international trade concerns like tariffs and export limits are frequently the causes of these price fluctuations. Poultry producers are compelled to modify their pricing methods in response to rising feed prices, which may have an impact on their profitability and raise consumer prices. It is difficult for producers to maintain stable pricing and output levels due to the uncertainty caused by feed cost fluctuation, particularly in areas with intense competition.
Rising Disease Outbreaks
Disease outbreaks like Newcastle disease and avian influenza, sometimes known as bird flu, can have disastrous impacts on poultry production, making the industry extremely vulnerable. Poultry populations are susceptible to these illnesses' rapid spread, which frequently results in extensive culling to stop more contamination. In addition to upsetting supply chains, these outbreaks undermine customer trust, which lowers demand and causes market volatility. Beyond the immediate effects on chicken farmers, the financial losses also include heightened biosecurity protocols, export prohibitions, and regulatory scrutiny. Additionally, because shortages brought on by a decrease in the supply of chicken usually result in price rises that impact both farmers and consumers, disease outbreaks may have long-term effects on market prices.
United States Chicken/Poultry Meat Market
The strong demand from consumers for reasonably priced, high-protein meat has made the US market for chicken and poultry meat one of the biggest in the world. Because of its lower fat level, chicken is regarded as a healthier option to red meat, which helps explain why it is so popular with people who are health-conscious. The expansion of ready-to-eat meals, convenience foods, and fast-food franchises is driving the industry even more. In chicken farming, technological developments including better breeding practices and effective production systems have raised output and reduced expenses. The market has also grown as a result of the increased demand for processed chicken items including tenders, nuggets, and deli meats. However, issues like disease outbreaks, shifting feed prices, and worries about animal welfare continue to be major obstacles for the sector.
United Kingdom Chicken/Poultry Meat Market
The market for chicken and poultry meat in the UK has grown steadily due to rising consumer demand for reasonably priced, wholesome, and adaptable protein sources. Because chicken has leaner meat than red meat, it is preferred by UK customers who are becoming more health conscious. The growing demand for convenience foods, such as ready-to-eat and fast-food items, is driving the industry even more. Consumer behavior is also influenced by the growing desire for ethically and sustainably sourced poultry, with many choosing free-range or organic chicken options. The increasing demand is met in part by technological developments in chicken farming, such as increased production efficiency and better disease management. The market is confronted with obstacles, nonetheless, such as escalating feed prices, shifting supply chains, and demands on animal welfare regulations.
Japan Chicken/Poultry Meat Market
Japan's market for chicken and poultry meat is growing as a result of the nation's rising need for reasonably priced, high-protein foods. Because of its many uses and health advantages—including having less fat than other meats—poultry, especially chicken, is a common meat choice in Japanese cooking. The market is further bolstered by the increasing demand for convenience foods, karaage (Japanese fried chicken), and processed poultry items like nuggets. Chicken consumption is further increased by the growing appetite for fast food and ready-to-eat meals brought on by urbanization. Furthermore, the emphasis on food safety and sustainability has raised demand for premium, locally sourced poultry. However, obstacles including growing feed prices, problems with the supply chain, and the effects of disease outbreaks could affect the stability of the market.
Saudi Arabia Chicken/Poultry Meat Market
The market for chicken and poultry meat in Saudi Arabia is expanding rapidly due to rising consumer demand for reasonably priced, high-protein foods. A mainstay of Saudi meals, poultry is prized for its adaptability, nutritional content, and compatibility for a wide range of traditional recipes. Increased consumption of chicken products is a result of urbanization, population growth, and rising disposable incomes. Additionally, processed poultry products like frozen chicken, nuggets, and sandwiches are becoming more and more popular due to their ease. Another factor affecting the Saudi market is the growing demand for halal-certified goods, which are in line with religious and cultural customs. Notwithstanding the expansion, issues including feed price swings, dependency on imports, and the requirement for more sustainable poultry farming methods raise questions about the stability of the market in the long run.
India Chicken Meat Market
India's chicken meat market is growing at a fast pace due to increasing demand from consumers for cheap protein products. As more people move into urban areas and dietary habits are changing, consumption of chicken meat is expected to grow immensely over the next few years. Growth is facilitated by improvements in poultry rearing practices and supply chains, which help to provide fresher chicken to consumers. In addition, the emergence of fast-food chains and quick-service restaurants has further increased the popularity of chicken. In spite of issues like feed prices and disease control, the market is ready for strong growth, helping India's economic growth and food security. The egg production of India has reached 122,049 million as of 2020-21, greatly improving the poultry sector. During 2021-2022, 3.06 billion chickens were slaughtered to yield meat that supplied 51.44% of total meat produced, highest from all the sources. It portrays growing customer inclination towards the chicken because of it being easily affordable and the resultant health aspects. Moreover, statistics from the Ministry of Statistics reveal that during FY 2023, urban household grocery spending registered a 10.5% investment in processed food, with high spending on protein foods such as eggs, fish, and meat at 3.5%. This is an indication of increasing demand for poultry products, which is in line with a trend towards healthier diets among the urban population.
Key Development in Chicken Meat Market
In February 2023 - Stampede Meat, Inc. and DL Lee & Sons, Inc. announced a new deal. Stampede will be able to expand the southeast part of its production base due to this deal.
In August 2023 - Paul, Weiss is advising Beijing-based DCP Capital in a consulting role to implement the capital equity firm's acquisition of Cargill's Chinese poultry business.
In November 2023 - Tyson Foods announced it would add on to its facility in the Netherlands and build additional production plants in China and Thailand. The recent additions bring capacity to produce roughly 100,000 tonnes of fully cooked poultry. Over 700,000 jobs are projected to be established by the new factories in China and Thailand, respectively, with over 150 jobs added by the European growth.
In March 2023 - With a view to deepening their B2B marketplace partnership, Kraft Heinz Company and BEES have strengthened their partnership. The firm seeks to create one million more points of sale in Latin America and specifically enhance its presence in Mexico, Colombia, and Peru.
Report Details:
| Report Features | Details |
| Base Year |
2024 |
| Historical Period |
2020 - 2024 |
| Forecast Period |
2025 - 2033 |
| Market |
US$ Billion |
| Segment Covered |
Volume Share Analysis, Consuming Countries, Producing Countries, Importing Countries and Exporting Countries |
| Countries Covered |
|
| Companies Covered |
|
| Customization Scope |
20% Free Customization |
| Post-Sale Analyst Support |
1 Year (52 Weeks) |
| Delivery Format |
PDF and Excel through Email (We can also provide the editable version of the report in PPT/Word format on request) |
Key Questions Answered in This Report:
-
What is the projected market size of the global chicken/poultry meat industry in 2033?
-
What is the compound annual growth rate (CAGR) of the chicken/poultry meat market from 2025 to 2033?
-
What are the primary factors driving the growth of the chicken/poultry meat industry?
-
How does urbanization contribute to the expansion of the poultry meat market?
-
What are the main challenges faced by the chicken/poultry meat industry?
-
Which countries are leading in the production of chicken/poultry meat?
-
What role do technological advancements play in the poultry farming industry?
-
How has consumer behavior shifted regarding poultry meat, especially among health-conscious individuals?
-
What is the significance of government support and investment in the poultry sector, as seen in Ghana's 2023 pledge?
-
How are disease outbreaks, like avian influenza, affecting the stability of the chicken/poultry meat market?
Customization Services available
- Analysis of Market Size and Its Segments
- More Company Profiles (Upto 10 without any additional cost):
- Additional Countries (Other than mentioned Countries):
- Region/Country Specific Reports:
- Market Entry Strategy:
- Region-Specific Market Dynamics:
- Regional Market Share Analysis:
- Trade Analysis:
- Production Insights:
- Others Customized Requests:
For more information contact our analysts.
Need More Assistance?
- Talk to our analysts to get more precious information on the current market trends.
- Include more countries and segments and customize the report based on the final requirement.
- Get a competitive advantage in your industry by knowing the report findings and making a positive impact on your revenues and operations.
- Our analysts are always ready to provide more help and pertinent information if you need any additional assistance.