Global Fish Oil Market Size and Share Analysis - Growth Trends and Forecast Report 2025-2033
Buy NowGlobal Fish Oil Market Trends & Summary
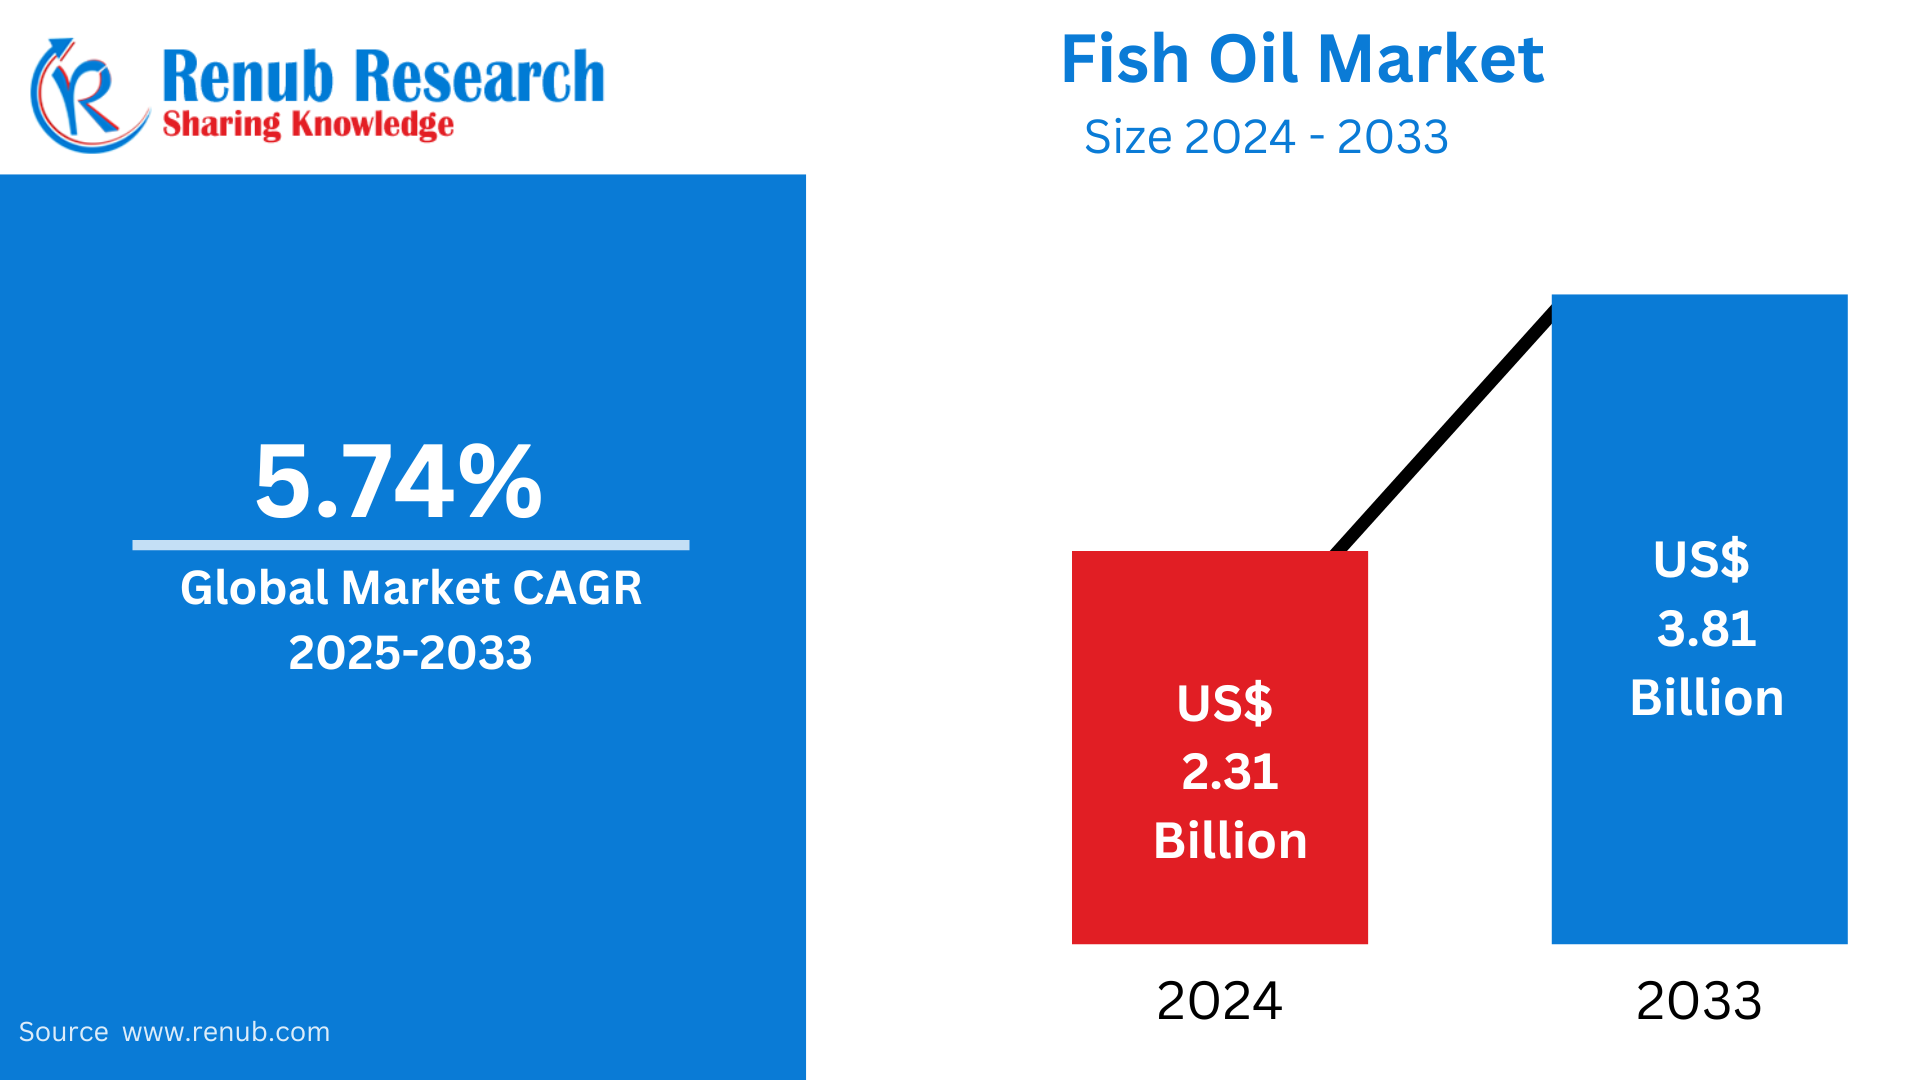
Fish Oil Market is expected to reach US$ 3.81 billion in 2033 from US$ 2.31 billion in 2024, with a CAGR of 5.74% from 2025 to 2033. Some of the factors driving the market expansion include growing awareness of the benefits of omega-3 fatty acids, rising rates of chronic diseases, the growing aquaculture sector, the increasing demand for functional foods, encouraging government initiatives, technological advancements, and an aging population.
Fish Oil Market Global Report by Source (Anchoveta, Sardine, Capelin, Menhaden, Herring, Anchovy, and Others), Distribution Channel (Hypermarkets and Supermarkets, Specialty Stores, Online Stores, and Others), End User (Aquaculture, Animal Feed, Nutritional Supplements, Pharmaceutical, and Others), Countries and Company Analysis 2025-2033.
Fish Oil Industry Overview
Fish oil, which is made from the body tissue of oily fish like salmon, tuna, anchovies, and others, contains omega 3 fatty acids, which have a number of health advantages. Alpha-linolenic acid (ALA), docosahexaenoic acid (DHA), and alpha-linolenic acid (ALA) are essential components of omega-3 fatty acids, which is why they are used in the manufacturing of nutritional supplements.
An abundance of essential omega 3 fatty acids found in fish oil may help lower blood pressure, bad cholesterol, and the risk of coronary heart disease, all of which are predicted to fuel the market's expansion. Aquaculture operations are being boosted by the abundance of land available for fish farming and the pleasant climate in countries like China and India. This is also anticipated to fuel the growth of the fish oil sector in the years to come.
Growth Drivers for the Fish Oil Market
Growing Chronic Illness Prevalence
An important element driving the market expansion for fish oil is the rising incidence of chronic illnesses. Conditions like cardiovascular diseases, diabetes, arthritis, and mental health disorders are often caused by changes in lifestyle and demographics. In 2021, 29.7 million Americans of all ages, or 8.9% of the total population, were diagnosed with diabetes, according to the Centers for Disease Control and Prevention (CDC). Omega-3 fatty acid-rich fish oil has demonstrated therapeutic effects in the prevention and management of many chronic diseases.
Growing Aquaculture Sector
The market for fish oil has benefited greatly from aquaculture's explosive rise. Together, fish farming and other aquatic life farming practices provide a significant global food source. The nutritional profile of aquaculture diets is improved by the significant use of fish oil, which aids in the growth and illness prevention of farmed fish. These diets' inclusion of fish oil guarantees that farmed fish are high in omega-3 fatty acids, which appeals to consumers who are health-conscious. great-quality fish oil is in great demand as aquaculture becomes more significant due to the depletion of wild fish supplies and the growing need for sustainable seafood sources. The use of fish oil is also encouraged by advancements in aquafeed formulations, which are motivated by the need for economical and sustainable components.
Growing Knowledge of Omega-3 Fatty Acids' Health Benefits
The market for fish oil is primarily driven by rising awareness of the advantages of the omega-3 fatty acids found in fish oil. Omega-3 fatty acids are essential for brain and cardiovascular health as well as for lowering the risk of inflammation. Furthermore, they include heart-healthy lipids that help lower blood pressure, triglyceride levels, and artery-clogging fat. Furthermore, because of their strong anti-inflammatory qualities, omega-3 fatty acids are especially useful in the treatment of arthritis and other inflammatory conditions. In addition, growing consumer awareness brought on by public health initiatives and more media attention is significantly propelling the growth of the fish oil market.
Challenges in the Fish Oil Market
Price Volatility
Variable fishing yields, supply chain interruptions, and environmental variables including climate change are the main causes of price volatility in the fish oil market. Limited fish stocks and processing costs might lead to unpredictable price spikes as demand for fish oil rises. Both consumers and manufacturers are impacted by this volatility, which casts doubt on the market. Furthermore, producers find it challenging to maintain stable product pricing due to price changes, which has an impact on market stability and profitability.
Competition from Alternatives
The market for fish oil faces competition from other sources of omega-3 fatty acids. Plant-based alternatives, like algal oil, provide a sustainable, vegetarian substitute that appeals to customers who are concerned about their health and the environment. These substitutes are appealing to people looking for safer solutions because they do not provide the same risk of contamination as heavy metals. The market for fish oil is becoming more competitive as consumer tastes move toward plant-based or non-fish sources, which could restrict market share and growth.
Fish Oil Market Overview by Regions
The market for fish oil is expanding globally, with North America and Europe having the highest demand because of rising health consciousness and high omega-3 intake. The need for functional foods and growing health consciousness are driving robust growth in Asia-Pacific, especially in China and Japan. Despite supply chain and environmental sustainability issues, Latin America and the Middle East remain developing markets. Trends toward sustainable sourcing and changing consumer preferences have an impact on the market's growth.
United States Fish Oil Market
A greater emphasis on preventative healthcare measures is a result of United States’s growing obesity problem. One possible benefit of fish oil is that it may help manage obesity-related illnesses like heart disease and hypertension. Additionally, the U.S. population is seeking alternate ways of fulfilling their daily requirement of polyunsaturated fatty acids, and fish oil can effectively address this demand. To lower the risk of coronary heart disease, ischemic stroke, and congestive heart failure, the American Heart Association (AHA) advises consuming fish-based products.
The U.S. Department of Agriculture (USDA) recommends eating at least 227 grams of fish each week due to its high fatty acid content, and unhealthy lifestyle choices are increasing Americans' risk for cardiovascular illnesses. To assist manage high triglyceride levels, 4 grams of omega-3 fatty acids should be consumed each day. Osteoporosis, which lowers bone density and becomes a major problem when combined with fat, affects around 10 million Americans. It raises bone strain and results in chronic inflammation due to the excess weight. Omega-3 fatty acids, which are found in fish oil, have anti-inflammatory properties and can aid in weight loss and bone density building. The market is expected to grow significantly as a result of these factors combined.
Germany Fish Oil Market
The market for fish oil in Germany is growing as more people become aware of the advantages omega-3 fatty acids provide for heart health, brain function, and inflammation control. Customers looking for natural, preventative healthcare solutions are increasingly purchasing fish oil supplements. The robust pharmaceutical and nutraceutical industries in Germany contribute to the market's expansion. Fish oil products are also widely available to a health-conscious populace thanks to the nation's well-established retail and e-commerce platforms, which supports the market's ongoing expansion.
India Fish Oil Market
The market for fish oil in India is expanding significantly as more people become aware of the advantages omega-3 fatty acids have for heart, brain, and joint health. The need for fish oil supplements is also being increased by the rising incidence of lifestyle diseases including diabetes and cardiovascular disorders. The AvailOm platform for high-load omega-3 powder was launched in India in September 2021. An important milestone for omega-3 products was reached when the Food Safety and Standards Authority of India (FSSAI) allowed Evonik to import and sell AvailOm in the nation. It is anticipated that this action and the launch of new goods will increase the market's supply of premium fish oil. India offers significant growth prospects for fish oil products due to its sizable, health-conscious populace and developing retail infrastructure. The country's demand for omega-3 supplements is expected to grow as the market develops due to rising awareness and regulatory backing.
Saudi Arabia Fish Oil Market
Growing health consciousness and the need for omega-3 supplements for heart health, joint mobility, and general well-being are driving the Saudi Arabian fish oil market's expansion. The market has a lot of room to develop as the population grows and the prevalence of chronic illnesses rises. The demand for fish oil products in the region is further supported by Saudi Arabia's well-established healthcare system and rising inclination towards preventative health measures.
Fish Oil Market Segments
Source
- Anchoveta
- Sardine
- Capelin
- Menhaden
- Herring
- Anchovy
- Others
Distribution Channel
- Hypermarkets and Supermarkets
- Specialty Stores
- Online Stores
- Others
End User
- Aquaculture
- Animal Feed
- Nutritional Supplements
- Pharmaceutical
- Others
Countries
North America
- United States
- Canada
Europe
- France
- Germany
- Italy
- Spain
- United Kingdom
- Belgium
- Netherlands
- Turkey
Asia Pacific
- China
- Japan
- India
- South Korea
- Thailand
- Malaysia
- Indonesia
- Australia
- New Zealand
Latin America
- Brazil
- Mexico
- Argentina
Middle East & Africa
- Saudi Arabia
- UAE
- South Africa
All the Key players have been covered from 5 Viewpoints:
- Company overview
- Key Persons
- Product Portfolio
- Recent Development & Strategies
- Sales Analysis
Key Players Analysis
- Croda International Plc.
- Mukka Proteins Limited
- FKS Multi Agro
- GC Rieber Oil
- Colpex International SAC
- Corpesca S.A.
- FF Skagen A/S
- Nutrifynn Caps, Inc.
| Report Features | Details |
| Base Year |
2024 |
| Historical Period |
2021 - 2024 |
| Forecast Period |
2025 - 2033 |
| Market |
US$ Billion |
| Segment Covered |
By Source, By Distribution Channel, By End Use and By Countries |
| Countries Covered |
|
| Companies Covered |
|
| Customization Scope |
20% Free Customization |
| Post-Sale Analyst Support |
1 Year (52 Weeks) |
| Delivery Format |
PDF and Excel through Email (We can also provide the editable version of the report in PPT/Word format on request) |
Key Questions Answered in Report:
-
What is the current size of the global fish oil market, and what is the expected growth rate (CAGR) from 2025 to 2033?
-
What are the major drivers fueling the growth of the global fish oil market?
-
What challenges are limiting the fish oil market’s growth potential, especially in terms of pricing and alternatives?
-
Which fish species are the primary sources of fish oil, and how do their market shares compare?
-
What are the main end-use industries for fish oil (e.g., aquaculture, pharmaceuticals, supplements), and which segment holds the largest share?
-
How is the distribution of fish oil segmented across different retail channels like hypermarkets, specialty stores, and online platforms?
-
Which regions and countries are dominating the global fish oil market, and what are the growth trends in key markets such as the U.S., Germany, India, and Saudi Arabia?
-
What role does growing consumer awareness of omega-3 fatty acid benefits play in market expansion?
-
Who are the major companies in the global fish oil industry, and what are their strategies, recent developments, and market performance?
-
How is technological advancement in aquafeed and nutritional supplements shaping the future demand and application of fish oil globally?
Customization Services available
- Analysis of Market Size and Its Segments
- More Company Profiles (Upto 10 without any additional cost):
- Additional Countries (Other than mentioned Countries):
- Region/Country Specific Reports:
- Market Entry Strategy:
- Region-Specific Market Dynamics:
- Regional Market Share Analysis:
- Trade Analysis:
- Production Insights:
- Others Customized Requests:
For more information contact our analysts.
Need More Assistance?
- Talk to our analysts to get more precious information on the current market trends.
- Include more countries and segments and customize the report based on the final requirement.
- Get a competitive advantage in your industry by knowing the report findings and making a positive impact on your revenues and operations.
- Our analysts are always ready to provide more help and pertinent information if you need any additional assistance.