Europe Movie Market Size and Share Analysis - Growth Trends and Forecast Report 2025-2033
Buy NowEurope Movie Market Trends & Summary
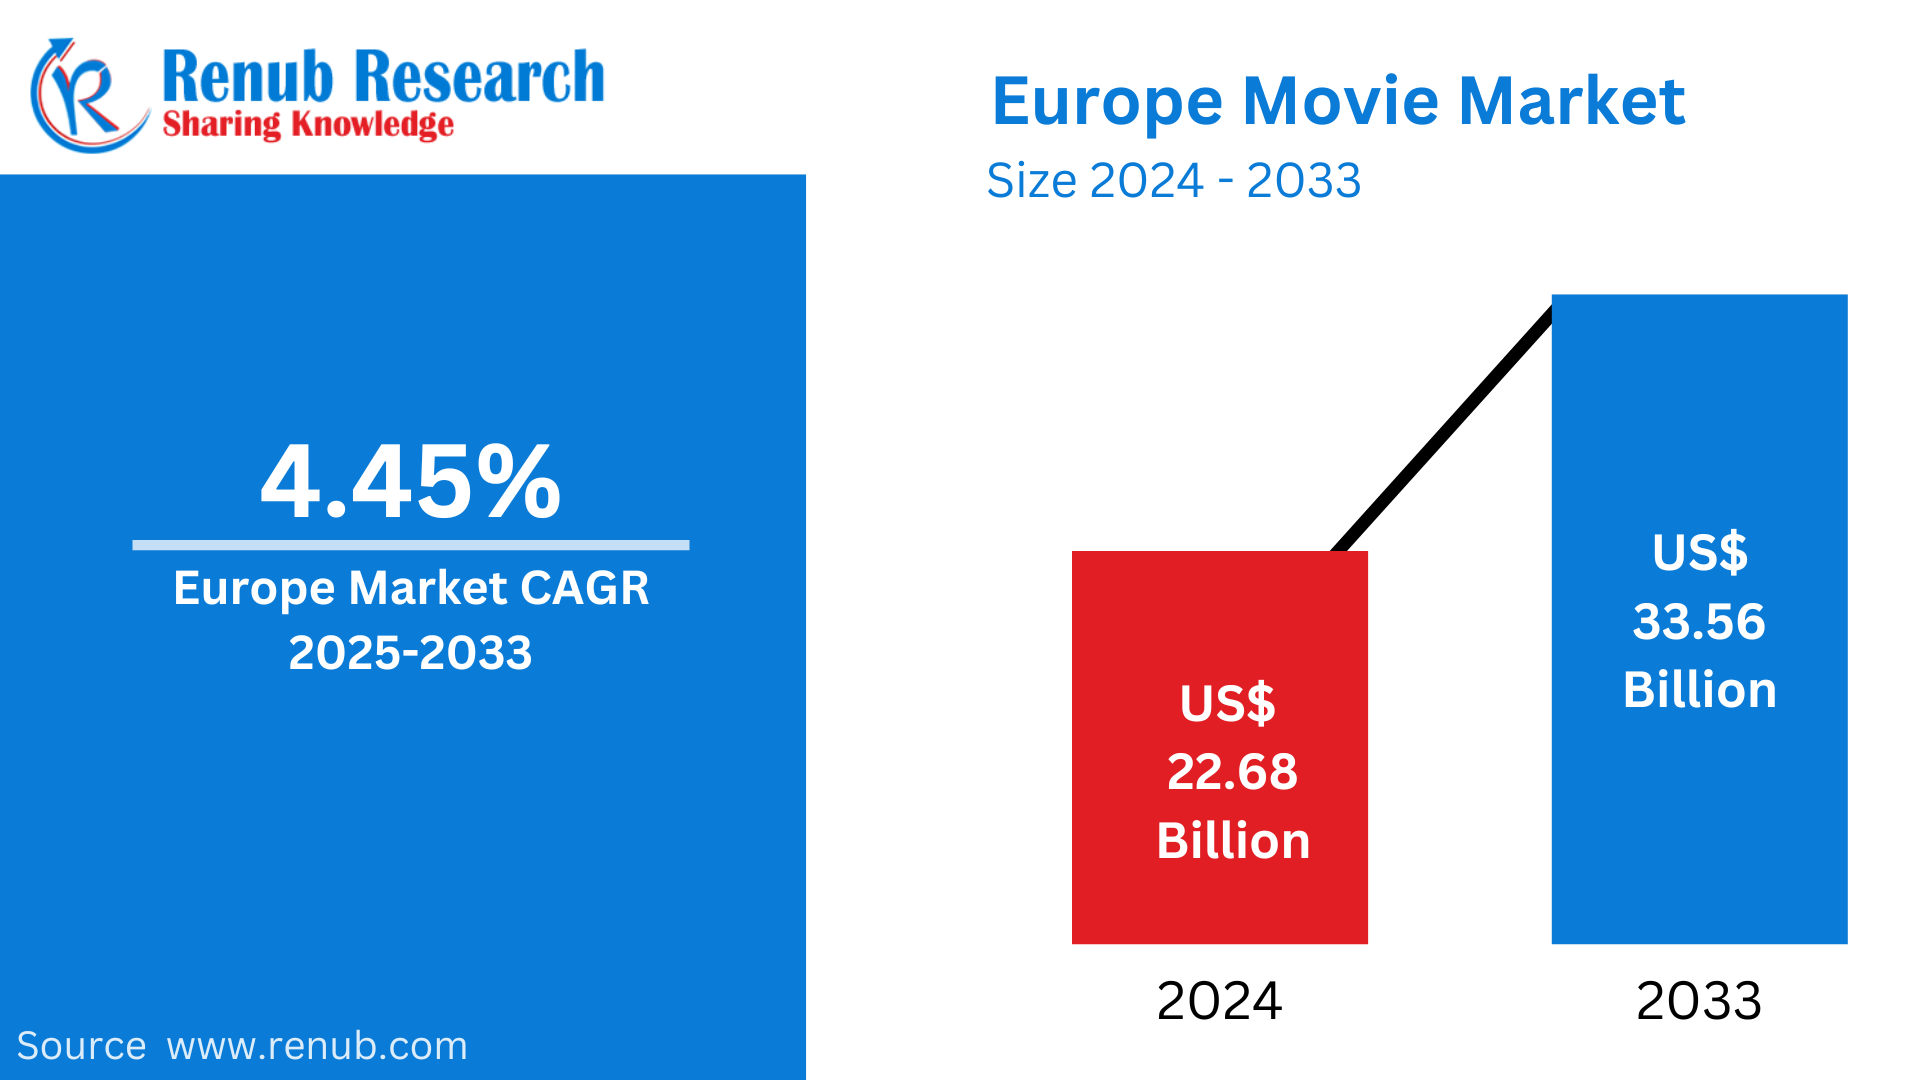
Europe Movie market is expected to reach US$ 33.56 billion in 2033 from US$ 22.68 billion in 2024, with a CAGR of 4.45% from 2025 to 2033. The expansion of cinema chains, the high demand for a variety of material, growing digital streaming, technological improvements, and increased consumer expenditure on entertainment are the main factors driving the growth of the European film market.
The report Europe Movie Market & Forecast covers by Distribution Income (Sale of Movie Tickets, Advertisement Income, Sale of Food & Beverages), Screen Type (Digital Non -3D, Digital 3D, and Others), Gender (Male, and Female), Age Group (Age Groups (7-11), Age Groups (12-14), Age Groups (15-24), Age Groups (25-34), Age Groups (35-44), and Age Groups 45+)), Country and Company Analysis 2025-2033.
Europe Movie Industry Overview
The growing popularity of digital streaming services, growing consumer desire for localized and diversified content, and technological developments in movie theater experiences are all contributing to the continuous rise of the European film business. Viewing patterns are changing as a result of major streaming services like Netflix, Amazon Prime, and Disney+ growing their offers to appeal to European customers. Large-budget blockbusters and the rising desire for premium cinematic experiences, including IMAX and 3D films, have helped traditional movie theater chains survive and maintain a strong presence in nations like France, the UK, and Germany. The market's expansion is also fueled by Europe's rich cinema history and rising investments in domestic and foreign films. The international visibility of European cinema is further bolstered by government subsidies and film festivals such as Cannes and Berlin.
As of October 2023, the IMAX website has 292 theaters in operation across several European nations. These screens, along with 3-D technology and Dolby Atmos sound, improve the film experience and draw viewers into theaters.
Growth Drivers for the European Film Industry
The Rise of Digital Streaming Platforms
The way that European viewers watch movies has changed significantly as a result of the emergence of digital streaming services like Netflix, Amazon Prime, Disney+, and regional offerings. These services provide unmatched ease by enabling users to access a huge collection of international films from any device at any time. Because consumers prefer the flexibility of streaming, traditional TV viewing and moviegoing have decreased as a result of this change. In order to satisfy local tastes, streaming providers are also making more and more investments in specialized content, such as European TV shows and movies. This increases the attraction of European cinema abroad while simultaneously fostering the development of regional film businesses. The popularity of streaming has increased accessibility and diversity in cinema consumption, which has led to a growth in demand for both domestic and foreign films.
Increasing Demand for Localized Content
The European film business is mostly driven by the rising desire for localized content, as viewers look for movies that more accurately represent their cultural experiences and beliefs. To appeal to a wide range of European viewers, streaming services like Netflix, Amazon Prime, and Disney+ are making significant investments in regionally customized programs. These portals include a variety of locally produced films with dubbing and subtitles, as well as original content, guaranteeing multilingual accessibility. Because it tackles regionally specific themes, societal challenges, and customs, localized storytelling enables viewers to form stronger emotional bonds. The worldwide popularity of European cinema has increased as a result of this tendency, which has also given European filmmakers the ability to create content that is suited to regional preferences while earning international recognition.
Growing Technological Advancements
By drawing more people to theaters and increasing the appeal of high-tech cinema formats, technological developments have greatly improved the European film market. Sharper images, more distinct sound, and a more realistic feeling are all features of immersive viewing experiences made possible by innovations like Dolby Atmos, IMAX, and 4K resolution. These developments encourage people to choose the cinema experience over watching at home by making moviegoing more alluring. New cinematic experiences and interactive storytelling are made possible by the growing popularity of virtual reality (VR) and augmented reality (AR) technologies. The expansion of the European film business is ultimately fueled by theaters' adoption of immersive and high-definition technologies, which give consumers an even stronger incentive to pick the big screen. Additionally, these innovative forms foster a deeper understanding of the craft of filmmaking.
Challenges in the Europe Movie Market
Competition from Streaming Services
The European film market is now under serious competition from streaming services. By providing enormous movie and TV show libraries that are accessible from anywhere at any time, platforms like Netflix, Amazon Prime, Disney+, and regional players have completely changed the way people consume content. Many audiences have chosen streaming over traditional movie theater visits because of its convenience, particularly for original films. These services are drawing customers away from theaters as the focus on creating original content increases, which lowers box office receipts. A change in viewing patterns is also influenced by the convenience of binge-watching television shows and the option to watch whenever it suits you. Cinemas are under further pressure to compete with streaming's convenience and diversity as streaming services continue to make significant investments in localized and original European content.
High Production Costs
The European film business is severely hampered by high production expenses, especially for small and mid-sized studios. Filmmaking with cutting-edge technologies, such as 4K, IMAX, or virtual reality (VR), necessitates a large investment in special effects, equipment, and qualified staff. Smaller studios are unable to compete with major Hollywood films that have substantially larger budgets and resources as a result of this financial barrier. Because of this, European filmmakers frequently find it difficult to create high-budget movies that can compete on a worldwide scale, especially when it comes to visual quality and scope. Despite the rich history of European film, the high expense of modern technology and marketing stifles creativity and makes it difficult to draw in international audiences, thus studios are forced to concentrate on more affordable projects.
Movie ticket sales continue to dominate revenue in the European market
The enduring charm of the conventional cinematic experience, enhanced by technologies like IMAX, Dolby Atmos, and 3-D, keeps audiences engaged. European governments recognizing the cultural and economic value of the film enterprise offer aid through monetary incentives and cultural programs, further driving cinema attendance. Also, the collaborative efforts amongst European nations in movie projects create a diverse and enriched cinematic landscape, attracting audiences to theatres. The immersive and communal nature of theatres, supported by government initiatives, ensures that ticket sales continue to generate considerable revenue in the dynamic Europe movie market.
Digital non-3D cinema is the most popular form of cinema in the European Film Industry
The accessibility and cost-effectiveness of digital formats appeal to a vast audience, ensuring widespread distribution. With numerous cultural tastes, European audiences find digital non-3-D movies more versatile in catering to various possibilities. The convenience of streaming structures further expands the reach of non-3-D content material. Moreover, governmental aid and tasks spotting the economic and cultural value of the film industry contribute to the prevalence of digital non-3-D formats. As technology advances and conventional cinema competes with virtual alternatives, the flexibility, affordability, and wide accessibility of non-3-D content are prominent in the evolving European movie panorama.
Male domination in film is a result of historical gender imbalances
Persistent stereotypes and biases have restrained possibilities for females in critical roles, inclusive of administrators, producers, and writers. The enterprise's long-standing patriarchal structure perpetuates a desire for male-centric narratives, affecting each on-screen illustration and behind-the-scenes decision-making. While strides are being made closer to inclusivity, with projects selling female filmmakers, the entrenched gender disparity remains a venture. Breaking these patterns requires continued efforts to dismantle systemic limitations, encourage numerous views, and foster an inclusive film enterprise that displays the richness of human experience.
Trends are influenced by the 15–24 age bracket, which controls the European film market
The 15-24 age demographic, characterized by high social engagement and technological fluency, actively participates in the film-going experience. They contribute extensively to box office revenue with disposable income from part-time jobs or parental aid. Further, their alternatives regularly drive traits, influencing movie selections and producing word-of-mouth advertising. The diverse storytelling and genres that resonate with this age institution, starting from blockbuster franchises to impartial cinema, similarly solidify their impact on the Europe movie market, making them a key demographic for filmmakers and studios.
European Film Industry Overview by Regions
By country, the Europe Movie Market is broken up into Austria, Belgium, Bulgaria, Croatia, Czechia, Denmark, Finland, France, Germany, Hungary, Ireland, Israel, Italy, Lithuania, Netherlands, Norway, Poland, Russia, Spain, Sweden, Switzerland, Turkey, UK, Portugal, and Rest of Europe.
France Film Industry
France gave rise to filmmaking pioneers like Pathé and Gaumont, which dominated early 20th-century films worldwide and established a thriving film culture. Significant government assistance, including financial incentives, tax exemptions, and cultural initiatives, is what gives the nation its long-lasting influence. Control over production, distribution, and exhibition is guaranteed by a special studio system that includes organizations like Pathé and Gaumont. The auteur directors of France's thriving, unbiased film industry contribute diversity and get praise from all around the world. Even as France's central role in the European film landscape is cemented by prominent festivals like Cannes and active international exports, a strong domestic market driven by high attendance encourages cultural appreciation.
United Kingdom Movie Market
Driven by a strong cinema culture and a rich film tradition, the UK movie market is a major participant in Europe. The UK has a booming film industry, with towns like Manchester and Edinburgh hosting a lot of film activity and London acting as a key global production hub. The growth of digital streaming services like Netflix, Amazon Prime, and Disney+ has affected the business, even if the box office is still strong and both domestic and foreign blockbusters are doing well. Cinemas continue to draw audiences despite the rise of on-demand services, particularly with cutting-edge technologies like Dolby Atmos and IMAX.
Furthermore, the UK provides alluring tax breaks like Film Tax Relief (FTR), which promotes both domestic and foreign film production. But there are still issues with streaming competition, growing production costs, and piracy.
Germany Movie Market
With a robust film production industry and a strong cinema culture, Germany boasts one of the biggest and most significant film marketplaces in Europe. Germany has prominent film festivals like the Berlin International Film Festival (Berlinale), which greatly promotes both domestic and foreign films. Major towns like Berlin and Munich serve as important production hubs. Even while the box office is still strong, particularly for Hollywood blockbusters, Germany's film industry is renowned for its varied domestic productions that feature German-language films and appeal to local audiences. Although viewing preferences have changed due to the popularity of streaming services like Netflix, Amazon Prime, and local platforms, movie theaters still do well thanks to premium experiences like IMAX and 3D screenings.
Germany also provides funding and subsidies for movies, which support both domestic and foreign producers. However, there are obstacles like piracy and competition from streaming services.
Switzerland Movie Market
Switzerland has a comparatively modest but vibrant film industry that places a high value on both domestic and foreign films. Swiss films are honored in esteemed festivals like the Locarno Film Festival, which showcases the nation's diverse cultural landscape. Swiss fans appreciate local films, which are frequently in French, German, and Italian, representing the linguistic diversity of the nation, even when foreign blockbusters do well at the box office. Although watching patterns have changed due to the emergence of streaming services like Netflix and Amazon Prime as well as regional players like Swisscom TV, traditional movie theaters are still much-liked, particularly in big cities like Zurich and Geneva. With premium formats like IMAX and 3D, Swiss movie theaters prioritize providing top-notch viewing experiences. The Swiss government promotes the development of the local film industry by subsidizing domestic productions. However, there are still issues with piracy and competition from streaming providers.
Europe Movie Market Segments
Distribution Income
1. Sale of Movie Tickets
2. Advertisement Income
3. Sale of Food & Beverages
4. Others
Screen Type
1. Digital Non -3D
2. Digital 3D
3. Others
Gender
1. Male
2. Female
Age Group
1. Age Groups (7-11)
2. Age Groups (12-14)
3. Age Groups (15-24)
4. Age Groups (25-34)
5. Age Groups (35-44)
6. Age Groups 45+)
Country – Market breakup in 25 countries Europe Movie Industry viewpoints:
1. Austria
2. Belgium
3. Bulgaria
4. Croatia
5. Czechia
6. Denmark
7. Finland
8. France
9. Germany
10. Hungary
11. Ireland
12. Israel
13. Italy
14. Lithuania
15. Netherlands
16. Norway
17. Poland
18. Russia
19. Spain
20. Sweden
21. Switzerland
22. Turkey
23. UK
24. Portugal
25. Rest of Europe
All the Key players have been covered from 3 Viewpoints:
• Overview
• Recent Developments
• Revenue Analysis
Company Analysis:
1. CGV Cinemas
2. Cinemark Holding, Inc.
3. B&B Theatres
4. AMC Theatres
5. Marcus Theatres
6. Empire Cinema
7. AMC
8. Regal Cinemas
Report Details:
| Report Features | Details |
| Base Year |
2024 |
| Historical Period |
2020 - 2024 |
| Forecast Period |
2025 - 2033 |
| Market |
US$ Billion |
| Segment Covered |
Distribution Income, Screen Type, Gender, Age Group and Countries |
| Countries Covered | 1. Austria 2. Belgium 3. Bulgaria 4. Croatia 5. Czechia 6. Denmark 7. Finland 8. France 9. Germany 10. Hungary 11. Ireland 12. Israel 13. Italy 14. Lithuania 15. Netherlands 16. Norway 17. Poland 18. Russia 19. Spain 20. Sweden 21. Switzerland 22. Turkey 23. UK 24. Portugal 25. Rest of Europe |
| Companies Covered | 1. CGV Cinemas 2. Cinemark Holding, Inc. 3. B&B Theatres 4. AMC Theatres 5. Marcus Theatres 6. Empire Cinema 7. AMC 8. Regal Cinemas |
| Customization Scope |
20% Free Customization |
| Post-Sale Analyst Support |
1 Year (52 Weeks) |
| Delivery Format |
PDF and Excel through Email (We can also provide the editable version of the report in PPT/Word format on request) |
Key Questions Answered in This Report:
- What is the projected market size of the Europe movie market in 2033?
- What is the expected CAGR of the Europe movie market from 2025 to 2033?
- What are the key factors driving the growth of the European film market?
- How are digital streaming platforms impacting the traditional movie theater business in Europe?
- What role do technological advancements play in enhancing the cinema experience?
- What are the major challenges facing the European movie market?
- How does government support contribute to the growth of the European film industry?
- Which age group has the most influence on movie trends in Europe?
- Why does digital non-3D cinema remain the most popular format in Europe?
Customization Services available
- Analysis of Market Size and Its Segments
- More Company Profiles (Upto 10 without any additional cost):
- Additional Countries (Other than mentioned Countries):
- Region/Country Specific Reports:
- Market Entry Strategy:
- Region-Specific Market Dynamics:
- Regional Market Share Analysis:
- Trade Analysis:
- Production Insights:
- Others Customized Requests:
For more information contact our analysts.
Need More Assistance?
- Talk to our analysts to get more precious information on the current market trends.
- Include more countries and segments and customize the report based on the final requirement.
- Get a competitive advantage in your industry by knowing the report findings and making a positive impact on your revenues and operations.
- Our analysts are always ready to provide more help and pertinent information if you need any additional assistance.